Retention in SQL: How to Calculate User and Cohort Retention?

Categories:
 Written by:
Shivani Arun
One-stop shop for product data scientists and job candidates: what is retention and its different types, how to calculate them, with the SQL application.
Retention metrics are core to understanding the long-term impact of new feature launches and are often one of the most complex metrics to calculate in SQL. This article explores the various approaches to understanding and estimating retention.
What Does Retention Actually Mean?
Retention is the number of users who continue to use the product after a given point in time.
Retention rate is the percentage of retained customers.
In product data science, retention is a critical measure of understanding how sticky a product feature or experience change is for customers.
Why Companies Care?
Companies love using retention to answer important business questions, such as measuring product health, translating the impact of short-term initiatives to long-term customer stickiness, setting targets for product growth, and LTV modeling, to name a few.
Why? Because it’s typically cheaper and more sustainable than acquisition. Also, good, stable retention predicts stable revenue and signals the product's value to customers.
Difference Between Retention and Churn
Retention and churn are the two sides of the same coin. Retention rate is the percentage of users who stay. Churn rate is the opposite: the percentage of users who leave.
If retention is 65%, churn is 35%.
How to Calculate Retention Rate
OK, you know what it is, but how do you actually calculate retention rate?
It’s calculated by dividing the number of retained customers by the number of customers at the beginning of the period. Important note: Retention does not include new customers.
Here’s the formula.
Example
Here’s a simple example to demonstrate the calculation.
- Number of customers on 31 January: 1,000
- New customers in February: 800
- Number of customers on 28 February: 1,150
We plug the values into the formula above to get the retention rate.
The retention rate shows that the company kept only 35% customers in February. (Also, the churn rate is, then, 65%.)
Why It’s Misleading Without Cohorts
The example shows how to calculate retention rate, but it’s still an aggregate month-over-month retention.
What I mean is that the 1,000 customers at the end of January are cumulative: they include customers acquired in January and those from all previous months. This mixes old and new customers. Why is that a problem? Because newer customers churn more!
Showing retention as an aggregate could hide that the product fails new customers, which will negatively impact growth in the long term.
Cohorts reveal such tendencies because they separate customers by start date.
Interview Framing: How is Retention Tested in Interviews?
In product and data interviews, retention is almost never tested by asking you straight: “Calculate retention.”
Instead, the data science interview questions are framed around product decisions and behavioral definitions. Here are several examples of the typical interview prompts:
- “What was Day-7 retention for users who signed up in January?”
- “Did feature X improve 30-day retention?”
- “How does monthly retention compare across cohorts?”
- “Calculate rolling 7-day retention rate.”
- “Compute churn rate for March.”
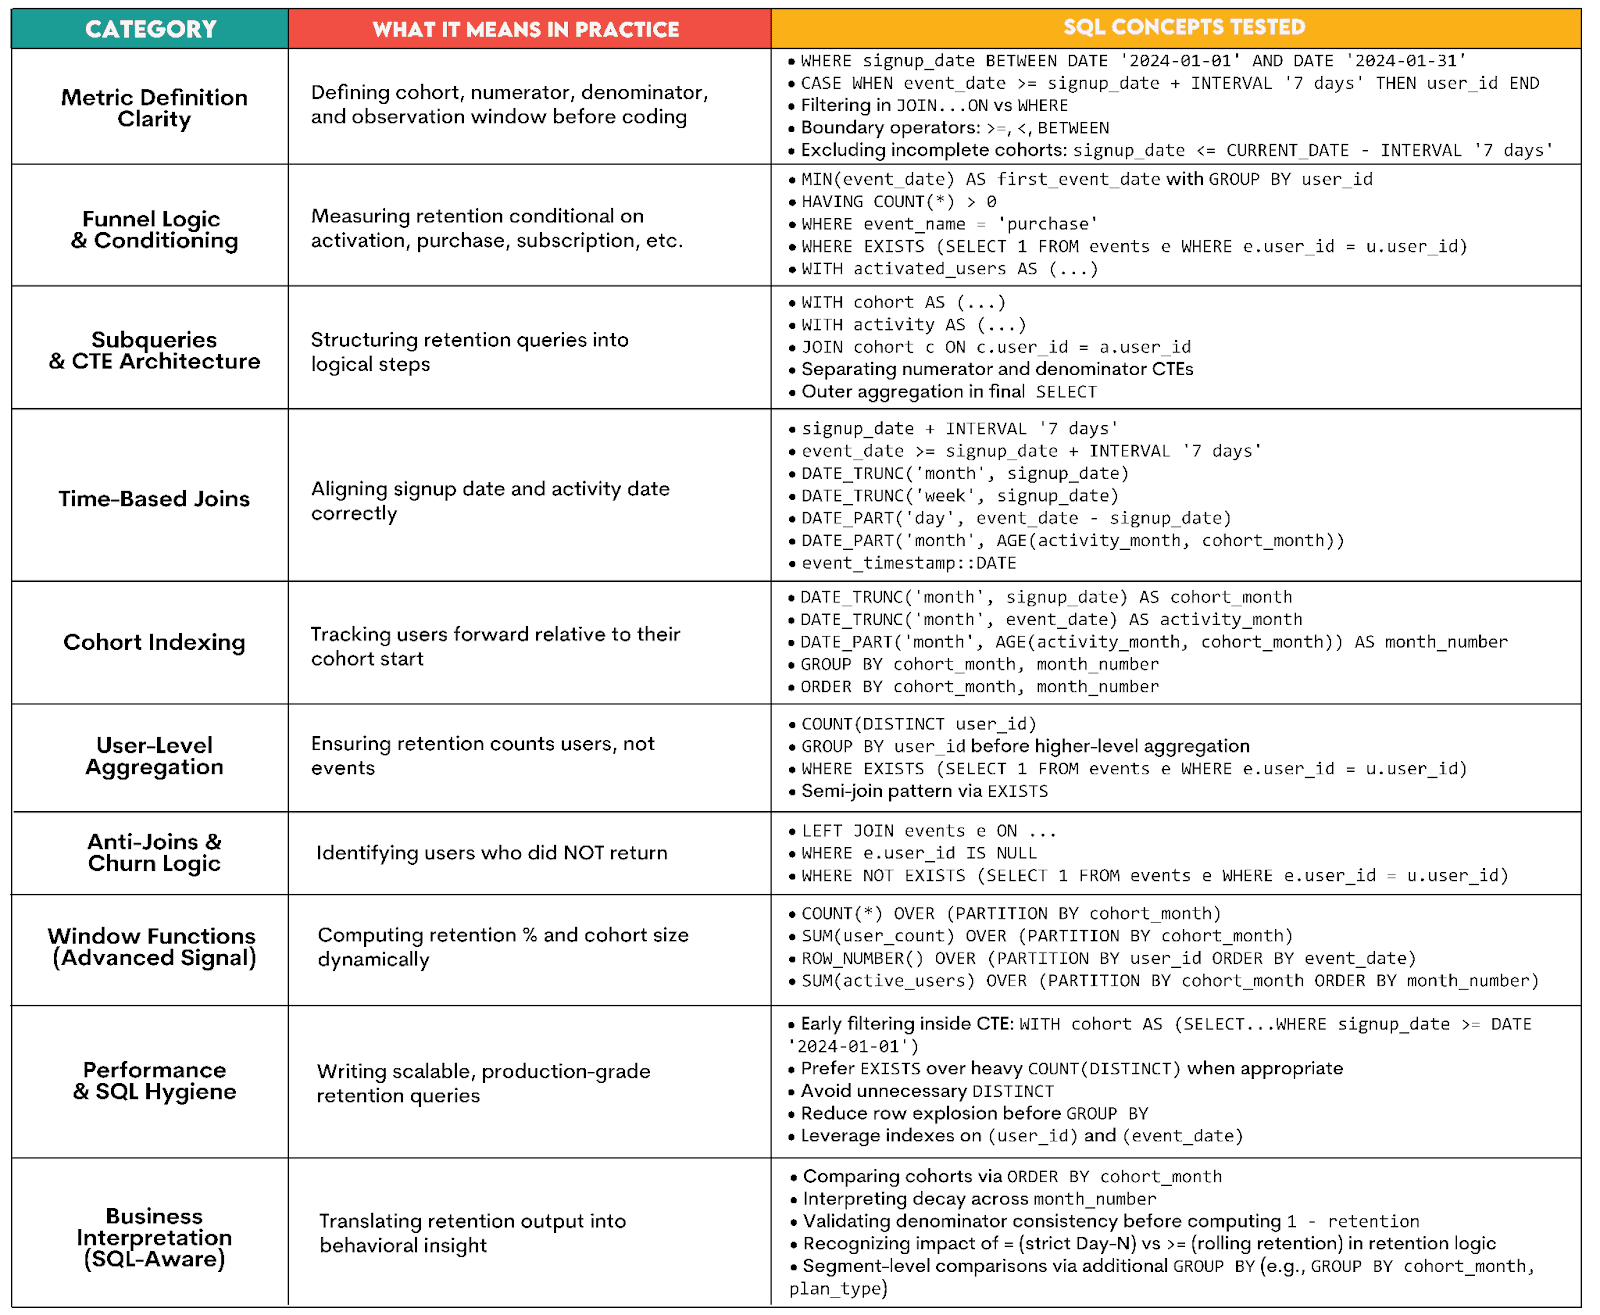
What the Interviews Are Testing
Generally speaking, SQL interviews test how you translate product decisions and behavioral definitions into SQL code.
Here’s what that specifically means in practice.
Retention Metrics: Different Flavors of Retention
Did you think there’s only one metric for retention, the one we’ve shown in the How to Calculate Retention Rate section? Oh, how wrong you were.
A bird’s-eye view of the broad taxonomy of retention metrics is shown in the visual.
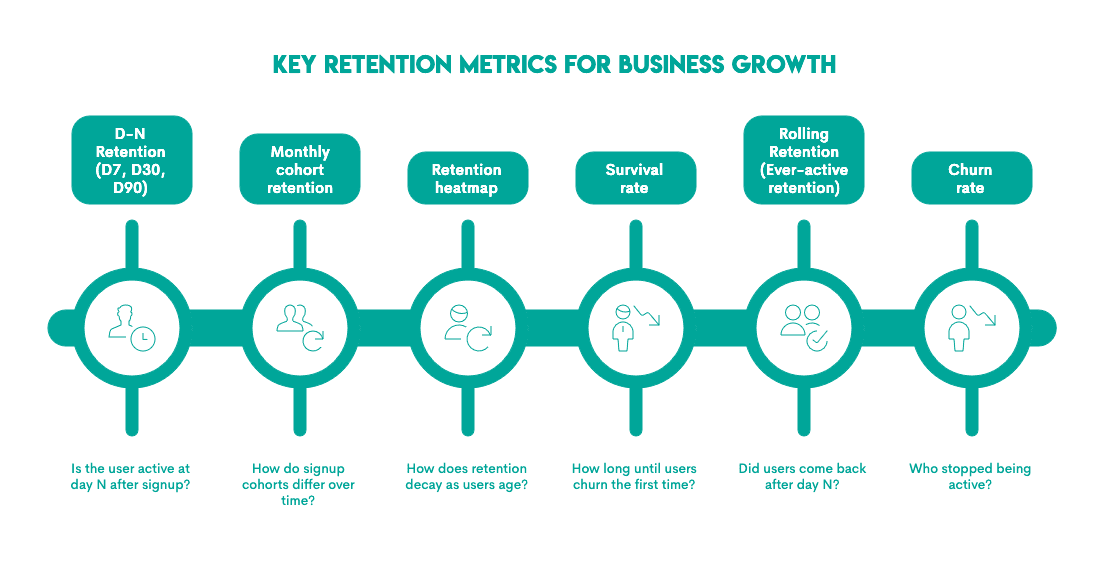
A few things to have in mind about these metrics and the retention interviews.
- If the question focuses on Day-N retention, it is usually framed as: is the user active X days after signup?
- Alternatively, if you are building a dashboard and want to assess whether retention rates are improving, a cohort-based retention definition is a fit-for-purpose approach because comparing cohorts yields insights into how retention changes over time while controlling for user age.
- Retention curves or heatmaps show how retention changes as users age or become more tenured. The percentage of users from a specific cohort who return in subsequent time periods (days, weeks, months).
The stickiest products have a smile curve of retention, which is a strong signal of great product-market fit, exceptional value, strong reactivation strategies, and network effects. - Survival rates and curves are more sophisticated measures of retention, indicating the probability that a customer remains active beyond a specific time t, or the time until a customer churns for the first time. The nuance between retention curves and survival curves is subtle and can be explored in more detail in this interesting LinkedIn post by Bharath Vaidyanathan.
- Rolling retention is another approach that evaluates whether users return on or after a given date or time threshold. It captures continued engagement beyond the initial use rather than an individual time snapshot.
- Churn rate is often described simplistically as 1-retention rate, as it indicates the number of customers who stopped/left at a specific point in time.
In this article, we’ll focus on Day-N retention, monthly cohort retention, and rolling retention, as these are the most common metrics.
User-Level Retention in SQL
Day-N retention is an excellent metric for tracking the short-term health of active users. It’s a relatively simple measure of user overlap between two dates and can be used to understand short-term engagement.
In interviews, user-level retention most commonly refers to Day-N retention, where each user is evaluated individually based on activity N days after signup.
However, they are not the same. User-level retention refers to the aggregation level, while Day-N retention refers to the time window. All retention metrics can be calculated on a user level. It’s just that user-level retention is most often implemented as Day-N retention, so they became somewhat of a synonym (incorrectly).
Here’s an example from Amazon that explains Day-N retention.
Practical Example
Here’s an example from Amazon that explains Day-N retention on the user-level.
First Day Retention Rate
Last Updated: February 2022
Calculate the first-day retention rate of a group of video game players. The first-day retention occurs when a player logs in 1 day after their first-ever log-in. Return the proportion of players who meet this definition divided by the total number of players.
The goal of this question is to find the day-1 retention rate, i.e., if the player logs in on the first day after their first ever login.
Based on the question text, let’s preview the dataset and select the columns of interest.
Dataset
This table gives us the login_date and player_id columns. One thing to note at this point is that the first-ever login is not a separate column. In interview settings, you will find that different companies may have different structures, and in some cases, the first login may be in a separate field.
Solution Walkthrough
To solve this question, there are four main things to keep in mind:
- Calculate the first-ever login for each player
- Watch for data truncation or right censoring. E.g., if the player’s last
login_date=current_dateor a maximum date defined in the dataset, day 1 retention can’t be calculated. This is often called survivorship bias and becomes extremely relevant as the look-forward period expands (e.g., from Day-1 to Day-30).
Note: An assumption to state to the interviewer in this scenario is: “I will assume that survivorship bias is already addressed in this dataset, and we have a sufficient look-forward period for all users.” If the interview disagrees, you will need to build in an explicit edge case into the query to address this in almost all types of retention questions. - Of all the players with their first-ever login and with the assumption of no survivorship bias, the next step is to identify players who logged in exactly one day after their first login using time-based joins.
- Finally, the last step includes calculating the proportion of these returning players relative to the total player base.
Now let’s review the solution.
We can see that the first CTE finds the minimum (first) login date for each player_id. Note that this is a blueprint for most retention queries because the analysis grain is the player, and finding the first-ever login requires grouping by player_id.
The LEFT JOIN is used to merge the first login to the player_logins and ensures that we only search for users who logged in exactly 1 day after.
Finally, the retention rate is calculated as the ratio of the players who returned after 1 day to the total number of players.
Here’s the output.
| retention_rate |
|---|
| 0.5 |
Now, for some edge cases you should think about.
Edge Case 1: Survivorship Bias
What if the question were modified to calculate the Day-30 retention rate? How would you account for survivorship bias? The key to succeeding here is to use the code you have already built as a building block and extend it with CTEs that create a clean link.
Here’s how I would modify the code.
1. Get the latest date in your data.
WITH max_date AS (
  SELECT MAX(login_date) AS max_login_date
  FROM players_logins
),
2. Filter eligible players from the first_login CTE by creating an eligible_players CTE
first_login AS (
  SELECT
    player_id,
    MIN(login_date) AS min_login
  FROM players_logins
  GROUP BY player_id
),
eligible_players AS (
  SELECT fl.player_id, fl.min_login
  FROM first_login fl
 JOIN max_date md on TRUE
  WHERE fl.min_login <= md.max_login_date - INTERVAL '30 days'
)
3. Calculate retention using only eligible players.
SELECT CAST(COUNT(DISTINCT pl.player_id) AS FLOAT) / COUNT(DISTINCT fl.player_id) AS retention_rate
FROM eligible_players fl
LEFT JOIN players_logins pl ON fl.player_id = pl.player_id
AND fl.min_login + INTERVAL '30 day' = pl.login_date
The full query then becomes:
Here’s the output.
| retention_rate |
|---|
| 0 |
You can now see how retention queries can get long very fast and are, as such, prone to errors. Practicing these patterns, especially in terms of having clear logic and communicating the building blocks, is a great way to demonstrate SQL expertise in interviews.
Edge Case 2: Varying Retention Windows
Let’s add another twist to this question and think about how we vary the day on which we are checking for retention. Suppose you had to build a filter that required you to update the retention rates for Day-N. It could be Day-1, Day-2, and so on.
The ideal way to do so is write dynamic SQL and set the day as a variable. To demonstrate how this can be done in an interview setting, to show how you think about questions at scale, is shown below.
The key pattern to grok in this context is a date spline. A date spline is basically a series that is generated in a separate CTE below. For example, this CTE shows a spline from Day 1 to Day 2.
day_series AS (
    SELECT generate_series(1, 2) AS n
)
This date spline is then used to create a dynamic time-based join using INTERVAL'1 day'*ds.n, and the query gets extended to include not just Day 1 but also Day 2 retention.
Here’s the query output.
| day_n | retention_rate |
|---|---|
| 1 | 0.5 |
| 2 | 0.33 |
A final note on date and time functions: Date and time functions are used extensively in retention calculations and happen to be the one area in SQL where different dialects have very different formats. Before interviewing for a company, it is wise to understand from public domains if the dialect of your choice is available on coding platforms so that you can get sufficient practice.
Cohort Retention in SQL
A key limitation of Day-N retention is that it conflates both new and returning users. Sudden changes in this metric are hard to diagnose because it conflates new and returning users. As a result, variability in user composition or changes to the onboarding experience can’t be detected by looking at this metric alone. To address these nuances, cohort retention is a more useful metric.
Cohort retention tells you whether the feature or product for which it is being measured shows signs of stickiness and habit formation. It also helps pick up on signals of onboarding quality since the age of users is often controlled for by looking at users who start at the same time.
For products intended for frequent use and monitoring in the early lifecycle, cohort retention is a strong metric that can serve as a key KPI of healthy engagement.
What Actually Is a Cohort?
No, it’s not a tactical military unit of the Roman army. At least in this context, it is not. But you get extra points for your history knowledge!
A cohort is a group of users/customers who share the same date for a certain activity. It can, for example, be users who signed up in January 2026. Or customers who first purchased in Week 32. Or subscribers who adopted Feature X in December 2025.
SQL Application: Calculating Retention by Day, Week, and Month
Cohort retention calculation in SQL involves three distinct steps.
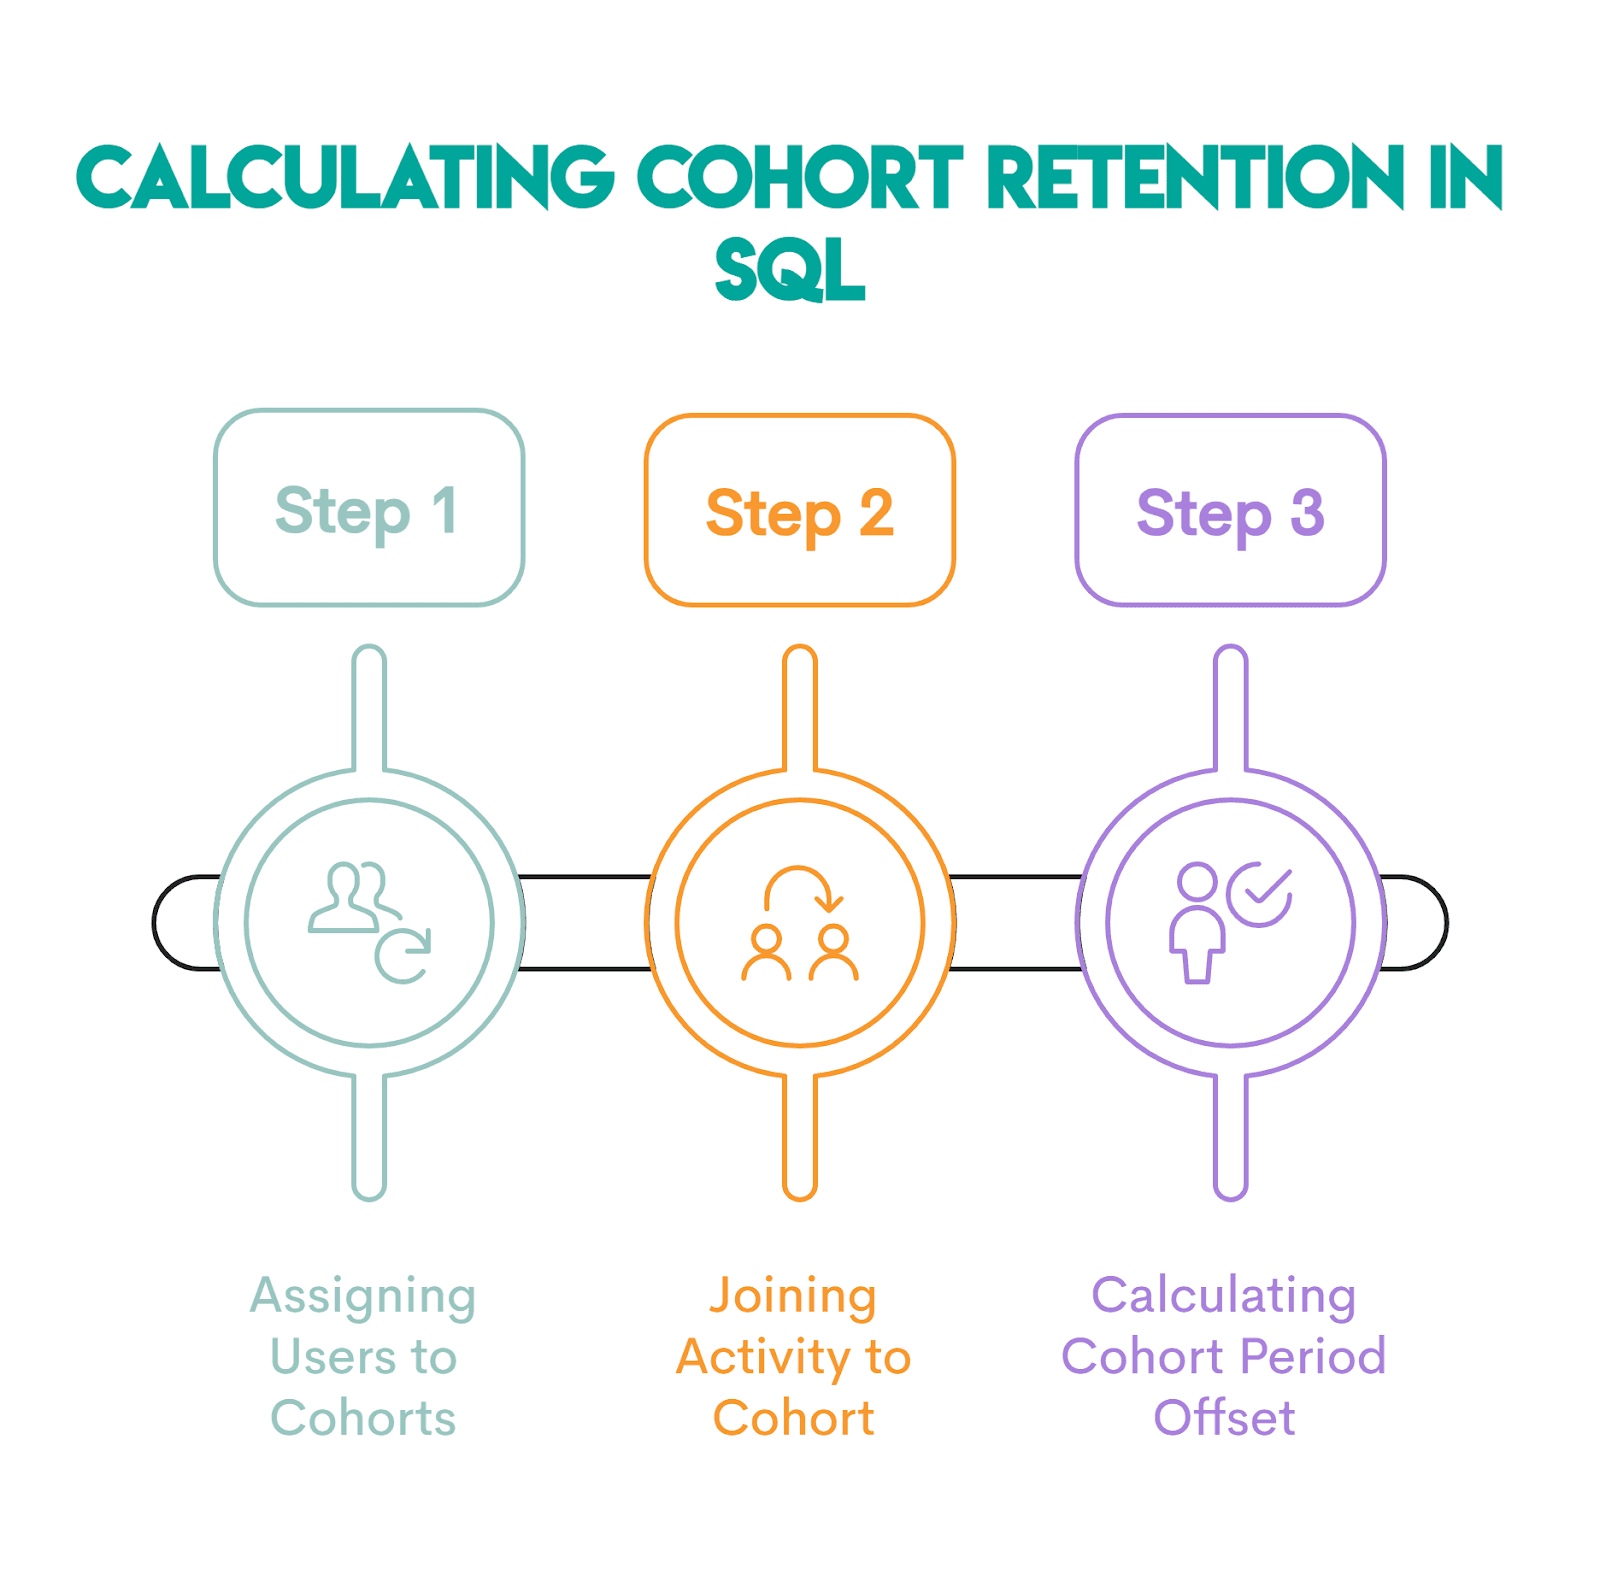
Step 1: Assigning Users to Cohorts
The first step is to define the cohort anchor, i.e., the start period. The generic SQL code below shows how this is done.
SELECT user_id,
       DATE_TRUNC('month', signup_date) AS cohort_month
FROM users;
DATE_TRUNC() truncates or “rounds” a timestamp to the first instance of a specified date part. For example, 2024-01-17 now becomes 2024-01-01. With this, every user who signed up in January will share the same date, i.e., 2024-01-01.
Step 2: Joining Activity to Cohort
This step links the cohort to the activity performed, e.g., a new order or a login. Here’s a generic example.
 SELECT u.user_id,
        DATE_TRUNC('month', u.signup_date) AS cohort_month,
        DATE_TRUNC('month', e.event_date) AS activity_month
FROM users u
JOIN events e
ON u.user_id = e.user_id;
The join allows tracking users forward in time. Without it, you can’t go beyond the starting month.
Step 3: Period Offset Calculation (and Hardcoding)
At this point, we have absolute calendar dates. We now need to convert them into relative cohort time (Month 0, Month 1, …).
This can be done dynamically or hard-coded.
The dynamic approach uses DATE_PART() with AGE(). The latter is a PostgreSQL function that returns the interval between two timestamps or dates.
DATE_PART('month', AGE(activity_month, cohort_month)) AS month_numberFor example, if you had these values in AGE()...
SELECT AGE('2024-03-15', '2024-01-10');…the code would return 2 mons 5 days.
Important note: Use AGE() only if you truncated in the previous step, as we did. Otherwise, it might break your code if the signup date is at the end of the month or the activity date falls on a shorter month. That’s because AGE() preserves real month lengths, leap years, and irregular days. That’s bad for cohort indexing, unless the dates are truncated.
If you want to avoid AGE() altogether, use this construct.
(
  DATE_PART('year', activity_month) - DATE_PART('year', cohort_month)
) * 12
+
(
  DATE_PART('month', activity_month) - DATE_PART('month', cohort_month)
) AS month_number
The hard-coding approach directly enforces the offset, as shown below.
activity_month = cohort_month + INTERVAL '1 month'How Do I Calculate Cohort Retention by Different Periods
The generic examples I’ve shown you above calculate monthly cohorts for illustration only.
Changing to a different-period cohort retention is very easy: you simply change the field argument in DATE_TRUNC() in all the steps:
- Cohort retention by month:
DATE_TRUNC('month', signup_date) AS cohort_month - Cohort retention by week:
DATE_TRUNC('week', signup_date) AS cohort_week - Cohort retention by day:
DATE_TRUNC('day', signup_date) AS cohort_day
You can find the complete list of the valid values for field in the PostgreSQL documentation.
Practical Example
To better understand cohort retention, we should compare cohorts of users over time. The reason why it gets tricky is that there are two time dimensions involved in cohort retention. First, the cohort itself, and second, the Day-N retention you are tracking for these cohorts.
Now let’s go back to our example. Suppose the language of the question evolved to include:
Calculate the first-day retention rate for each cohort of video game players, where the cohort is defined by the week in which the player started. Let’s think about how the query would evolve.
Solution Walkthrough
Two additional steps would need to be considered here:
- Grouping the users by the week in which they had their first login. A useful function that helps identify the start of a week is the
DATE_TRUNC()function in SQL. - After grouping the users by their start week, we follow the same pattern for writing the query that was written for Day-N retention
Now, let’s look at how the query would evolve:
The most important lines of this code to observe for cohort retention are:
- The application of
DATE_TRUNC('week', fl.min_login) AS cohort_weekto get the specific week in which the user started - The use of
COUNT(DISTINCT fl.player_id) AS cohort_sizesince the output will need to include the size of the cohort in each week as a variable denominator. Note that this was static when calculating Day-N retention since there was only 1 time dimension.
Here’s the output.
| cohort_week | cohort_size | day1_retained | day1_retention_rate |
|---|---|---|---|
| 2020-12-21 | 1 | 0 | 0 |
| 2021-12-13 | 1 | 1 | 1 |
| 2021-12-27 | 1 | 1 | 1 |
| 2022-01-03 | 1 | 0 | 0 |
| 2022-01-10 | 1 | 0 | 0 |
| 2022-01-24 | 1 | 1 | 1 |
Edge Case 1
An interesting edge case to explore in this context is what if there are missing cohorts. For example, if you were calculating weekly cohorts for players, but you noticed that you skipped a week because there were no players whose first login was in that specific week. This is a common edge-case assumption that I will clarify with the interviewer after writing the base outline shown above.
If the interviewer asks you for this edge case, you are likely already at a very advanced level and are thinking about production readiness. The way to address this edge case is to use the date splines we introduced for Day-N retention.
Here are the key steps involved.
Step 1: Generate a week spline using the minimum and maximum first-login dates.
We create a CTE with all weeks between the min and max first login date:
WITH week_spline AS (
    SELECT DATE_TRUNC('week', MIN(login_date)) + INTERVAL '1 week' * GENERATE_SERIES(0, EXTRACT(WEEK FROM MAX(login_date) - MIN(login_date))
        ) AS cohort_week
    FROM players_logins
),
Step 2: The intermediate steps for identifying the first login per user and calculating the users who returned on Day 1 follow the same logic. We’ll write the latter explicitly as CTEs; in the previous solution, it was embedded in the logic of the final SELECT.
first_login AS (
    SELECT player_id,
           MIN(login_date) AS min_login
    FROM players_logins
    GROUP BY player_id
),

day1_logins AS (
    SELECT fl.player_id,
           fl.min_login,
           pl.player_id AS day1_player
    FROM first_login fl
    LEFT JOIN players_logins pl
    ON fl.player_id = pl.player_id
    AND pl.login_date = fl.min_login + INTERVAL '1 day'
)
Step 3: Finally, in the aggregation step, the week spline is joined with day1_logins to calculate the cohort weeks. If no user started in the specific cohort_week, the cohort_size becomes 0. So, an edge case that gets created is if the cohort size is null, the estimated retention rate should also be null.
SELECT ws.cohort_week,
       COUNT(DISTINCT dl.player_id) AS cohort_size,
       COUNT(DISTINCT dl.day1_player) AS day1_retained,
       COUNT(DISTINCT dl.day1_player)::FLOAT / NULLIF(COUNT(DISTINCT dl.player_id), 0) AS day1_retention_rate
FROM week_spline ws
LEFT JOIN day1_logins dl
ON DATE_TRUNC('week', dl.min_login) = ws.cohort_week
GROUP BY ws.cohort_week
ORDER BY ws.cohort_week;
Here’s the full code.
Here’s the output.
| cohort_week | cohort_size | day1_retained | day1_retention_rate |
|---|---|---|---|
| 2020-12-21 | 1 | 0 | 0 |
| 2020-12-28 | 0 | 0 | |
| 2021-01-04 | 0 | 0 | |
| 2021-01-11 | 0 | 0 | |
| 2021-01-18 | 0 | 0 | |
| 2021-01-25 | 0 | 0 | |
| 2021-02-01 | 0 | 0 | |
| 2021-02-08 | 0 | 0 | |
| 2021-02-15 | 0 | 0 | |
| 2021-02-22 | 0 | 0 | |
| 2021-03-01 | 0 | 0 | |
| 2021-03-08 | 0 | 0 | |
| 2021-03-15 | 0 | 0 | |
| 2021-03-22 | 0 | 0 | |
| 2021-03-29 | 0 | 0 | |
| 2021-04-05 | 0 | 0 | |
| 2021-04-12 | 0 | 0 | |
| 2021-04-19 | 0 | 0 | |
| 2021-04-26 | 0 | 0 | |
| 2021-05-03 | 0 | 0 | |
| 2021-05-10 | 0 | 0 | |
| 2021-05-17 | 0 | 0 | |
| 2021-05-24 | 0 | 0 | |
| 2021-05-31 | 0 | 0 | |
| 2021-06-07 | 0 | 0 | |
| 2021-06-14 | 0 | 0 | |
| 2021-06-21 | 0 | 0 | |
| 2021-06-28 | 0 | 0 | |
| 2021-07-05 | 0 | 0 | |
| 2021-07-12 | 0 | 0 | |
| 2021-07-19 | 0 | 0 | |
| 2021-07-26 | 0 | 0 | |
| 2021-08-02 | 0 | 0 | |
| 2021-08-09 | 0 | 0 | |
| 2021-08-16 | 0 | 0 | |
| 2021-08-23 | 0 | 0 | |
| 2021-08-30 | 0 | 0 | |
| 2021-09-06 | 0 | 0 | |
| 2021-09-13 | 0 | 0 | |
| 2021-09-20 | 0 | 0 | |
| 2021-09-27 | 0 | 0 | |
| 2021-10-04 | 0 | 0 | |
| 2021-10-11 | 0 | 0 | |
| 2021-10-18 | 0 | 0 | |
| 2021-10-25 | 0 | 0 | |
| 2021-11-01 | 0 | 0 | |
| 2021-11-08 | 0 | 0 | |
| 2021-11-15 | 0 | 0 | |
| 2021-11-22 | 0 | 0 | |
| 2021-11-29 | 0 | 0 | |
| 2021-12-06 | 0 | 0 | |
| 2021-12-13 | 1 | 1 | 1 |
| 2021-12-20 | 0 | 0 | |
| 2021-12-27 | 1 | 1 | 1 |
| 2022-01-03 | 1 | 0 | 0 |
| 2022-01-10 | 1 | 0 | 0 |
| 2022-01-17 | 0 | 0 | |
| 2022-01-24 | 1 | 1 | 1 |
One way that you can reiterate your learning of these concepts is by generating a dataset and playing around with all the different ways to calculate retention.
Edge Case 2
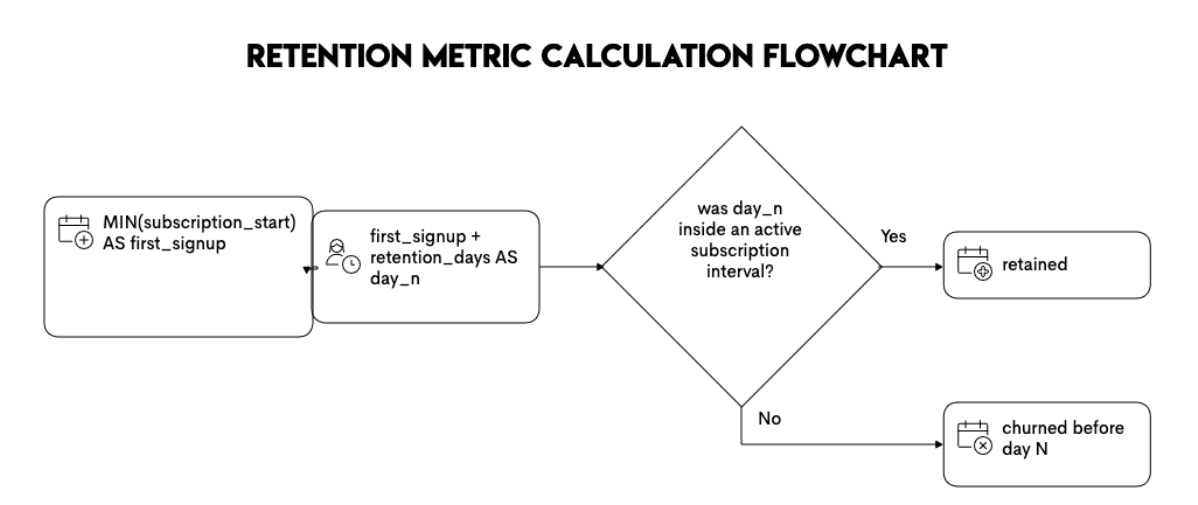
One edge case that comes up in subscription businesses is this concept of discontinuation and reactivation. In such a scenario, retention calculations become more complex than those shown here. This is because the user can churn (i.e., stop using the product) and then come back and resubscribe. Retention in this case means that users may have multiple start and stop windows.
This is an important advanced pattern to watch out for because retention then becomes an interval-containment problem. The questions/assumptions to clarify with the interviewer include the following:
- I will anchor on the first login or first signup of a user if there are multiple signups.
- I will compute the retention date and check whether the date falls within any active subscription windows
When users can cancel and reactivate, the key pattern can be demonstrated using the following flowchart.
For those practicing for interview queries, I highly recommend using open datasets - such as one in the Churn Prediction project - to try this approach and understand how to write these edge cases.
Rolling Retention
Another key concept in retention is to look at rolling retention metrics. It represents whether the user returned on or after Day-N, rather than retention at Day-N.
Usually, rolling retention is a more relaxed definition of retention that mimics user behavioral patterns. If a user doesn’t use a product daily, strictly checking retention on Day 7 would be less beneficial than checking if the user returned at Day 7 or later. Rolling retention is a reassurance that the user has churned.
Another aspect of rolling retention is that it is less sensitive to the effects of unexpected events, such as instrumentation bugs or holiday disruptions. This is helpful, especially in dashboards, since many types of audiences consume data from these dashboards, and unexpected fluctuations in a key metric can be concerning.
Rolling retention rate is also considered to be the inverse of churn metrics because it measures if the user is active, and churn measures if the user has stopped using the product.
Practical Example
Going back to the question that we have worked on throughout this article, let’s update the framing to a rolling retention approach: “Did the player log in at least once on or after 1 day after their first-ever login?”
Here’s how the query would update to solve for this framing.
Here’s the output.
| cohort_week | cohort_size | retained_rolling_d1 | rolling_d1_retention |
|---|---|---|---|
| 2020-12-21 | 1 | 1 | 1 |
| 2021-12-13 | 1 | 1 | 1 |
| 2021-12-27 | 1 | 1 | 1 |
| 2022-01-03 | 1 | 1 | 1 |
| 2022-01-10 | 1 | 0 | 0 |
| 2022-01-24 | 1 | 1 | 1 |
The only change to observe in this cohort retention query is the join condition that updates to account for rolling retention cohorts: login_date >= min_login + INTERVAL '1 day'. The greater than or equal to sign indicates “on or after day 1.”
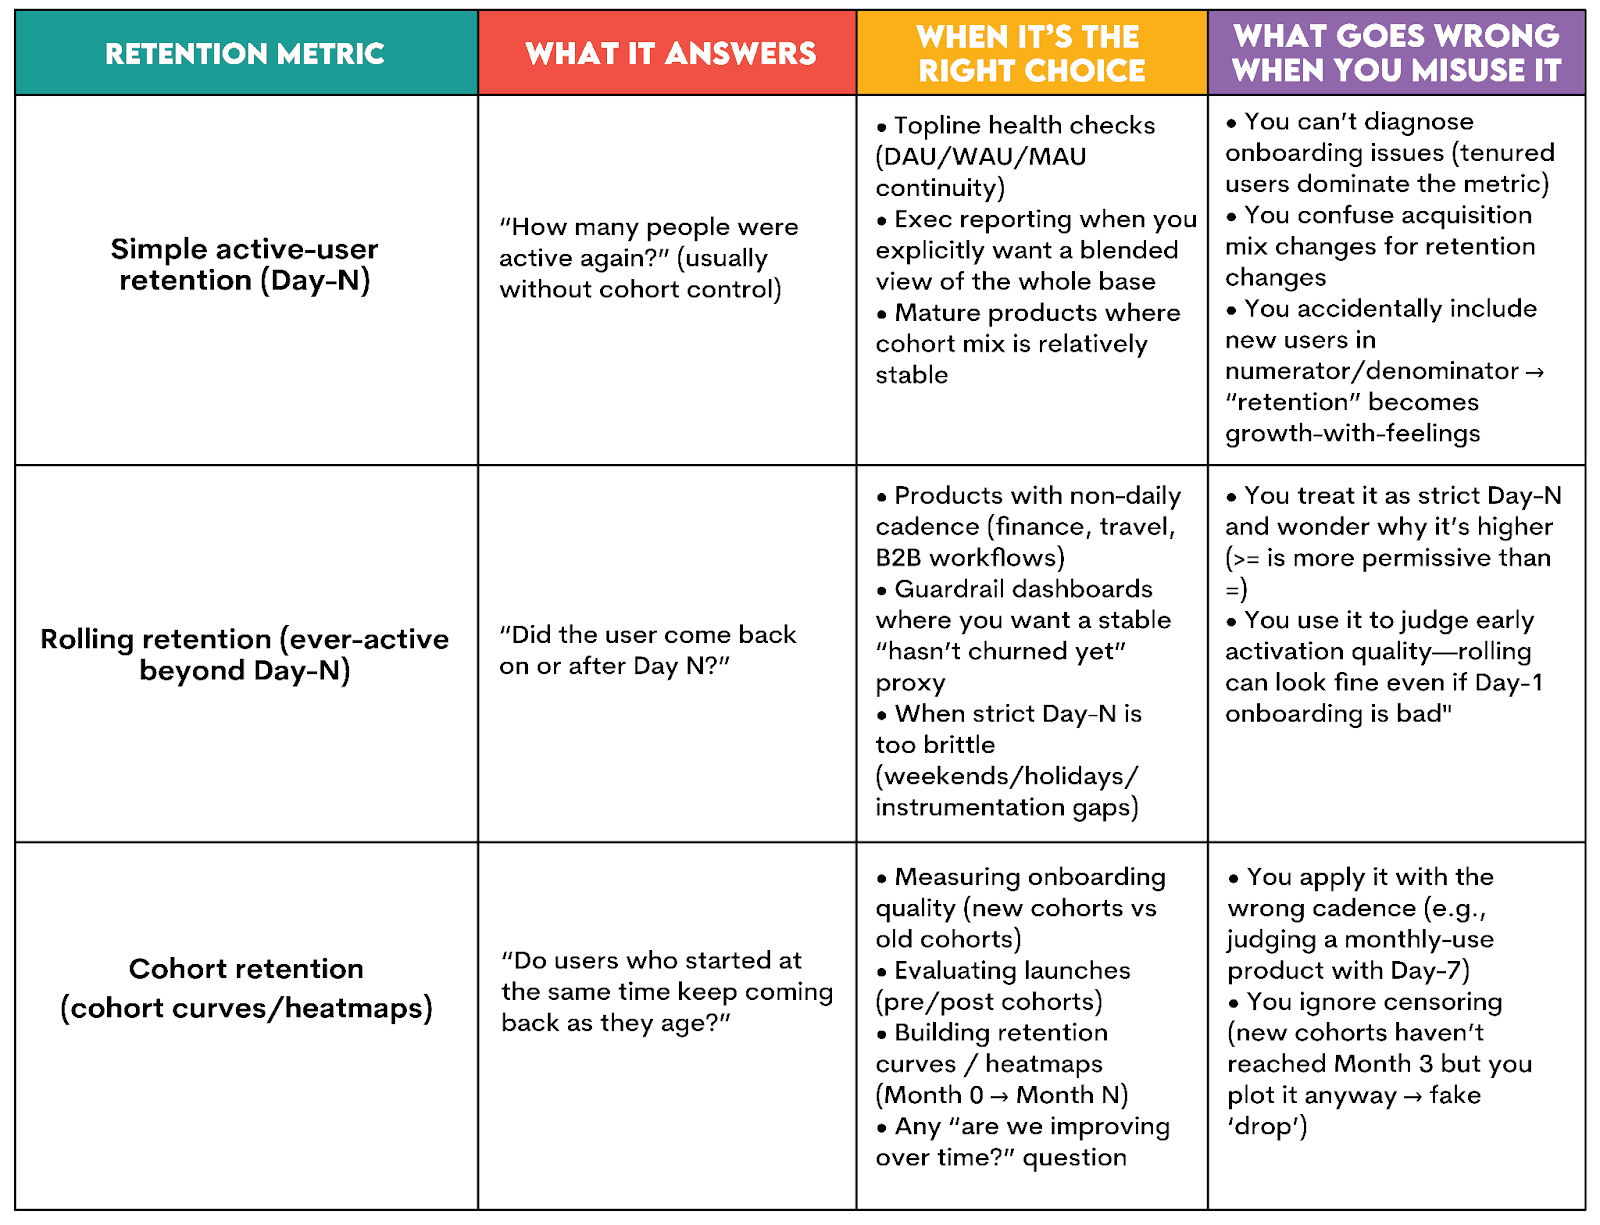
Trade-Offs: Which Retention Metric Should You Use?
Knowing how to calculate the retention metrics is one thing. Knowing when to use them is a completely different matter, but equally important in your interviews.
To make decisions easier, here’s a simple table that compares the three retention metrics.
Best Practices & Common Mistakes in Writing SQL Retention Queries
Now that you have a deep understanding of key themes on writing retention queries, a note about some common mistakes and how to avoid them.
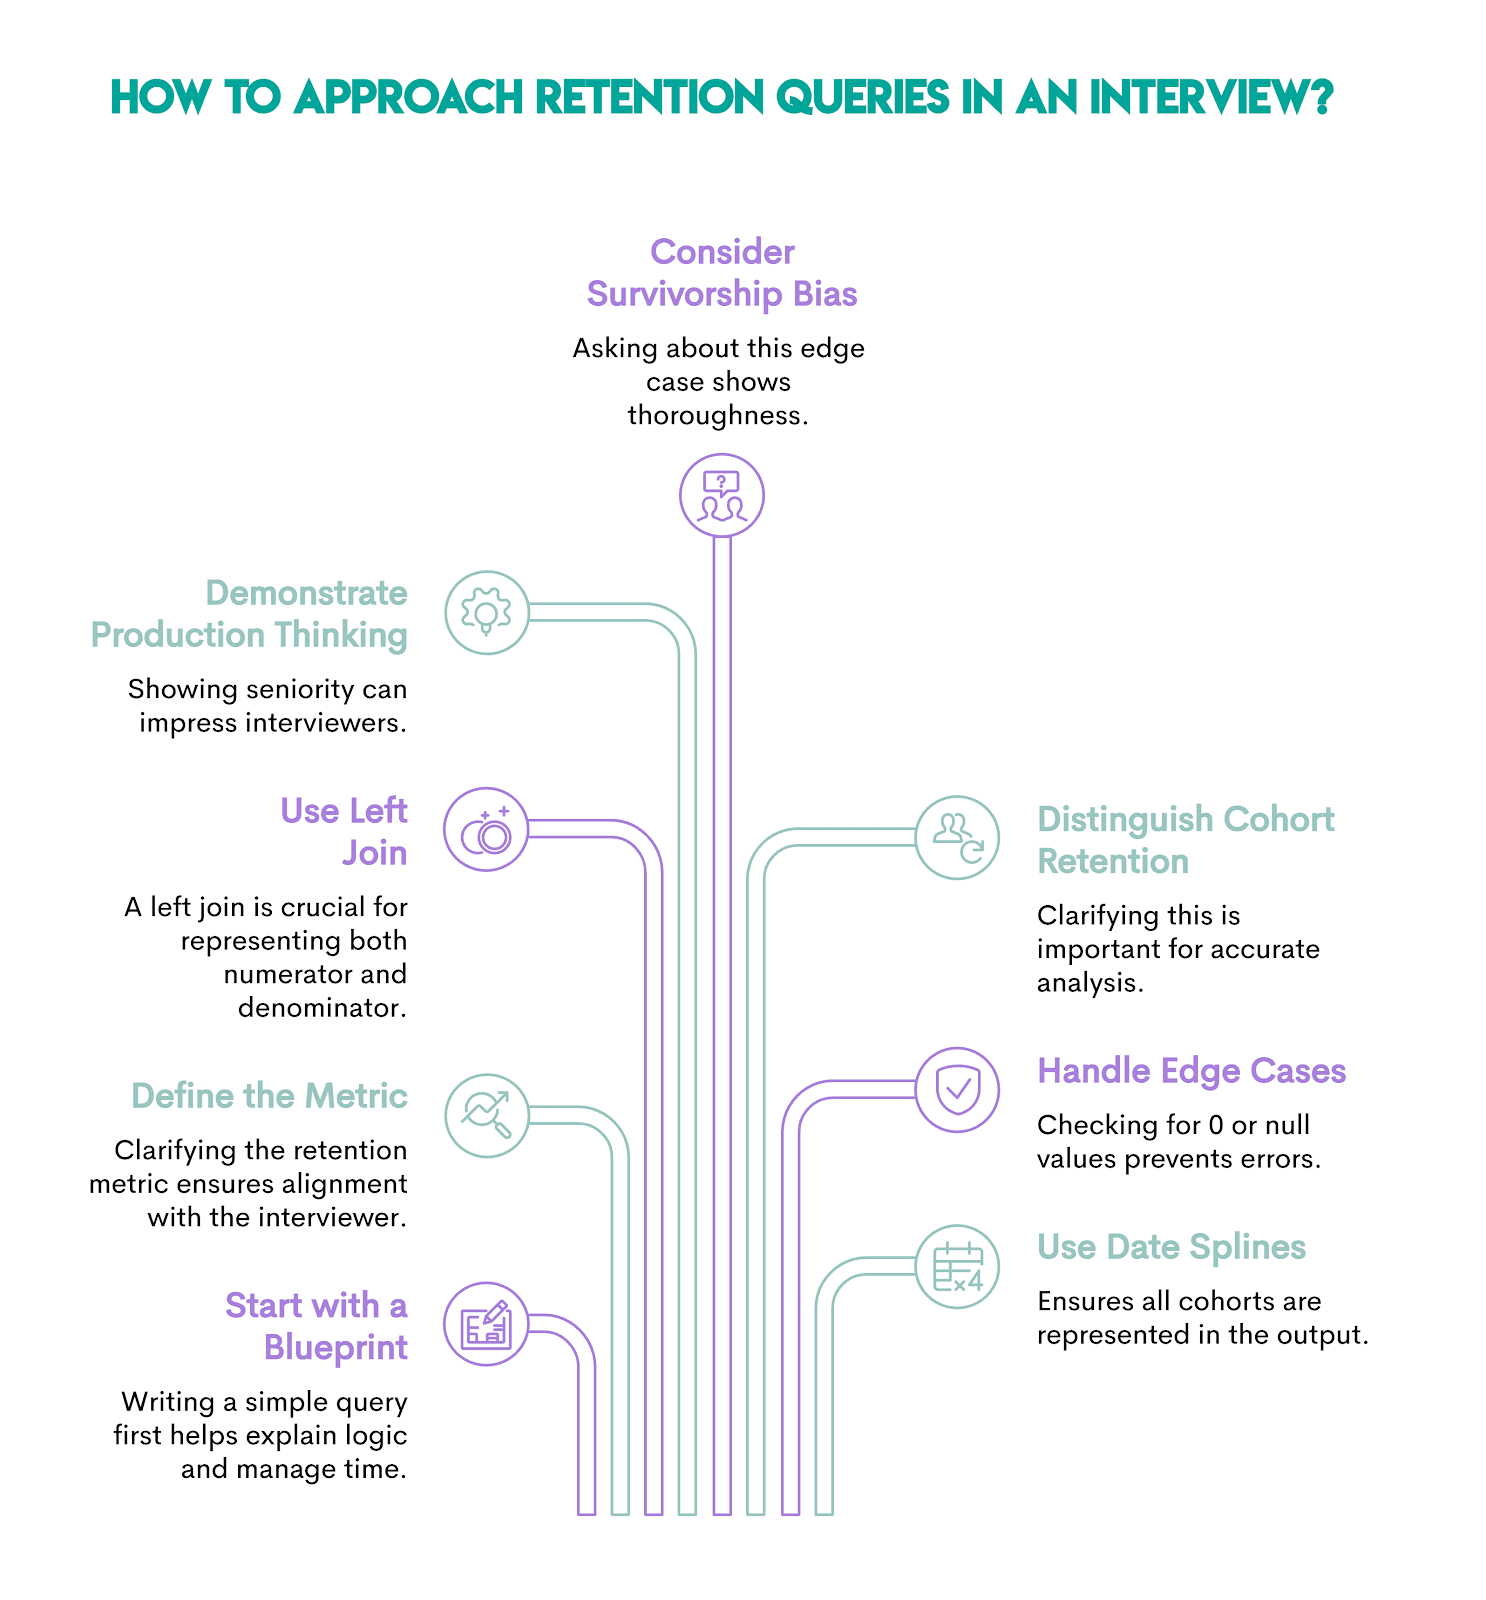
- Retention queries are long and time-consuming. Always start by writing the blueprint in an interview and explaining your logic. Writing a simple, less-than-perfect query to explain the full logic is better than running out of time to attempt a production-ready query.
- Retention can mean different metrics, and questions may be purposefully vague. The first step to a successful interview is defining the metric correctly and aligning your assumptions with the interviewer’s.
- Join-based approaches always require a left join so that the numerator and denominator are represented. An inner join will drop the denominator. Other approaches, such as CASE WHEN statements or window functions, are commonly used in retention queries. I found the proposed approach in this article to be clean and explainable.
- Retention metrics are often difficult to calculate because of the time-varying component in them. Demonstrating production thinking can help you level up in interviews and signal seniority.
- Survivorship bias is a common edge case to keep in mind and a good question to ask the interviewer.
- Cohort retention is distinct from active user retention, and it's critical to clarify upfront, given the nuances in how the question is framed. This is why this article rephrases the same question in different ways to highlight these nuances.
- Given that this metric has a numerator and a denominator, always check for edge cases like 0 or null handling.
- Date splines ensure that all intended cohorts are represented. Clarify with the interviewer if they want to generate a time series so that there aren’t any missing weeks or months in the output. This is generally an enhancement to the base query.
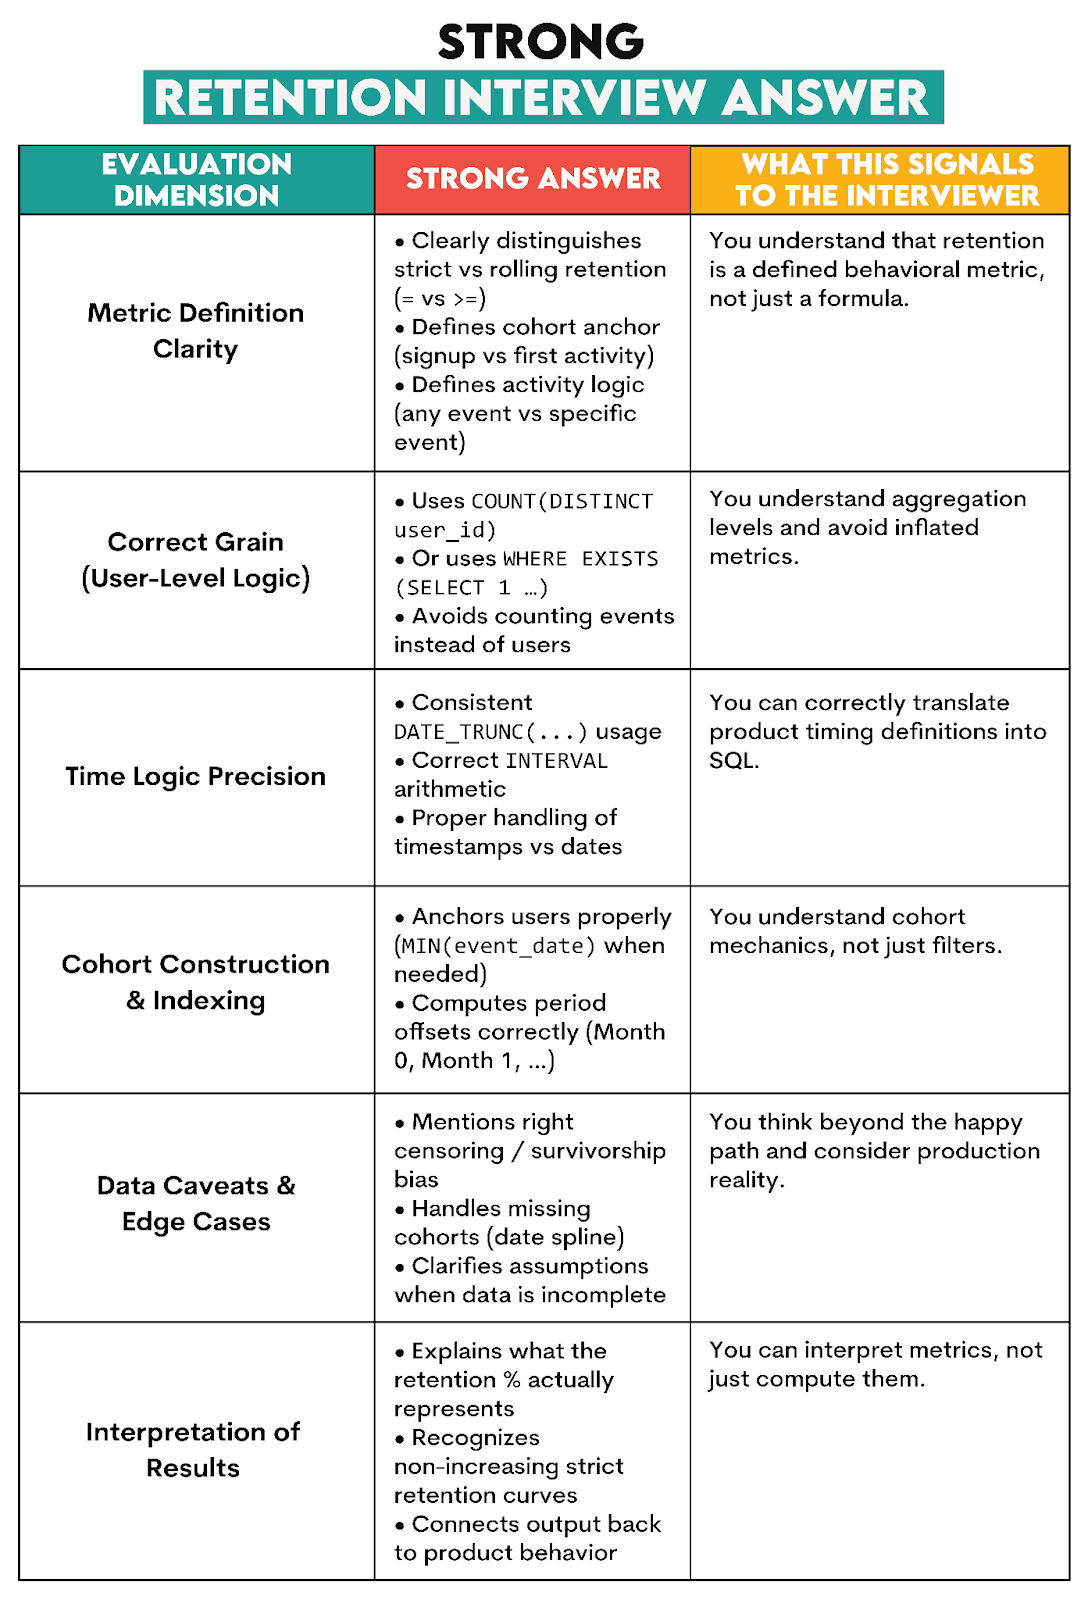
How Interviewers Evaluate Retention Answers
Interviewers want to see you define a metric, implement it correctly, and explain what it means. Those are the three main ingredients strong answers to interview questions should contain.
This is what this means in practice.
You’ll get partial credit if you write a mostly correct query, but:
- minor boundary issues (inclusive/exclusive)
- forgets censoring, but logic is otherwise fine
- uses COUNT(DISTINCT) everywhere, which is slow but correct-ish
And if you make the following mistakes, you’ll most certainly fail the interview.
- wrong denominator (new users included, cohort size drifting)
- counting events instead of users
- confusing cohort definition (active users vs signups)
- time logic mismatch (timestamps vs dates, wrong offset)
- producing a number but not being able to explain what it represents
Note on AI-Generated SQL Queries for Retention
While AI-assisted workflows are increasingly becoming omnipresent in the industry, in my experience, retention metrics require strong human judgment to ensure the right definition of retention and edge-case handling are appropriately addressed.
When using AI-assisted workflows, I recommend:
- Be specific in your prompts
- Ask for clear assumptions
- Prompt recursive thinking paths using statements such as ‘check your logic before sharing the query.’
- Write test cases or unit tests.
- Generate some buggy retention queries and diagnose why they are wrong! These approaches can be very helpful for developing the pattern-based thinking that interviewers test.
Practice Path
Knowing all the tricks we showed is a good starting point. However, that alone won’t get you over the interview finishing line. For that, you need practice, and lots of it.
Here’s a selection of relevant interview questions you can practice on.
Practice Question #1: Churn Rate Of Lyft Drivers
Churn Rate Of Lyft Drivers
Calculate the overall churn rate for Lyft drivers across all years in the dataset. Churn is defined as the percentage of drivers who have stopped driving for Lyft, as indicated by a recorded end_date in the lyft_drivers table. In your answer, express the churn rate as a ratio, instead of a percentage. For example, 0.1 instead of 10%.
Here’s the dataset.
Write your solution and check it in the widget below.
Practice Question #2: Monthly Churn Rate
Monthly Churn Rate
Last Updated: November 2021
Calculate the churn rate of September 2021 in percentages. The churn rate is the difference between the number of customers on the first day of the month and on the last day of the month, divided by the number of customers on the first day of a month. Assume that if customer's contract_end is NULL, their contract is still active. Additionally, if a customer started or finished their contract on a certain day, they should still be counted as a customer on that day.
Here’s the dataset.
Write your solution and check it in the widget below.
Practice Question #3: Retention Rate
Retention Rate
Last Updated: July 2021
You are given a dataset that tracks user activity. The dataset includes information about the date of user activity, the account_id associated with the activity, and the user_id of the user performing the activity. Each row in the dataset represents a user’s activity on a specific date for a particular account_id.
Your task is to calculate the monthly retention rate for users for each account_id for December 2020 and January 2021. The retention rate is defined as the percentage of users active in a given month who have activity in any future month.
For instance, a user is considered retained for December 2020 if they have activity in December 2020 and any subsequent month (e.g., January 2021 or later). Similarly, a user is retained for January 2021 if they have activity in January 2021 and any later month (e.g., February 2021 or later).
The final output should include the account_id and the ratio of the retention rate in January 2021 to the retention rate in December 2020 for each account_id. If there are no users retained in December 2020, the retention rate ratio should be set to 0.
Here’s the dataset.
Write your solution and check it in the widget below.
Practice Question #4: Consecutive Days
Consecutive Days
Last Updated: July 2021
Find all the users who were active for 3 consecutive days or more.
Here’s the dataset.
Write your solution and check it in the widget below.
Practice Question #5: Finding User Purchases
Finding User Purchases
Last Updated: December 2020
Identify returning active users by finding users who made a second purchase within 1 to 7 days after their first purchase. Ignore same-day purchases. Output a list of these user_ids.
Here’s the dataset.
Write your solution and check it in the widget below.
Practice Question #6: User Streaks
User Streaks
Last Updated: October 2022
Provided a table with user ID and the dates they visited the platform, find the top 3 users with the longest continuous streak of visiting the platform up to August 10, 2022. Output the user ID and the length of the streak.
In case of a tie, display all users with the top three longest streak lengths.
Here’s the dataset.
Write your solution and check it in the widget below.
Practice Question #7: User Activity Analysis
User Activity Analysis
Last Updated: November 2024
Identify users who have logged at least one activity within 30 days of their registration date.
Your output should include the user’s ID, registration date, and a count of the number of activities logged within that 30-day period.
Do not include users who did not perform any activity within this 30-day period.
Here’s the dataset.
Write your solution and check it in the widget below.
Practice Question #8: New And Existing Users
New And Existing Users
Last Updated: March 2021
Calculate the share of new and existing users for each month in the table. Output the month, share of new users, and share of existing users as a ratio.
New users are defined as users who started using services in the current month (there is no usage history in previous months). Existing users are users who used services in the current month, and who also used services in any prior month of 2020.
Assume that the dates are all from the year 2020 and that users are contained in user_id column.
Here’s the dataset.
Write your solution and check it in the widget below.
Practice Question #9: Premium Accounts
Premium Accounts
Last Updated: March 2022
You have a dataset that records daily active users for each premium account. A premium account appears in the data every day as long as it remains premium. However, some premium accounts may be temporarily discounted, meaning they are not actively paying — this is indicated by a final_price of 0.
For each date, count the number of premium accounts that were actively paying on that day. Then, track how many of those same accounts are still premium and actively paying exactly 7 days later, if that later date exists in the dataset. Return results for the first 7 dates in the dataset.
Output three columns: • The date of initial calculation. • The number of premium accounts that were actively paying on that day. • The number of those accounts that remain premium and are still paying after 7 days.
Here’s the dataset.
Write your solution and check it in the widget below.
Conclusion
Retention might look innocuous at first, but trying to implement it in SQL turns into a personal crisis. The reason is that retention isn’t a single metric.
This article taught you different retention metrics and how to calculate them in SQL. Now you know the blueprint: anchor users, join activity with time-based logic, compute rates using user-level aggregation.
With that, you have a solid foundation for providing a strong answer at your interview.
FAQs
1. What Is Retention?
In plain terms, retention is a measure of how many users continue using a product after a starting point, e.g., signup, first login, first purchase. It is usually expressed as a retention rate – the percentage of retained users from a defined base population.
2. What’s the Difference Between Retention and Churn?
Retention rate is the percentage of users who stay, and churn is the percentage of users who leave.
3. What’s the Difference Between Retention and Churn? What’s the Difference Between Retention and Churn?
In the strict Day-N retention, the user is active exactly on signup_date + N (uses = in SQL). In rolling retention, the user is active on or after signup_date + N (uses >= in SQL).
4. Why Do Retention Queries Usually Require a Left Join?
Because retention has a numerator (returned users) and a denominator (cohort size). An INNER JOIN tends to drop users who didn’t return. In other words, it deletes the denominator and ‘non-retained’ users along with it.
5. What Do Interviewers Actually Grade in Retention Questions?
They want you to do three things: define, implement, and interpret.
- Define the metric correctly (strict vs rolling, cohort anchor, activity definition)
- Implement it correctly in SQL (grain, joins, time logic, denominator)
- Interpret the result (what it means and what could bias it)
Share