40+ Data Science Interview Questions From Top Companies

Categories:
 Written by:
Nathan Rosidi
Overwhelming you with the data science interview questions is the only way to make sure your data science interview doesn’t end underwhelmingly.
We can’t give you all the questions and answers you need for a data science job interview. You know that already. But we can provide you with the amount that gets close to getting everything you need.
Covering as many data science interview question types as possible makes the territory where the interview question can surprise you increasingly smaller. We’re doing this job for you in this article. But the rest of the work is on you.
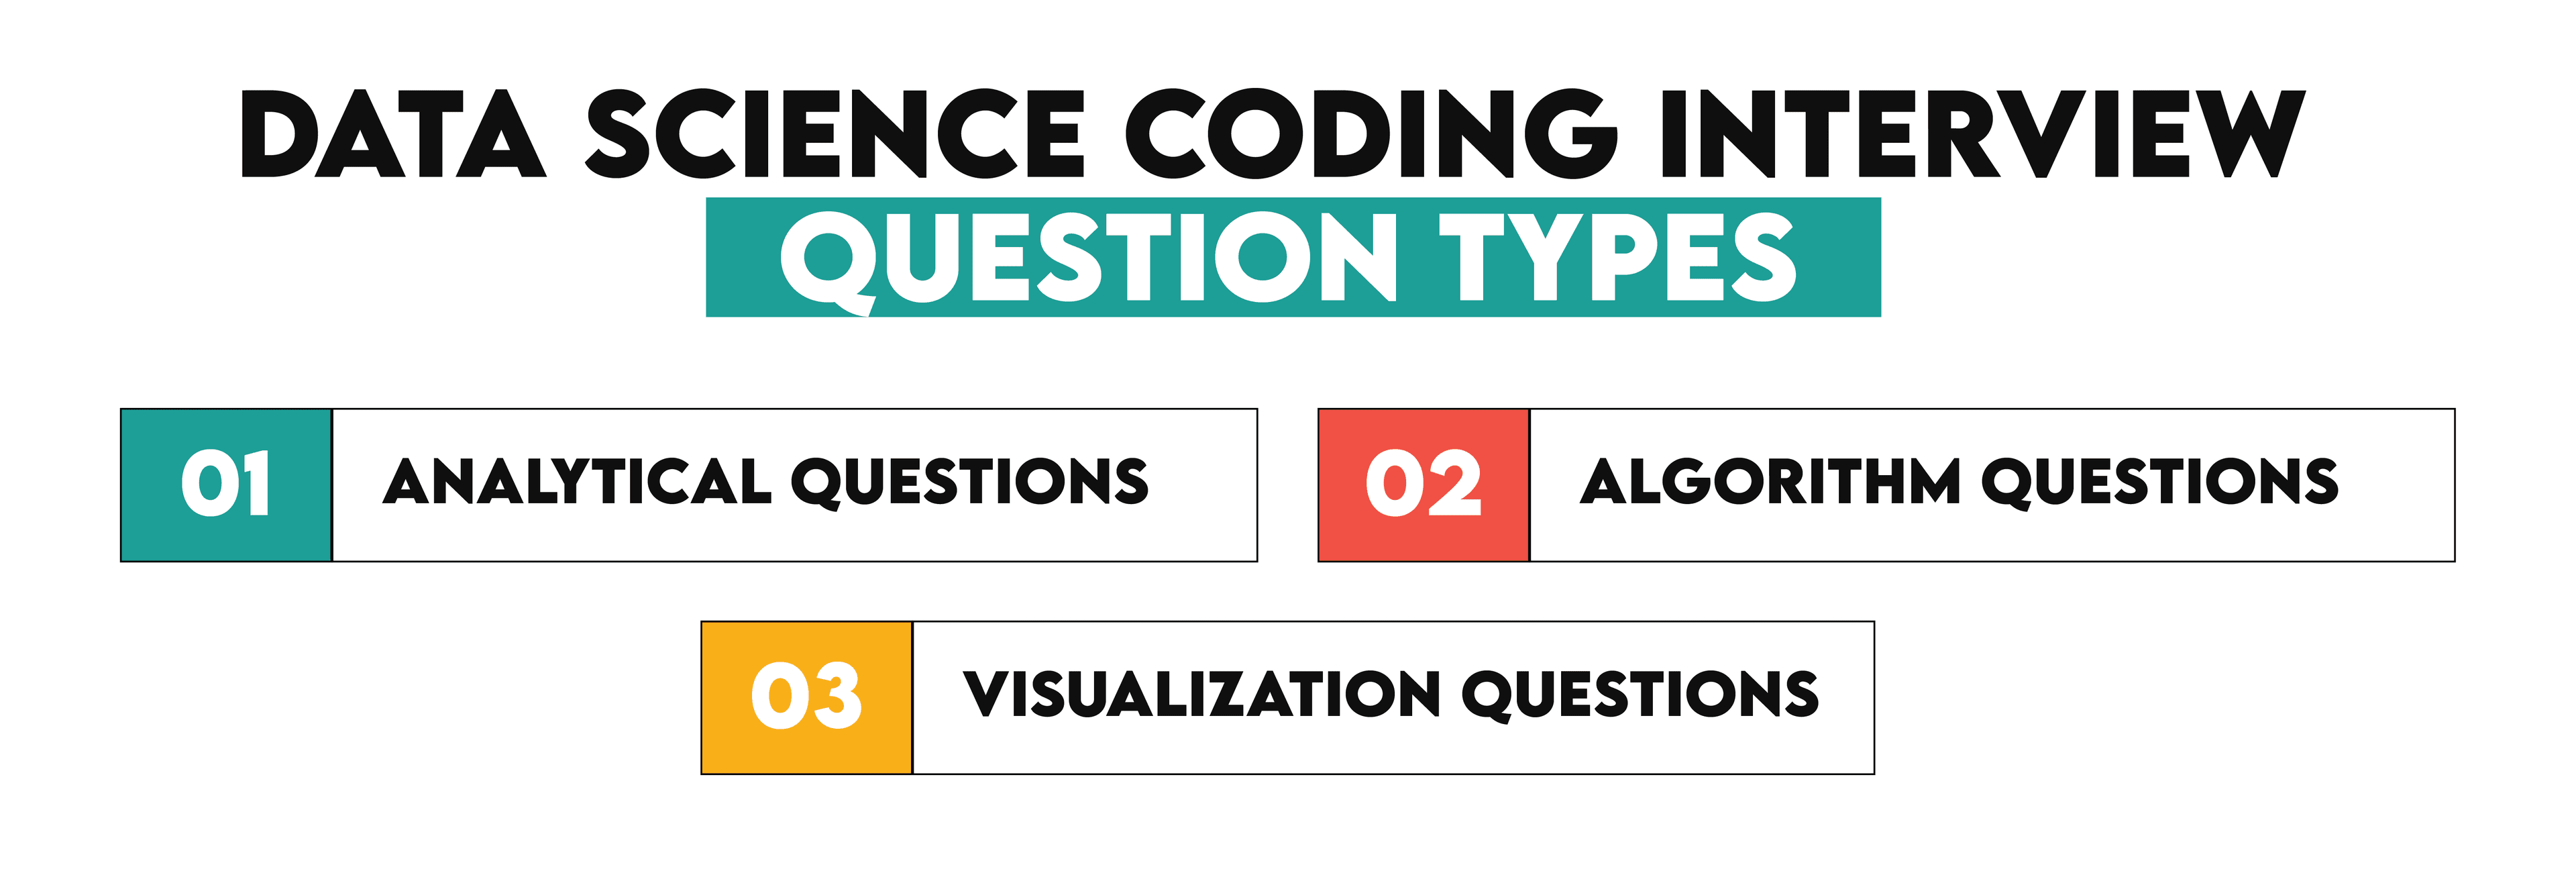
All the questions we have gathered on StrataScratch show that the data science interview questions can be categorized into three main categories.

Data Science Coding Interview Questions (SQL, Python, R)
These include all the questions where the coding skills are tested. We divide them into three distinct categories.
It doesn’t matter which language is tested. It could be SQL, Python, R, or any other programming language required for the data science position you want.
Coding is one of the most important skills for data scientists. It is no surprise that this is the most numerous category of data science interview questions.
Data Science Analytical Questions
These questions test your ability to query, manipulate, and analyze data. We’ll show you 14 questions and solutions in:
- SQL
- Python - pandas
- R
- Python - Polars
- PySpark
So, what questions could you expect if you apply for a job at one of the top companies?
Interview Question #1: Find whether the number of seniors works at Meta/Facebook is higher than its number of USA based employees
This question asks you to find out if there are more senior workers than the US-based ones at Meta.
Find whether the number of seniors works at Meta/Facebook is higher than its number of USA based employees
Last Updated: April 2020
Find whether the number of senior workers (i.e., more experienced) at Meta/Facebook is higher than number of USA-based employees at Facebook/Meta. If the number of senior workers is higher then output as 'More seniors'. Otherwise, output as 'More USA-based'.
Link to the question: https://platform.stratascratch.com/coding/10065-find-whether-the-number-of-seniors-works-at-facebook-is-higher-than-its-number-of-usa-based-employees
Dataset: The facebook_employees table is provided.
Answer:
The solution first uses the SELECT and CASE statements to allocate values to certain data, based on whether there are more seniors or USA-based employees.
Then there’s a subquery in the FROM clause to get the data from the table. There’s also an aggregate function SUM() and, again, a CASE statement. This part of the code queries the table facebook_employees to sum the number of senior employees. It does that by allocating the value ‘1’ to every senior employee and then adding all the values.
The subquery is then LEFT JOINed with another one. The second subquery uses the COUNT() aggregate function to find the number of employees based in the USA.
SELECT
    CASE
        WHEN n_seniors > n_usa_based
        THEN 'More seniors'
        ELSE 'More USA-based'
    END AS winner
FROM
    (SELECT
        SUM(CASE WHEN is_senior THEN 1 ELSE 0 END) AS n_seniors
    FROM
        facebook_employees) seniors
LEFT JOIN
    (SELECT
        COUNT(*) AS n_usa_based
    FROM
        facebook_employees
    WHERE
        location = 'USA'
    ) us_based
ON TRUE
Run the code in the widget to see the output.
Interview Question#2: Unique Salaries
In this question by Twitter, you’re required to find the top three distinct salaries for each department.
Distinct Salaries
Last Updated: April 2019
Find the top three distinct salaries for each department. Output the department name and the top 3 distinct salaries by each department. Order your results alphabetically by department and then by highest salary to lowest.
Link to the question: https://platform.stratascratch.com/coding/9898-unique-salaries
Dataset: The question gives you the twitter_employee table.
Answer: The code below employs a subquery within a subquery. That second subquery finds unique salaries for each department.
Then, the first subquery takes that result, ranks salaries within each department using the RANK() window function. The output is sorted alphabetically by department and from the highest to the lowest salaries.
Finally, the outer query filters out all ranks except the top three.
Run the code in the widget to see the output.
Interview Question #3: MacBook Pro User Event Count
Here’s one question from Apple. It asks you to count the number of user events performed by MacBook Pro users.
MacBookPro User Event Count
Count the number of user events performed by MacBookPro users. Output the result along with the event name. Sort the result based on the event count in the descending order.
Link to the question: https://platform.stratascratch.com/coding/9653-count-the-number-of-user-events-performed-by-macbookpro-users
Dataset: We’ll work with the playbook_events table.
Answer: The code here uses COUNT() and GROUP BY to find the number of events per event type.
It utilizes WHERE to keep only the events performed by MacBook Pro users and, finally, sorts the output descendingly by the event count.
Run the code in the widget to see the output.
Interview Question #4: Number of Speakers By Language
This question from Apple and Google interviews wants you to find the number of speakers of each language by country.
Number of Speakers By Language
Find the number of speakers of each language by country. Output the country, language, and the corresponding number of speakers. Output the result based on the country in ascending order.
Link to the question: https://platform.stratascratch.com/coding/10139-number-of-speakers-by-language
Dataset: You’re given two tables; the first one is playbook_events
The second table is playbook_users.
Answer: The code uses COUNT() to find the number of distinct speakers per location (i.e., country) and language.
To achieve this, we must retrieve data from both tables, which we do with an INNER JOIN because we want only users who attended the event.
Interview Question #5: Find the top 5 cities with the most 5-star businesses
The question by Yelp requires you to find five cities with the most 5-star businesses.
Find the top 5 cities with the most 5 star businesses
Find all cities ranked in the top 5 by number of 5-star businesses, using standard competition ranking where ties receive the same rank and the following rank is skipped.
The output should include the city name and the total count of 5-star businesses in that city, considering both open and closed businesses.
Link to the question: https://platform.stratascratch.com/coding/10148-find-the-top-10-cities-with-the-most-5-star-businesses
Dataset: Here we have the yelp_business table.
Answer: The solution uses Boolean filtering to find the businesses with a 5-star rating.
It then groups data by city and counts the number of 5-star businesses.
We then rank cities based on count in descending order and use the `'min'` method to handle ties.
Next, we filter the result to include only the top 5 ranked cities and sort the output in descending order.
- The dataset has already been loaded as a pandas.DataFrame.
- print() functions and the last line of code will be displayed in the output.
- In order for your solution to be accepted, your solution should be located on the last line of the editor and match the expected output data type listed in the question.
Run the code in the widget to see the output.
Interview Question #6: Find the day of the week that most people check in
This is a question from Airbnb where you need to determine the day of the week when the most people check in.
Find the day of the week that most people check in
Find the day of the week that most people want to check in. Output the day of the week alongside the corresponding check-in count.
Link to the question: https://platform.stratascratch.com/coding/9762-find-the-day-of-the-week-that-most-people-check-in
Dataset: We’ll work with the airbnb_contacts DataFrame.
Answer: The code slices the dataset using the loc() method, which is used to select a range of columns by label.
It then converts all selected columns to a datetime format using the apply() method and extracts the weekday from the ds_checkin column.
It then employs the NumPy size() method to count the number of rows per day of the week and filters the output, so it only includes the days with the most check-ins.
- The dataset has already been loaded as a pandas.DataFrame.
- print() functions and the last line of code will be displayed in the output.
- In order for your solution to be accepted, your solution should be located on the last line of the editor and match the expected output data type listed in the question.
Interview Question #7: Highest Cost Orders
This question from Shopify and Amazon asks you to identify the customers with the highest daily total order cost between February 1, 2019, and May 1, 2019.
Highest Cost Orders
Last Updated: May 2019
Find the customers with the highest daily total order cost between 2019-02-01 and 2019-05-01. If a customer had more than one order on a certain day, sum the order costs on a daily basis. Output each customer's first name, total cost of their items, and the date. If multiple customers tie for the highest daily total on the same date, return all of them.
For simplicity, you can assume that every first name in the dataset is unique.
Link to the question: https://platform.stratascratch.com/coding/9915-highest-cost-orders
Dataset: The first DataFrame provided by the question is customers.
The second DataFrame is orders.
Answer: The code uses the merge() method to join the two DataFrames and
The code uses to_datetime() to parse order_date into a datetime format for comparison and filtering.
Filtering of the dates according to the question criteria is done by the between() method.
We then employ the groupby() and sum() methods to compute the total cost per customer per date.
The transform("max") part broadcasts the daily max total_order_cost to the same shape as the grouped data method to keep only rows where max_cost is equal to the maximum.
Next, we use the merge() method to join the top_daily and customers DataFrames.
Finally, we use dt.strftime() to format datetime into a string in YYYY-MM-DD format, select specific columns, and rename them for the final output.
- The dataset has already been loaded as a pandas.DataFrame.
- print() functions and the last line of code will be displayed in the output.
- In order for your solution to be accepted, your solution should be located on the last line of the editor and match the expected output data type listed in the question.
Interview Question #8: New Products
To solve this interview question by Tesla and Salesforce, you need to calculate the net change in the number of products launched by companies in 2020 compared to 2019.
New Products
Last Updated: December 2020
Calculate the net change in the number of products launched by companies in 2020 compared to 2019. Your output should include the company names and the net difference. (Net difference = Number of products launched in 2020 - The number launched in 2019.)
Link to the question: https://platform.stratascratch.com/coding/10318-new-products
Dataset: There’s a DataFrame named car_launches.
Answer: The code creates two DataFrames, one for 2020 and the other for 2019 car launches, casts the year column to a string using astype(), and filters the rows where the year is 2020 or 2019, respectively.
Next, we use merge() to full outer join these two DataFrames on the company_name column and rename the overlapping columns to indicate their source year by adding _2020 and _2019 suffixes. We also replace NaN values with 0 using the fillna() method.
The data is then grouped and aggregated to count the number of unique products per company per year.
Finally, we subtract 2019 values from 2020 values to get the net_new_products column and show it in the output, along with the company name.
- The dataset has already been loaded as a pandas.DataFrame.
- print() functions and the last line of code will be displayed in the output.
- In order for your solution to be accepted, your solution should be located on the last line of the editor and match the expected output data type listed in the question.
Interview Question #9: Consecutive Days
The interview question from Netflix and Salesforce asks you to find all the users who were active for 3 consecutive days or more.
Consecutive Days
Last Updated: July 2021
Find all the users who were active for 3 consecutive days or more.
Link to the question: https://platform.stratascratch.com/coding/2054-consecutive-days
Dataset: There’s only one table, and it’s called sf_events.
Answer: We use the dplyr package for data manipulation using the tidyverse grammar.
We use the pipe operator (%>%) to pass the result of one function as the input to the next, enabling readable chaining, and then we remove duplicate rows from the table using distinct().
Next, we use ymd() from the lubridate package to parse date strings into proper Date objects using year-month-day format.
Then we use mutate() to add record_date, rank, and consecutive_days. We need to prepare data for group-wise operations, so we use arrange() to sort the data by user_id and record_date.
We can now group rows by user_id using group_by() to apply the row_number() function and later summarize grouped results. The as.difftime() function creates a time difference object to shift record_date and reveal consecutive-day patterns. Subtracting (rank - 1) days from the event date normalizes consecutive streaks.
Next, we use summarize() to aggregate the grouped data to count how many events share the same consecutive_days anchor.
Then, we filter only the sequences where a user has 3+ events in a consecutive-day block using filter(). Finally, we output only the user IDs that met the condition.
Interview Question #10: Salaries Differences
The interview question by LinkedIn and Dropbox asks you to calculate the difference between the highest salaries in the marketing and engineering departments.
Salaries Differences
Last Updated: November 2020
Calculates the difference between the highest salaries in the marketing and engineering departments. Output just the absolute difference in salaries.
Link to the question: https://platform.stratascratch.com/coding/10308-salaries-differences
Dataset: There are two tables. The first one is db_employee.
The second table is db_dept.
Answer: In this code, we merge two data frames using a left join based on the mapping department_id = id. We again use the pipe operator to chain operations from left to right.
Next, we use filter() to isolate employees in either the engineering or marketing department. For both departments, we use group_by() and max() to group rows by department and find the highest salary, and reduce each group to a single row using summarize().
We use $ to extract the maximum salary from both engineering and marketing data frames and calculate the absolute difference between them using abs().
Interview Question #11: New And Existing Users
This question is popular at IBM, Apple, and Microsoft interviews. It requires you to calculate the share of new and existing users for each month. New users are defined as those who started using services in the current month. Existing users are those who used services in the current month and who also used services in any prior month of 2020.
New And Existing Users
Last Updated: March 2021
Calculate the share of new and existing users for each month in the table. Output the month, share of new users, and share of existing users as a ratio.
New users are defined as users who started using services in the current month (there is no usage history in previous months). Existing users are users who used services in the current month, and who also used services in any prior month of 2020.
Assume that the dates are all from the year 2020 and that users are contained in user_id column.
Link to the question: https://platform.stratascratch.com/coding/2028-new-and-existing-users
Dataset: The dataset consists of only one table, namely fact_events.
Answer: In the code below, we use col() to select the user_id column for transformation, aggregation, or computation. We extract the month component from the column using dt.month() and rename the column to month with alias(). The with_columns() function adds a new column to a table. The table is already a LazyFrame, so this transformation is recorded in the query plan and executed only when collect() is called.
We then perform a group transformation using group_by().agg() to find total users per month, with n.unique() counting unique monthly users.
The min() function finds the first (earliest) month per user, which we need to determine the first usage month.
Then we use count() to count the number of new users.
Next, we need to join the total users with the new users; we do that using join() and applying the left join, which retains all months from the total users frame.
Now, we calculate the share. We calculate the share of new users by dividing the number of new users by the total number of users. Then, we get the share of old users by subtracting the share of new users from 1.
Finally, we select the required columns and show the output.
Run the code in the widget to see the output.
Interview Question #12: Election Results
A question from a Deloitte and Google interview asks you to determine who won the most votes in the election. Each voter can vote for one or more candidates (in which case the votes are split, i.e., one person voting for two candidates gives each candidate a 0.5 vote) or not vote at all (in which case, there’s a blank entry in the dataset).
Election Results
Last Updated: March 2022
The election is conducted in a city and everyone can vote for one or more candidates, or choose not to vote at all. Each person has 1 vote so if they vote for multiple candidates, their vote gets equally split across these candidates. For example, if a person votes for 2 candidates, these candidates receive an equivalent of 0.5 vote each. Some voters have chosen not to vote, which explains the blank entries in the dataset.
Find out who got the most votes and won the election. Output the name of the candidate or multiple names in case of a tie. To avoid issues with a floating-point error you can round the number of votes received by a candidate to 3 decimal places.
Link to the question: https://platform.stratascratch.com/coding/2099-election-results
Dataset: The dataset consists of only one table named voting_results
Answer: We convert an eager DataFrame to a LazyFrame, enabling deferred execution and query optimisation.
We use col() to refer to the candidate column, then filter() and is_not_null() to filter out rows where candidate is NaN, keeping only voters who actually voted.
We move on to calculating the number of candidates each voter voted for. Here, we use group_by().agg() to group the data and perform aggregation, then count() to count how many candidates each voter selected.
Next, there is join() that performs a left join between the cleaned vote data and per-voter candidate counts. We also use with_columns() to compute vote_value per row (1 divided by the number of candidates the voter selected).
In the next step, we use sum() to sum fractional votes for each candidate to compute the total weighted vote. We then round total votes to 3 decimal places (as per the question requirement) using round().
We then extract the maximum vote count using max(), with item() extracting the scalar value from the result. This is so that the comparison in the next step, where we’ll compare the maximum vote count with the values in the total_votes columns, and then output the name of the candidate with the most votes.
Interview Question #13: Responsible for Most Customers
Here’s a question from Asana, Workday, and Amazon. The requirement is to write a query that will output the employees who are responsible for the highest number of customers. Each employee is assigned one territory and is responsible for the customers in that territory, and there can be many employees assigned to one territory.
Responsible for Most Customers
Last Updated: May 2022
Each Employee is assigned one territory and is responsible for the Customers from this territory. There may be multiple employees assigned to the same territory. Write a query to get the Employees who are responsible for the maximum number of Customers. Output the Employee ID and the number of Customers.
Link to the question: https://platform.stratascratch.com/coding/2108-responsible-for-most-customers
Dataset: The question provides us with two tables. The first table is map_employee_territory
The second table is called map_customer_territory.
Answer: In the solution, we first import Spark SQL functions like count(), col(), rank(), desc(), etc., with an alias for cleaner syntax. We also import the Window specification object used for defining how to apply ranking over rows.
We then inner join two DataFrames on the territory_id column using the join() function.
The data is aggregated after grouping with groupBy().agg(), and then all rows per employee are counted using the count() function. The resulting column is named n_customers using the alias() function.
The select() function selects only relevant columns, namely empl_id and n_customers.
By using withColumn(), we add a new column ranking, which contains the ranking of each employee by the number of customers. We rank employees by using F.rank().over(Window.orderBy(F.desc('n_customers'))), which is a ranking window function. Ranking is performed from the highest to the lowest number of customers, i.e., in descending order.
Finally, we use filter() to keep only the top-ranked employees, drop() to remove the ranking column, and toPandas() to convert the final Spark DataFrame to a Pandas DataFrame.
import pyspark.sql.functions as F
from pyspark.sql.window import Window

employees_customers = map_employee_territory.join(map_customer_territory, on='territory_id')
customers_per_employee = employees_customers.groupby('empl_id').agg(F.count('*').alias('n_customers')).select('empl_id', 'n_customers')
customers_per_employee = customers_per_employee.withColumn('ranking', F.rank().over(Window.orderBy(F.desc('n_customers'))))
result = customers_per_employee.filter(F.col('ranking') == 1).drop('ranking')
result.toPandas()
Interview Question #14: Salary Less Than Twice the Average
This question by Tata Consultancy asks you to list all managers whose salary is less than twice the average salary of employees reporting to them.
Salary Less Than Twice The Average
Last Updated: May 2022
Write a query to get the list of managers whose salary is less than twice the average salary of employees reporting to them. For these managers, output their ID, salary and the average salary of employees reporting to them.
Link to the question: https://platform.stratascratch.com/coding/2110-salary-less-than-twice-the-average
Dataset: The dataset consists of two tables, the first one being map_employee_hierarchy.
The second table is dim_employee.
Answer: To solve this question, we’ll again use PySpark’s built-in SQL functions.
We use join() to join the two DataFrames on the empl_id columns; first to link employees with their hierarchy, then to link back to manager salaries.
We then group the data by manager_empl_id and compute the average salary of that manager’s direct reports.
We use the avg() aggregate function to calculate the average salary per manager.
The selectExpr() variant of select() allows selection and renaming using SQL expressions. In our code, it selects manager_empl_id (also renames it to manager), employees_avg_salary, and salary columns. It does all that inline, which makes the code shorter and more readable than using col() several times and alias().
We then use where() to filter rows based on the condition that the manager’s salary is less than the average salary of the employees reporting to the particular manager.
FInally, we rename the final PySpark DataFrame into a pandas DataFrame.
# Import your libraries
import pyspark.sql.functions as F

# Start writing code
df=map_employee_hierarchy\
    .join(dim_employee, dim_employee.empl_id==map_employee_hierarchy.empl_id)\
    .groupBy('manager_empl_id')\
    .agg(F.avg('salary').alias('employees_avg_salary'))\
    .join(dim_employee, F.col('manager_empl_id')==F.col('empl_id'))\
    .selectExpr('manager_empl_id as manager', 'employees_avg_salary', 'salary')\
    .where('(salary)<employees_avg_salary*2')

df.toPandas()
Data Science Algorithm Questions

The algorithm interview questions are technical coding questions that test your ability to write efficient algorithms using logic, data structures, and coding knowledge.
We’ll show you two algorithm question examples from top companies.
Interview Question #15: Minimum Coins for Total Amount
Here’s an interview question by EY. It asks you to write an algorithm that will calculate the minimum number of coins you must select to make up the given amount using the list of coin denominations. The assumption is that there’s an unlimited number of coins from each denomination.
Minimum Coins for Total Amount
Given an amount of money and a list of coin denominations, what is the minimum number of coins you must select to make up that amount, assuming an unlimited number of coins from each denomination?
Link to the question: https://platform.stratascratch.com/algorithms/10420-minimum-coins-for-total-amount
Answer: The code below first unpacks the input dictionary.
It then initializes a list dp of size amount + 1 with inf, meaning unreachable.
The code then iterates and tries every coin for each amount i from 1 to amount. If the coin is small enough, it updates dp[i] by choosing the minimum between the current value of dp[i] and the value dp[i - coin] + 1.
The final piece of logic is saying that, if dp[amount] is still inf, the amount is unreachable with the given coins. Otherwise, it returns the computed minimum.
Run the code in the widget to see the output.
Interview Question #16: Deleting Elements From a Linked List
This interview question by Goldman Sachs wants you to write a function linked_list_operations(elements) that deletes the first and second elements from a linked list created from the input list elements.
Deleting Elements from Linked List
Write a function linked_list_operations(elements) that:
• Creates a linked list from the input list elements
• Deletes the first and second elements from the linked list
• Returns the remaining elements as a list
Link to the question: https://platform.stratascratch.com/algorithms/10391-deleting-elements-from-linked-list
Answer: We define a Node and LinkedList class, where each node stores the value (data) and a pointer to the next node (next).
Next, we use __init__() to initialize the list with self.head = None.
We then use append() to add a new node to the end of the linked list. If the list is empty, the new node becomes the head. Otherwise, it traverses to the end and attaches the new node.
The following step is to delete the first two elements from the list with delete_first_and_second_elements(). If the list is empty, it does nothing. If there’s only one element, it sets head to None. If there are two or more elements, it sets head to the third node head = head.next.next
Data Science Visualization Questions

These types of interview questions test your ability to create eye-pleasing and informative data visualizations in Python.
You’ll typically encounter questions asking you to do that in Matplotlib or seaborn, the two most popular python data visualization libraries.
Interview Question #17: Customer Wait Times
In this question, you need to create a histogram that examines the distribution of customer wait times at different service centers. It also specifies the colors you have to use: sienna for below average times and royalblue for above average times.
Customer wait times
Utilize a histogram to examine the distribution of customer wait times at different service centers, with 'sienna' for below average times and 'royalblue' for above average times.
Link to the question: https://platform.stratascratch.com/visualizations/10443-customer-wait-times
Dataset: We are given this DataFrame.
Answer: We first calculate the average waiting times using the mean() function.
We use figure () to create a figure with the width and height specified in the question requirements.
The hist() function plots histograms to show the distribution of wait times; once for values below the mean, once for values above. The bins argument in hist() specifies the number of histogram bars (intervals). We also control the visual style with color (bar color), alpha (transparency), and label (legend label).
The axvline() function draws a vertical line at the mean wait time to visually separate the two parts of the distribution.
We then add titles and labels using title(), xlabel(), and ylabel().
Finally, we add a legend with legend() and show the plot.
- The dataset has already been loaded as a pandas.DataFrame.
- print() functions and the last line of code will be displayed in the output.
- In order for your solution to be accepted, your solution should be located on the last line of the editor and match the expected output data type listed in the question.
Interview Question #18: Online sales growth
This question requires us to create an area chart that will show the growth of online sales over the past five years. We’re instructed to use lightgreen for the area color.
Online sales growth
Create an area chart to depict the growth of online sales over the past five years, using 'lightgreen' for the growth trajectory.
Link to the quesion: https://platform.stratascratch.com/visualizations/10455-online-sales-growth
Dataset: You can see an overview of the DataFrame data below.
Answer: In the solution, we use Plotly Express, an interface for creating interactive plots.
We first create the figure with area() to create an area chart using the year column as the x-axis and sales as the y-axis. We also customize the title and the labels, and then specify a straight-line connection between points with line_shape.
We then go on to customize the trace using update_traces(), specifying the line and the area color.
Next, we customize the chart layout with update_layout(), where we set axis titles. We also customize tick marks: tickmode='array' forces specific tick values, tickvals=df['year'] customizes the tick positions (years), and ticktext=[str(year) for year in df['year']] is a list comprehension that converts each value in the year column to a string and stores it in a list called ticktext.
- The dataset has already been loaded as a pandas.DataFrame.
- print() functions and the last line of code will be displayed in the output.
- In order for your solution to be accepted, your solution should be located on the last line of the editor and match the expected output data type listed in the question.
Data Science Modeling & ML Interview Questions (incl. deep models, time series)

When you get the modeling questions, they will test your knowledge about machine learning and statistical modeling, which also includes questions about deep learning models, time series, and currently the hottest topic, Generative AI and LLMs.
While these are not strictly coding questions, some of them might require you to write an example code, especially in use-case questions.
Interview Question #19: Transformer Model Architecture in LLMs
An example of such a question is to describe the architecture of a transformer model that is commonly used in LLMs.
Answer: The core components of transformer models are the encoder-decoder structure and self-attention mechanisms. The model architecture consists of:
You can find a detailed answer, including the code example, in this GitHub repo.
Interview Question #20: Building a Generative AI Help Desk Chatbot with Retrieval-Augmented Generation (Case-Study)
Here, you’re tasked with designing a prototype system that leverages generative AI to improve a help desk chatbot. You have access to a large collection of public support documents stored on an external platform. The system should allow users to enter free-text questions and receive immediate, relevant, and personalized responses.
You can find a detailed answer (and many more case studies) on Rohan Paul’s website.
Interview Question #21: Identify Peak Points
This interview question from Square asks you to describe how you’d identify the peak points in a time series.
Identify Peak Points
Last Updated: July 2022
Imagine a time series chart with a lot of ups and downs. How would you identify the peak points?
Link to the question: https://platform.stratascratch.com/technical/2390-identify-peak-points
Answer:
Peak points can be identified using the z-score.
The Z-score peak detection algorithm calculates for each data point whether it deviates from a moving average by a given threshold and flags it as a peak if it does.
The parameter lag defines the size of the moving average.
If the point is above the average, it's flagged as a positive peak (1); if the point is below the average, it's flagged as a negative peak (-1).
The average is calculated by the mean of the data, and the deviation is measured by calculating the standard deviation or the z-score.
A more robust measurement can be done using the median and interquartile range (IQR).
Interview Question #22: Neural Network and Logistic Regression
Here’s an interview question by Amazon that asks you to explain how a neural network with one layer and one input and output compares to logistic regression.
Neural Network and Logistic Regression
Last Updated: February 2021
How does a neural network with one layer and one input and output compare to logistic regression?
Link to the question: https://platform.stratascratch.com/technical/2212-neural-network-and-logistic-regression
Interview Question #23: Selecting K
This interview question from Microsoft requires you to know how the value k is selected in k-means clustering models.
Selecting K
Last Updated: February 2022
How is the value k selected in k-means clustering?
Link to the question: https://platform.stratascratch.com/technical/2347-selecting-k
Interview Question #24: PCA and LDA/QDA
Here’s one by IBM that asks you to explain the relationship between PCA and LDA/QDA.
PCA and LDA/QDA
Last Updated: March 2019
What is the relationship between PCA and LDA/QDA?
Link to the question: https://platform.stratascratch.com/technical/2094-pca-and-ldaqda
Data Science Non-Coding Interview Questions
The non-coding family of data science interview questions can be further categorized into the following categories.
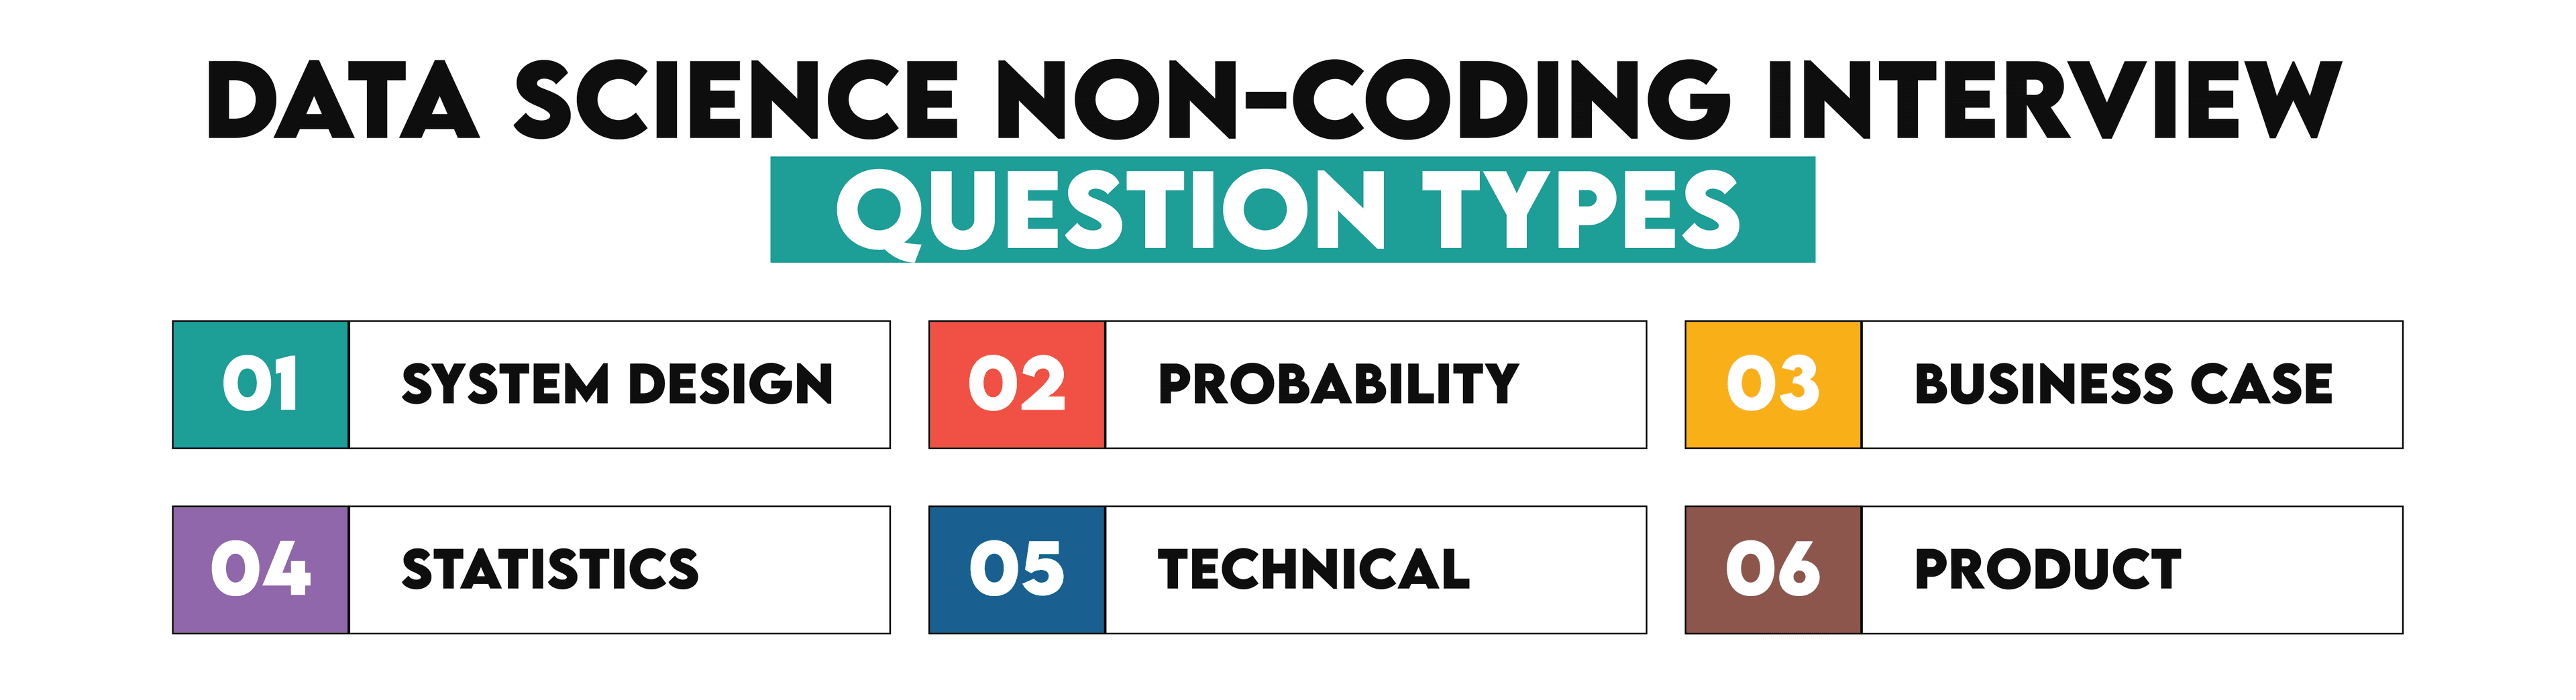
The System Design Data Science Interview Questions
This category of questions is there to test your ability to solve system design problems and create systems from scratch. They typically also include MLOps questions and system reliability scenarios.
Here are several examples of what these questions look like.
Interview Question #25: Ensuring the Robustness of Models in Production
This question, sourced from MentorCruise, asks you to explain how you would ensure the robustness of models in production.
Answer: Ensuring the robustness of models in production is a multistep approach in MLOps. The first step starts during the model development phase, where you prioritize using robust validation strategies, like cross-validation or bootstrapping, to make sure the model performs well on unseen data.
Post-deployment, it's essential to have continuous monitoring in place. This involves tracking the model's key performance metrics to detect any deviations, and also monitoring data for changes in patterns, distribution, or quality.
The third is setting up alerts for model drift, which is where the distribution of the input data starts to drift away from the distribution of the original training data over time. Timely identification of model drift can prevent model performance degradation.
Dependable approaches to mitigate any observed drift would also need to be implemented. This might involve scheduling retraining cycles based on a calendar or triggering them dynamically when model performance degrades beyond a certain point.
Lastly, having model versioning and rollback procedures in place can ensure that if a new model isn't performing as expected in production, there's a smooth transition back to the previous, more robust version. By taking such proactive and reactive measures, MLOps can optimize for the long-term robustness of models in a production environment.
Interview Question #26: Build a Recommendation System
Here’s a question from Audible. It asks you to provide a walkthrough of building a recommendation system.
Build a Recommendation System
Last Updated: February 2020
Can you walk us through how you would build a recommendation system?
Link to the question: https://platform.stratascratch.com/technical/2148-build-a-recommendation-system
Interview Question #27: Python Script for Dataset Splitting in scikit-learn
This question asks you to write a Python script to split a dataset into training and testing sets using scikit-learn.
Interview Question #28: Feature Drift
This question tests your knowledge of feature stability in production by asking you to explain what feature drift is and how it affects ML models.
Interview Question #29: CI/CD pipelines for machine learning
Here’s an interview question asking you to describe how you would create CI/CD pipelines for machine learning.
Interview Question #30: Books Collection
An interview question by Workday asks you to explain how you would tag each book by a genre, given a huge collection of books.
Books Collection
Last Updated: February 2019
Given a huge collection of books, how would you tag each book based on genre?
Link to the question: https://platform.stratascratch.com/technical/2039-books-collection
The Probability Data Science Interview Questions
These are statistics questions focused only on one statistics area. Namely, probability. They are designed to test how you would calculate the probability of different outcomes dressed in real-life situations.
Rare are the people who don’t like spaghetti. If you like them, you’ll also like this question. Even if you don’t like spaghetti, it will do good to you if you try to solve it. It’s a question by Natera:
Interview Question #31: Mom's Spaghetti
Mom's Spaghetti
Last Updated: January 2019
Imagine you have N spaghettis in a bowl. You reach in and grab one end-piece, then reach in and grab another end-piece, and tie those two together. What is the expected value of the number of spaghetti loops in the bowl?
Link to the question: https://platform.stratascratch.com/technical/2024-moms-spaghetti
Answer:
Every time we connect two ends, one of these conditions occurs: either we create a loop or we create a longer spaghetti.
On the first trial, we have N spaghetti and 2N ends. We grab one end and the probability that we pick up the other end of the same spaghetti and make a loop is 1 in 2N − 1.
On the second trial, we have N − 1 spaghetti and 2N − 2 ends. Hence, the probability that we get a loop this time is 1/(2N − 3). The pattern repeats for the third trial onwards and we can formulate the number of loops as:
The question by Zenefits asks you to calculate the probability of winning the rolling dice:
Interview Question #32: First to Six
First to Six
Last Updated: February 2019
Alice and Bob take turns in rolling a fair dice. Whoever gets "6" first wins the game. Alice starts the game. What are the chances that Alice wins?
Link to the question: https://platform.stratascratch.com/technical/2060-first-to-six
If you know how to answer the question, you also increase your probability of getting a job. And maybe makes you more reluctant to bet your money on rolling dice.
One more question for (potential) gamblers is the probability of drawing two cards from a card deck. The Meta/Facebook question asks you exactly that:
Interview Question #33: Pair by Drawing 2 Cards
Pair by Drawing 2 Cards
Last Updated: March 2021
What is the probability of getting a pair by drawing 2 cards in a 52 card deck?
Link to the question: https://platform.stratascratch.com/technical/2241-pair-by-drawing-2-cards
Find more such probability interview questions here → 30 Probability and Statistics Interview Questions for Data Scientists
The Business Case Data Science Interview Questions
These questions involve case studies and questions related to the company/business that require data science skills.
Such questions don’t necessarily have a correct answer. Even if they have it, there are probably several correct answers or at least several ways to get the answer. The point here is that you showcase your way of thinking and how you approach business problem-solving. The process here is more important than the exact solution.
One example of such a question is the “Finding Invalid Schools” question by Meta/Facebook:
Interview Question #34: Finding Invalid Schools
Finding Invalid Schools
Last Updated: February 2021
How many high schools that people have listed on their profiles are real? How do we find out, and deploy at scale, a way of finding invalid schools?
Link to the question: https://platform.stratascratch.com/technical/2211-finding-invalid-schools
There are several solutions to this data science interview problem.
Answer 1: Use Facebook data about users and schools
Approach: Create a graph/cluster of similar users based on their location, age, etc. If some school has only one or a few occurrences it’s probably fake. Instead of looking at similar users, we can only consider user’s friends (and maybe friends of friends) to make this more scalable. It’s very likely that the user’s Facebook friends attend the same school as a user. Another idea is to use school data on Facebook to verify its invalidity. If a school does not have a picture or the school’s name is abnormal, there’s a big chance it’s fake (we can use Machine Learning for this).
Pros: We depend only on app data, we can make the solution scalable.
Cons: If there is not enough application data, our approach will not work. And even if there is, there is no 100% certainty it’s correct. If some school is new and/or users have not updated the high school info it’s possible we claim the high school as invalid, even though it is not invalid.
Answer 2: Use government data that is publicly accessible
Approach: Fetch a list of schools and compare the user’s school with this list.
Pros: Very quick and probably 100% correct.
Cons: Such access is not a common thing in most countries. Also, we depend on outside sources and if the source is not working we can’t use it.
Answer 3: Reporting mechanism
Approach: Give an option to users to report invalid high schools of other users. Based on the number of reports make a decision if a school is invalid.
Pros: Simple solution that depends on users' activity.
Cons: It’s not 100% secure. Also, it could be hard to motivate users for making such explicit actions.
Those are some suggestions on how you could approach answering the question. You can try to solve one more Meta/Facebook question by yourself:
Interview Question #35: McD's Big Macs
McD's Big Macs
Last Updated: January 2019
How many Big Mac does McDonald sell each year in the US?
Link to the question: https://platform.stratascratch.com/technical/2002-mcds-big-macs
Another question that tests your problem-solving creativity is Uber’s question:
Interview Question #36: Determining Origin City
Determining Origin City
Last Updated: January 2019
There is a pool of people who took Uber rides from two cities that were close in proximity, for example Menlo Park and Palo Alto, and any data you could think of could be collected. What data would you collect so that the city the passenger took a ride from could be determined?
Link to the question: https://platform.stratascratch.com/technical/2014-determining-origin-city
Think about it. Which data would you need to have, and how would you collect it?
The Statistics Data Science Interview Questions
We already covered the probability questions, which can also be considered statistics questions. You could expect all the statistics topics in this category, except probability.
For example, Meta/Facebook could ask you something about mean and median:
Interview Question #37: Mean, Median Age in Mexico
Mean, Median Age in Mexico
Last Updated: January 2019
In Mexico, if you take the mean and the median age, which one will be higher and why?
Link to the question: https://platform.stratascratch.com/technical/2013-mean-median-age-in-mexico/
Answer:
To find out which one is higher between the mean and the median, we need to find out first how the age distribution looks like in Mexico. As a rule of thumb, we can determine which one is higher with the following scenario:
If the age is normally distributed, the mean is going to be equal to the median.
If the age distribution is right-skewed, then the mean is larger than the median.
If the age distribution is left-skewed, then the median is higher than the mean.
According to Statista, which you can see more in detail via this link: https://www.statista.com/statistics/275411/age-distribution-in-mexico, Mexico constantly has a right-skewed distribution from 2010 until 2020.
People ages 0-14 occupy 25-29% of the total population in Mexico.
People ages 15-64 occupy 64-66% of the total population in Mexico.
People ages above 65 occupy 6-7% of the total population in Mexico.
Thus, the mean age in Mexico is higher than the median.
The more theoretical question could be one by Travelport:
Interview Question #38: R^2 Value
R^2 Value
Last Updated: February 2020
What is value? Why do we need it? How to calculate it? What is the difference between and adjusted ?
Link to the question: https://platform.stratascratch.com/technical/2153-r2-value
A little bit of formulas writing is tested by FINRA question:
Interview Question #39: Pearson's Correlation Coefficient
Pearson's Correlation Coefficient
Last Updated: January 2021
Prove why Pearson's correlation coefficient is between -1 and 1.
Link to the question: https://platform.stratascratch.com/technical/2191-pearsons-correlation-coefficient
To answer the question, you need to know what Pearson’s correlation is. Then the Cauchy-Schwarz inequality can help you prove why Pearson’s correlation coefficient is between -1 and 1.
The Technical Data Science Interview Questions
The technical data science interview questions could also be considered theoretical questions. They mainly focus on testing the candidate’s knowledge of various data science concepts. Often these questions require theoretical explanations of concepts within a particular programming language, such as SQL or Python. That way, they can be considered the theoretical mirror of the coding questions in a way.
For example, you could come across this data science interview question by Southwest Airlines:
Interview Question #40: UNION and UNION ALL
UNION and UNION ALL
Last Updated: March 2019
What is the difference between UNION and UNION ALL?
Link to the question: https://platform.stratascratch.com/technical/2083-union-and-union-all
Answer:
UNION and UNION ALL are SQL statements that are useful to concatenate the entries between two or more tables. In general, they have the same functionality.
The main difference between UNION and UNION ALL is that the UNION command will only extract the relevant entries that are unique (no duplicates) while UNION ALL will extract all of the relevant entries, including the duplicates.
You see, while you didn’t have to write an SQL code containing UNION or UNION ALL, you still had to know what these two SQL statements do.
Speaking of SQL, you could be required to explain the difference between different joins. For example, like in this Credit Acceptance question:
Interview Question #41: Left Join and Right Join
Left Join and Right Join
Last Updated: March 2021
What is the difference between a left join and a right join in SQL?
Link to the question: https://platform.stratascratch.com/technical/2242-left-join-and-right-join
We shouldn’t forget Python is also massively used in data science. That’s why you should also know something about Python’s dictionary to answer the Moore Capital Management question:
Interview Question #42: Python Dictionary
Python Dictionary
Last Updated: March 2019
How is memory stored and retrieved in Python's dictionary?
Link to the question: https://platform.stratascratch.com/technical/2091-python-dictionary
A hint? The answer should have something to do with hash tables. Wink-wink, nudge-nudge.
The Product Data Science Interview Questions
The product questions are the least universal questions you could get at an interview. They are designed to test your knowledge of the specific company’s product(s). That way, they’re not only testing your problem-solving skills but also how familiar you are with the company itself and its products. The ideal scenario would be to be a long-time customer itself.
Visa could be interested in credit card activity:
Interview Question #43: Credit Card Activity
Credit Card Activity
Last Updated: January 2022
How can you identify where a person lives based solely on their credit card activity?
Link to the question: https://platform.stratascratch.com/technical/2342-credit-card-activity
Another question asking to show your product knowledge is the one by eBay:
Interview Question #44: Identify Ebay Objects
Identify Ebay Objects
Last Updated: March 2019
Ebay has to identify the cameras from the other objects like tripods, cables and batteries. What would be your approach? Data include ads title, description of the product, price, images etc.
Link to the question: https://platform.stratascratch.com/technical/2075-identify-ebay-objects
Yammer, on the other hand, is interested in reports on the content upload:
Interview Question #45: Spike in Uploads
Spike in Uploads
Last Updated: February 2019
You are compiling a report for user content uploaded every month and notice a spike in uploads in October. In particular, a spike in picture uploads. What might you think is the cause of this, and how would you test it?
Link to the question: https://platform.stratascratch.com/technical/2044-spike-in-uploads
As you can see, you don’t have to be an avid user of every product possible. However, you should at least become familiar with the products the company offers. That is especially important if you apply for some product-specific positions. It’s also helpful to know different types of product interview questions in detail.
Conclusion
In preparing for a data science job interview, there’s a vast range of question types you should cover. The three are coding, modeling & ML, and non-coding data science interview questions.
While the coding questions are the most common, coding is not the only skill you need to have. That’s why the non-coding questions are equally important. Their purpose is to test your statistical, modeling, and system design skills, as well as your product knowledge, problem-solving abilities, and other technical skills.
This guide gives you an overview of the range of questions that await you at the data science interview for top companies. It’s not an easy task to get a job in such data science companies. Going through all these data science questions is only a starting point. Now is your turn to explore all other coding and non-coding interview questions.
Share