30 Probability and Statistics Interview Questions for Data Scientists

Categories:
 Written by:
Nathan Rosidi
Top 30 Probability and Statistics Interview Questions that can help you sharpen your skills to ace your data science interview.
Questions about statistical or probability concepts in a data science interview can be tricky to handle. This is because unlike a product question, statistics and probability questions have a definite right or wrong answer. This means that your knowledge about specific statistics and probability concepts will be fully tested during the interview. Thus, it is necessary to brush up on your statistics knowledge and be fully prepared before the data science interview.
In this article, we’re going to help you to brush up your statistics and probability skills by providing thirty relevant interview questions from various companies as well as the solutions.
Note that in this article, we’re only going to discuss the interview questions and their solutions. The theoretical concept will only be explained briefly. If you want to freshen-up your theoretical knowledge about statistics and probability, you might want to check out our ultimate guide here.
So, let’s dive into it straight away.
Probability Interview Questions
There are at least three big topics in probability that are commonly asked in a data science interview:
- Independent and dependent events
- Permutations and combinations
- Probability distribution
We’re going to go through all of these three topics one-by-one. Let’s start with independent and dependent events.
Independent and Dependent Events
In probability, an event can be said as an independent event if the probability of one event to occur doesn’t affect the probability of another event to occur.
The most common example of independent events is throwing two different dice or tossing a coin several times. When we toss a coin, the probability of us getting a tail in the second toss wouldn’t be affected by the result that we got from the first toss. The probability of us getting a tail will always be 0.5.
Meanwhile, an event can be said as a dependent event if the probability of one event to occur affects the probability of another event to occur.
An example of a dependent event is drawing cards from a deck of cards. Let’s say we want to know the probability of us getting a red heart from a deck of cards. If you haven’t drawn a card from the deck before, then the probability of you getting a red heart would be 13/52. Let’s say that you got a black spade in the first draw. Then, the probability of you getting a red heart in the second draw is no longer 13/52, but 13/51 because you have drawn one card from the deck.
Below are the examples of data science interview questions from various companies that will test our knowledge in dependent and independent events:
Question from Facebook:
“What is the probability of drawing two cards (from the same deck of cards) that have the same suite?”
This is an example of a dependent event. The probability that two events will occur in the case of dependent event can be defined as:
which means that the probability of event A and event B to both occur is the same as the probability of event A to occur times the probability of event B to occur given the result of event A.
In our case, there are four suites in a deck of cards, and each suite has 13 cards.
In the first draw, our probability to get a card with a specific suite would be 13/52. In the second draw, our probability of getting a card with the same suite as the first one wouldn’t be 13/52 anymore, but 12/51. Hence:
Question from Jane Street:
“What is the probability of choosing 2 queens out of a deck of cards?”
This is also an example of a dependent event. In the first draw, our probability of getting a queen is 4/52. If we do get a queen in the first draw, then our probability to get another queen in the second draw would be 3/51. Hence:
Question from Facebook:
“Let’s say you have 2 dice. What is the probability of getting at least one 4?”
Different from previous questions, this question is one of the examples of independent events since the outcome from throwing a die wouldn’t have any effect on the outcome from throwing the second die.
Let’s say that:
A = getting a 4 in the first die
B = getting a 4 in the second die
The probability of independent events A and B both to occur can be defined as:
And the probability of getting at least one 4 can be computed with the probability of union of two events:
We know that the probability of us getting any specific outcome from throwing a die is ⅙. Thus,
Question from Facebook:
“Three ants are sitting at the three corners of an equilateral triangle. Each ant randomly picks a direction and starts to move along the edge of the triangle. What is the probability that none of the ants collide?”
Although it’s implicit, this is the case of an independent event. Each ant can randomly pick the direction, either to the left or to the right. The decision of one ant to go to the left wouldn’t affect the decision of the other two ants whether they want to go to the left or right.
Since the decision is random, then the probability of an ant to pick a certain direction is 0.5. The three ants wouldn’t collide if all of them go to the left or all of them go to the right.
Hence:
Permutations and Combinations
Permutations and combinations probably sound similar and we have probably used the two words interchangeably in real life. However, they have a distinct difference in terms of their concept and it is important for us to know how to differentiate between combination and permutation because they have different formulas.
One big difference between permutation and combination is the importance of order. The order is very important in permutation but not in combination. This concept of order will be explained more deeply in the examples of data science interview questions below.
Question from Kabbage:
“How to find who cheated on essay writing in a group of 200 students?”
There are different ways on how we can find who’s cheating in an exam. One way to do this is by comparing a pair of student exams one-by-one.
If we think about it, comparing the exam of student A with student B is the same as comparing the exam of student B with student A. In other words, A, B = B, A. The order doesn’t matter.
Since the order doesn’t matter, then we can use the concept of combination. The general equation of combination is:
where n is the total number of items and k is the total number of items to be selected.
Since there are 200 students and there 2 exams that will be compared, then we have:
Question from IBM:
“From a deck of cards numbered from 1 to 100, we draw two cards at random. What is the probability that a number on one of the cards is exactly double the number on the second card?”
This question can also be answered with the concept of combination. This is because when we draw two cards from the same deck of cards, the order is not important. This means that if we get a card number 10 in the first draw and number 40 in the second draw, this is the same as getting card number 40 in the first draw and number 10 in the second draw.
Thus, by plugging values that we know from the question into the combination equation we will get:
which means that we have 4950 combination pairs.
Now out of those 4950 combinations, the number of possibilities that one card is the double of the other card is 50, since we have 100 cards in total. Thus, we can compute the probability as:
Question from Peak6:
“Three people, and 1st, 2nd and 3rd place at a competition, how many different combinations are there?”
In this question, the order actually matters because being in the 1st position is not the same as being in the 2nd or 3rd position.
This means that if we have athletes A, B, C and position 1, 2, 3, then the composition of A, B, C is not the same as C, B, A nor B, A, C. Thus, we’re dealing with the concept of permutation in this question.
The general equation for permutation problem is:
where n is the total number of items and k is the total number of items to be ordered.
In the questions, we have three athletes and three places to be ordered, hence:
Probability Distributions

A knowledge about probability distribution is a must before you’re going to a data science interview. Question about probability distributions is one, if not, the most popular data science interview question out there.
Below is one interview question that test your general knowledge about probability distributions:
Question from IBM:
“What is an example of a dataset with a non-Gaussian distribution?”
We can answer this question by providing an example of data with binomial distribution, such as the frequencies you’ll get 500 tails from tossing a coin 1000 times, the frequencies of us getting two 5 from throwing a die 10 times, etc.
The thing is, you can’t answer this question if you don’t know about probability distributions in the first place. To make things worse, there are a lot of different probability distributions out there. So do we need to know all of the probability distributions?
Of course not.
Binomial, uniform, and Gaussian distributions are the most popular ones in a data science interview among all probability distributions. And if you’re really new to probability distribution, you can start with these three before branching out to the other probability distributions.
There are two types of questions related to probability distributions that are commonly asked in a data science interview: either you’re asked to compute the probability mass function (PMF) / probability density function (PDF) of a distribution or to compute the expected value of a distribution.
Let’s start with binomial distribution.
Binomial Distribution
Binomial distribution is one of discrete probability distributions and it measures the probability of success of an event in a certain number of trials.
The probability mass function (PMF) of binomial distribution is as follows:
where n is the number of trials and k is the number of successes. Meanwhile, the expected value of binomial distribution can be computed as follows:
Below are the examples of data science interview questions from various companies that cover the concept of binomial distribution.
Question from Verizon Wireless:
“What is the probability of getting one 5 on throwing dice 7 times?”
This question can be answered by simply plugging in values into the equation of binomial distribution. We can consider that the number of successes is 1 (because we’re looking at one 5) and the number of trials is 7. Meanwhile, the probability of getting a 5 in a single throw is, as we all know, ⅙. Hence:
Question from Jane Street:
“What's the probability of obtaining 2 tails in 5 coin flips?”
Same as the previous question, this can be answered by simply plugging in values into the PMF equation of binomial distribution. In this scenario, the number of successes is 2 because we’re looking at obtaining 2 tails and the total number of trials is 5. The probability of getting a tail in each fair coin toss is 0.5. Hence:
Question from Lyft:
“A discount coupon is given to N riders. The probability of using a coupon is P. What is the probability that one of the coupons will be used?”
Again, this question can also be answered by plugging in the values into the PMF equation of binomial distribution.
From the question, we can say that the number of successes is 1 (because only one coupon will be used) and the number of items is N, while the probability of success of a single trial is P.
Thus,
Question from Lyft:
“A $5 discount coupon is given to N riders. The probability of using a coupon is P. What is the expected cost for the company?”
Different from the previous question, now we need to compute the expected value of a variable with binomial distribution instead of computing the PMF. We can answer this question by plugging in the values into the equation of expected value of binomial distribution.
From the equation above, we have N coupons and the probability of using a coupon is P.
Thus, the expected value would be:
And the expected cost would be:
Question from Facebook:
“We have two options for serving ads within Newsfeed:
1. Out of every 25 stories, one will be an ad
2. Every story has a 4% chance of being an ad.
For each option, what is the expected number of ads shown in 100 news stories? If we go with option 2, what is the chance a user will be shown only a single ad in 100 stories?”
This question tests your knowledge on both expected value and the PMF of binomial distribution.
The first question, which is the expected number of ads shown in 100 news stories would be:
Meanwhile, the second question can be answered with the PMF of binomial distribution, where the total number of trials is 100, the total number of successes is 1 (only a single ad), and every story has 0.04 probability of being an ad.
Uniform Distribution
Uniform distribution can be classified as both discrete and continuous probability distribution, depending on the use case. It measures the probability of an event with n possible outcomes, where each n is equally likely to happen. Because of this, it has a flat PMF/PDF.
The common example of a uniform distribution is throwing a die. Our probability of getting any of the sides from a 6-sided die would always be ⅙.
The expected value of a discrete uniform distribution is:
where a is the minimum possible outcome and b is the maximum outcome. As an example, when we roll a 6-sided die, the minimum possible outcome would be 1 and the maximum possible outcome is 6.
Below are the examples of data science interview questions that test your knowledge about uniform distribution.
Question from Jane Street:
“What is the expectation of a roll of a die?”
We can solve this question easily by plugging in the values into the formula of expected value of a uniform distribution as follows:
Question from Walmart:
“Suppose you roll a die and earn whatever face you get. Now suppose you have a chance to roll a second die. If you roll, you earn whatever face you get but you forfeit earnings from the first round. When should you roll the second time?”
This question is somewhat an extension from the previous question. As you already know from the previous question, the expected value of a roll of a 6-sided die is:
To answer this question, we need to think it like this:
If we get more than 3.5 (the expected value of a single roll) in the first roll, then we shouldn’t roll the second die and keep the earnings. Meanwhile, if we get less than 3.5, then we should roll the second die.
Question from PayPal:
“What has the larger expected value: sampling a number between 1 and N from a uniform distribution and multiplying it by itself, or sampling two numbers between 1 and N from a uniform distribution and multiplying them?”
This question can be interpreted to either one of these two:
First interpretation: Take one sample, multiply the sample by itself, then compute the expected value after we multiply the sample.
To answer this question, we need to know the general equation of variance for a variable with uniform distribution:
- For the first case, we sample a number between 1 to N, let's call this X. If we multiply this X by itself, then we have X^2 and its expected value would be E(X^2).
- For the second case, we sample two numbers independently between 1 to N, hence the expected value for both numbers after we multiply them would be E(X)E(X) = E(X)^2.
If we look at the variance equation above, we know that the value of variance should always be positive. To fulfill this condition, then E(X^2) has to be larger than E(X)^2. Hence, the expected value of sampling a number between 1 and N and multiplying it by itself will always be larger.
Second interpretation: Take one sample, compute the expected value of that one sample, then multiply that expected value by itself.
- For the first case, we first sample a number between 1 and N from a uniform distribution, then we multiply the expected value of that number by itself, hence we have E(X)^2.
- For the second case, we sample two independent numbers, and multiply their expected value, hence we have E(X)E(X) = E(X)^2.
Thus, we can conclude that both methods result in similar expected values.
Gaussian Distribution
Gaussian distribution or normal distribution is a bell-shaped curve that is characterized with two parameters: the mean and the standard deviation.
Interview questions about normal distribution are normally coupled with other themes in the scope of inferential statistics, such as how to infer p-Value, sample size, margin of error, confidence interval, and hypothesis testing.
You can see the example interview questions of any of these in the following section.
Statistics Interview Questions

There are also at least three big topics in statistics that are commonly asked in a data science interviews, which are:
- Measure of center and spreads (mean, variance, standard deviation)
- Inferential statistics
- Bayes’ theorem
Let’s discuss the measure of center and spread first.
Also, check out our Comprehensive Statistics Cheat Sheet to know about Important terms and equations for statistics and probability.
Mean, Variance, Standard Deviation
The concept of measure of center (mean, median, mode) and measure of spread (variance, standard deviation) are the very first concepts that you should master before delving deep into statistics.
This is why questions about these concepts are very popular in a data science interview. Companies want to know whether you have a basic knowledge of statistics or not. Below is an example that asks about these concepts.
Question from Facebook:
“In Mexico, if you take the mean and the median age, which one will be higher and why?”
This question tests your knowledge about the concept of measure of center. To find out which one between mean and median that will be higher, we need to find out the age distribution in Mexico.
According to Statista, Mexico has a right-skewed distribution in terms of its age distribution. If you take a look at the below image, a right-skewed distribution has a higher mean compared to the median.
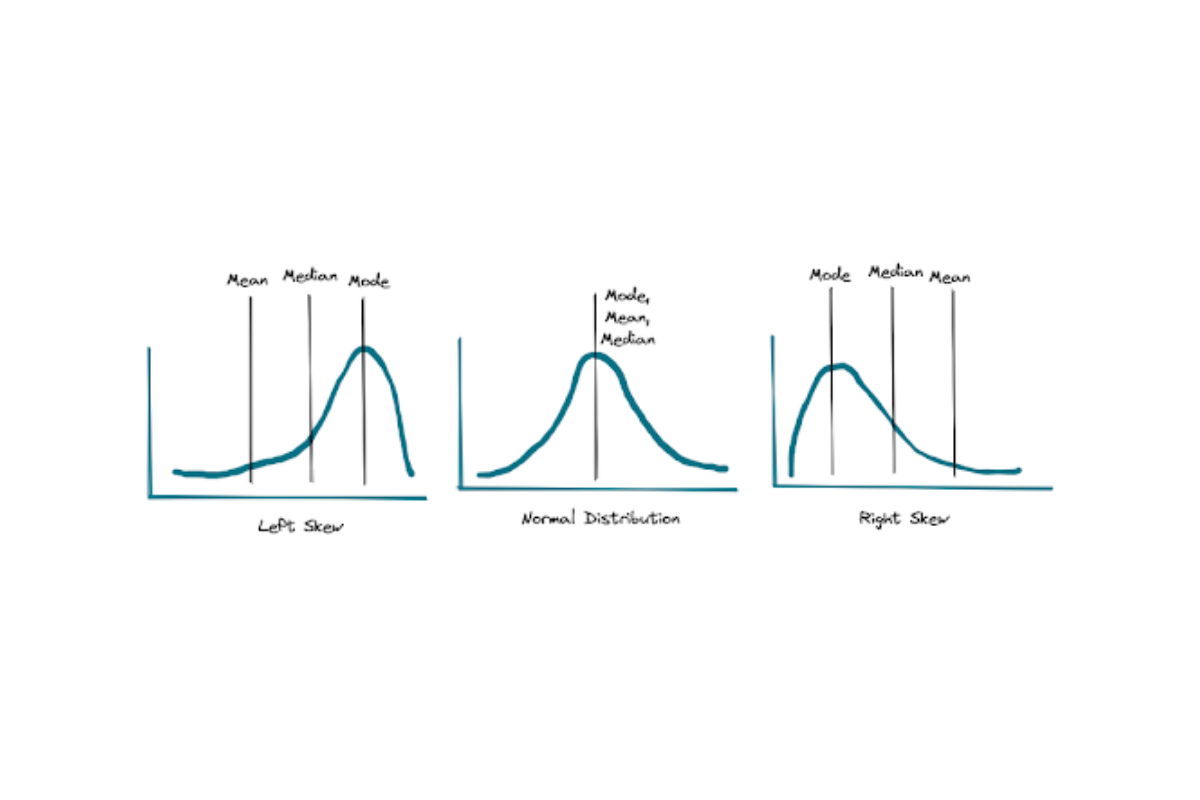
Thus, the mean age is higher than the median age in Mexico.
Question from Microsoft:
“What is the definition of the variance?”
As the concept says, the variance measures the spread of data points of a dataset with respect to its mean value. Below is the general equation of a variance:
where S is the variance, x is the sample, x bar is the sample mean, and n is the total number of samples.
Inferential Statistics
Inferential statistics is a very popular topic in data science interviews. This is because by asking a question within this topic, companies can gauge your thought process when deriving some insights that come from the data.
Inferential statistics come with different steps and terms, such as hypothesis testing, confidence interval, p-Value, margin of error, and sample size.
Let’s start with several example questions about p-Value.
p-Value
Question from Amazon:
“How would you explain to an engineer how to interpret a p-value?”
Question from State Farm:
“What is a p-value? Would your interpretation of p-value change if you had a different (much bigger, 3 mil records for ex.) data set?”
p-Value stands for probability value in the field of statistics and is normally used during hypothesis testing. p-Value describes how unlikely the data that you just observed given the fact that your null hypothesis is true.
Normally, we set a significance level before hypothesis testing. If the p-Value is below our significance level, then we reject the null hypothesis. Meanwhile if the p-Value is above significance level, then we go with our null hypothesis.
The interpretation of p-Value wouldn’t change if your dataset is getting bigger, but bigger dataset means a more robust and more reliable result from our p-Value.
Confidence Interval, Sample Size, and Margin of Error
The concepts of confidence interval, sample size, and the margin of error normally come along together due to their relationships, as you will see in the following confidence interval equation:
In the equation above, X_bar is the sample mean, Z is the confidence value, σ is sample standard deviation, and n is the sample size.
Meanwhile, margin of error can be defined as:
As you can see above, there is a relationship between confidence interval, margin of error, and sample size value. And this is why the questions between these terms are closely tied together.
Now let’s take a look at interview questions that talk about these concepts.
Question from Google:
“For sample size n, the margin of error is 3. How many more samples do we need to bring the margin of error down to 0.3?”
This question can be answered by simply plugging in values into the equation of margin of error above.
which means that we need 100 times more samples than our initial sample size to bring down the margin of error to 0.3.
Question from Facebook:
“Let's say the population on Facebook clicks ads with a click-through-rate of P. We select a sample of size N and examine the sample's conversion rate, denoted by hat{P}, what is the minimum sample size N such that Probability( ABS(hat{P} - P) < DELTA ) = 95%? In other words, find the minimum sample size N such that our sample estimate hat{P} is within DELTA of the true click-through rate P, with 95% confidence.”
This question tests our knowledge about confidence intervals, margin of error, sample size, and binomial distribution. The conversion rate in the question follows a binomial distribution, which means we need to estimate standard deviation σ with the square-root of variance of binomial distribution.
The general equation for the variance of binomial distribution is:
From the question, we know that we have a 95% confidence interval, which translates to a Z-score equals to 1.96 (see the Z-table to obtain this value). Plugging in this equation into the equation margin of error, we get:
Question from Tesla:
“There are 100 products and 25 of them are bad. What is the confidence interval?”
Same as the previous question, this question also tests our knowledge about confidence interval, margin of error, sample size, and binomial distribution.
The problem stated in the question follows a binomial distribution, so we need to compute the sample mean from the expected value of binomial distribution and the standard deviation from the variance of binomial distribution.
Once we compute the mean and the standard deviation from the binomial distribution formula, then we can just plug those values into the equation of confidence intervals to find out the answer.
Hypothesis Testing
Interview questions about hypothesis testing are normally presented as an example use case. Companies will give you a specific use case about their products and they will ask you about how you would know if one product performs better in the market compared to the other product. Below is the example of that:
Question from Facebook:
“We have a product that is getting used differently by two different groups.
1. What will be your hypothesis?
2. How would you go about testing your hypothesis?”
This question tests our knowledge about different steps that we should take to conduct a hypothesis testing.
Below is the step-by-step example on how we should conduct a hypothesis testing:
- Formulate our null hypothesis and the alternative hypothesis
- Choose the significance level. The significance level can vary depending on our use case. However, we can pick the default value, which is 0.05.
- Compute the sample mean and sample standard error from our data.
- Compute the t-statistics which correspond to your use case, whether it is paired t-test, one sample t-test for population mean, two sample t-test, ANOVA, or Chi-Squared.
- If the p-Value from the resulting test is below our significance value, then we reject our null hypothesis in favour of the alternative hypothesis. Meanwhile, if the resulting p-Value is above the significance value, then we take the null hypothesis.
Question from Amazon:
“In an A/B test, how can you check if assignment to the various buckets was truly random?”
If the buckets were truly assigned at random, then in terms of statistics we wouldn’t notice any significant differences between variable samples in each bucket. But how do we know whether the sample differences between buckets is significant or not?
We can use a statistical test to measure this.
If the variables that we observe are continuous variables and there is only one treatment, we can use the two-sample t-test. Meanwhile, if there are multiple treatments, then we can use ANOVA.
After conducting a statistical test, we will get a p-Value and we can use this p-Value to conclude whether there is a significant difference between buckets.
Bayes’ Theorem
Bayes’ theorem is also commonly asked in data science interview questions. This statistical approach has a different approach compared to frequentist statistics that we saw in the Inferential Statistics section above. In fact, some companies might ask you what is the difference between Bayesian and frequentist statistics as below:
Question from Yelp:
“What is the difference between Bayesian vs frequentist statistics?”
The main difference between these two is:
- In frequentist statistics, the inference is interpreted as long run frequencies. This means that if we repeat the trial for an infinite amount of times, we want to measure how many times that the mean of each trial is within 95% of the population's confidence interval.
- In Bayesian statistics, the procedure is interpreted as a subjective belief. In the end, the goal is to update your belief based on the evidence of the data.
Bayesian inference has the same analogy as how we as a human make an inference. In the beginning, we always have a certain degree of belief in how likely something is going to happen. Then, as we see more and more evidence, our belief will be updated.
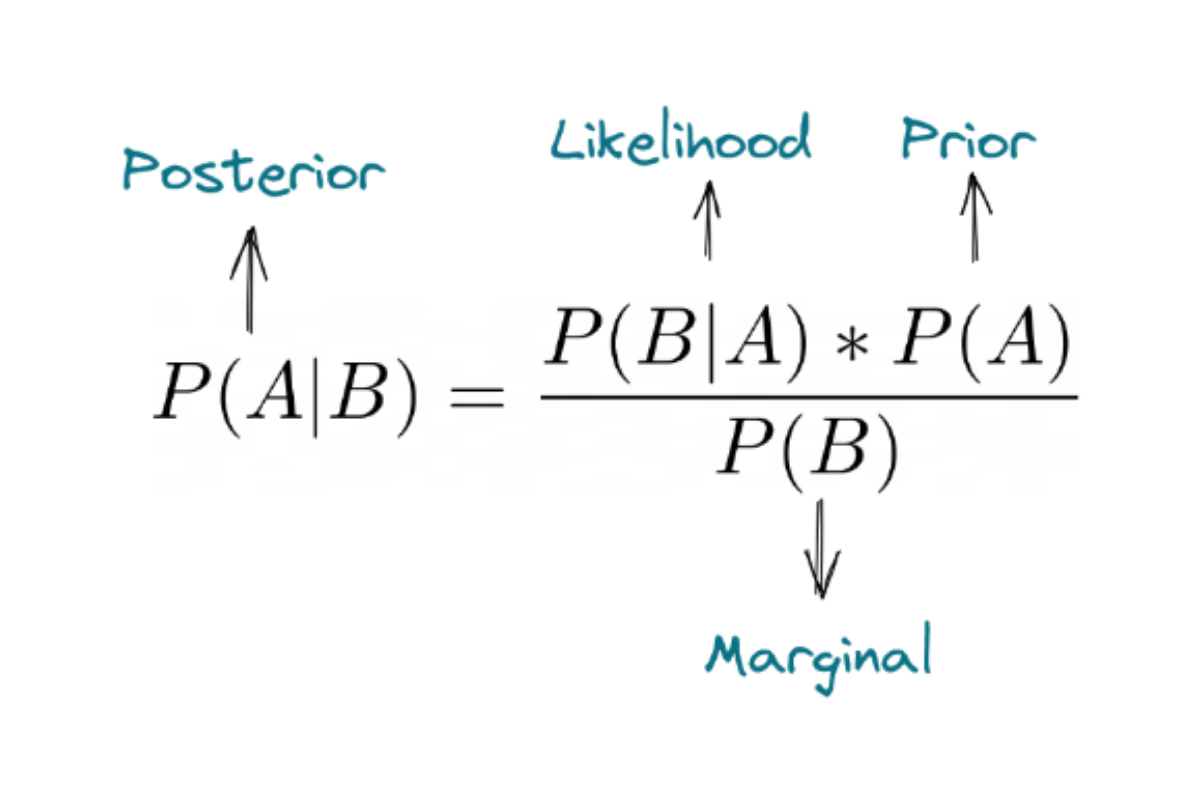
There are four fundamental terms in Bayes’ rule: prior, posterior, likelihood, and marginal as you can see from the equation below.
Below are some examples of data science interview questions that test our knowledge about Bayes’ theorem.
Question from Facebook:
“You're about to get on a plane to Seattle. You want to know if you should bring an umbrella. You call 3 random friends of yours who live there and ask each independently if it's raining. Each of your friends has a 2/3 chance of telling you the truth and a 1/3 chance of messing with you by lying. All 3 friends tell you that "Yes" it is raining. What is the probability that it's actually raining in Seattle?”
To answer this question, you need to make an assumption about the probability of rain in Seattle. Let’s say it’s 0.5.
Each of our friends has a ⅔ chance of telling the truth, so the probability of rain in Seattle given that our friends say that it will be raining in Seattle would be ⅔. Likewise, the probability of not raining given that our friends say that it won’t be raining in Seattle is also ⅔.
Based on this, let’s define an event as below:
- A = raining in Seattle
- A’ = not raining in Seattle
- Xi = random variable with Bernoulli distribution, where the value of this variable represents the answer of our friends: raining (1) or not (0)
Thus, we can approximate the probability that it will rain in Seattle given that our friends say that it will rain with Bayes’ theorem.
Question from Facebook:
“You randomly draw a coin from 100 coins - 1 unfair coin (head-head), 99 fair coins (head-tail) and roll it 10 times. If the result is 10 heads, what's the probability that the coin is unfair?”
To answer this question, we need to define an event:
A = The coin is unfair
A' = The coin is fair
B = The result of rolling random coins 10 times is 10 heads.
After defining the above events, we can plug the values into the Bayes’ equation as follows:
Question from Zenefits:
“There are 30 red marbles and 10 black marbles in Urn #1. You have 20 red and 20 Black marbles in Urn #2. Randomly you pull a marble from the random urn and find that it is red. What is the probability that it was pulled from Urn #1?”
We can answer this question with the same approach as the previous question by defining an event first:
A = The marble was pulled from Urn #1
A' = The marble was pulled from Urn #2
B = The marble is red
Now after we define the above event, we can plug the values into Bayes’ theorem equation as follows:
Question from Lyft:
“A discount coupon is given to 2 riders. The probability of using a coupon is P. Given that at least one of them uses a coupon, what is the probability that both riders use the coupons?”
This question tests your knowledge about two concepts: Bayes’ theorem and binomial distribution.
With the PMF of binomial distribution, the probability of exactly one rider uses the coupon can be computed as follows.
The probability that both of them use the coupon can be computed as well with the PMF of binomial distribution.
The probability that at least one coupon being used is the example of a mutual exclusive event, which means:
Next, as usual, we need to define an event to make it easier for us to understand what each term in Bayes’ theorem equation represents.
A = at least one of the riders uses the coupon
B = both riders use the coupon
Now we can plug the values into Bayes’ theorem equation as follows:
And that’s all of the 30 probability and statistics interview questions from various companies. We hope that these questions can help you to sharpen your skills to ace your data science interview. Remember, the ability to solve statistics and probability interview questions won’t come from one sitting, but rather from a habit that you build from learning consistently.
Share