30 Product Analyst Interview Questions

Categories:
 Written by:
Tihomir Babic
Lacking confidence for the product analyst interviews? 30 questions, 7 topic categories, numerous interview tips, and practice opportunities will fix that.
A product analyst is an interesting job: technical but also business- and user-oriented. Interviews reflect that mix, making them harder than they look.
This guide cuts through that. You’ll find info on what the interviews look like, with 30 interview questions across seven topic categories to illustrate that. No fluff, no nonsense. Just what you need to be prepared.
What Product Analyst Interviews Actually Test
The answer lies in the position name: it’s about product, and it’s about analysis. In other words, interviewers want to test how you make decisions about a product using data.
So, yes, SQL coding is tested. However, interviewers are not looking to be impressed by speedy, clean SQL coding. No, SQL is there to test your metric judgement, the skill interviewers focus on.
Product analyst interviews essentially test “only” two things.
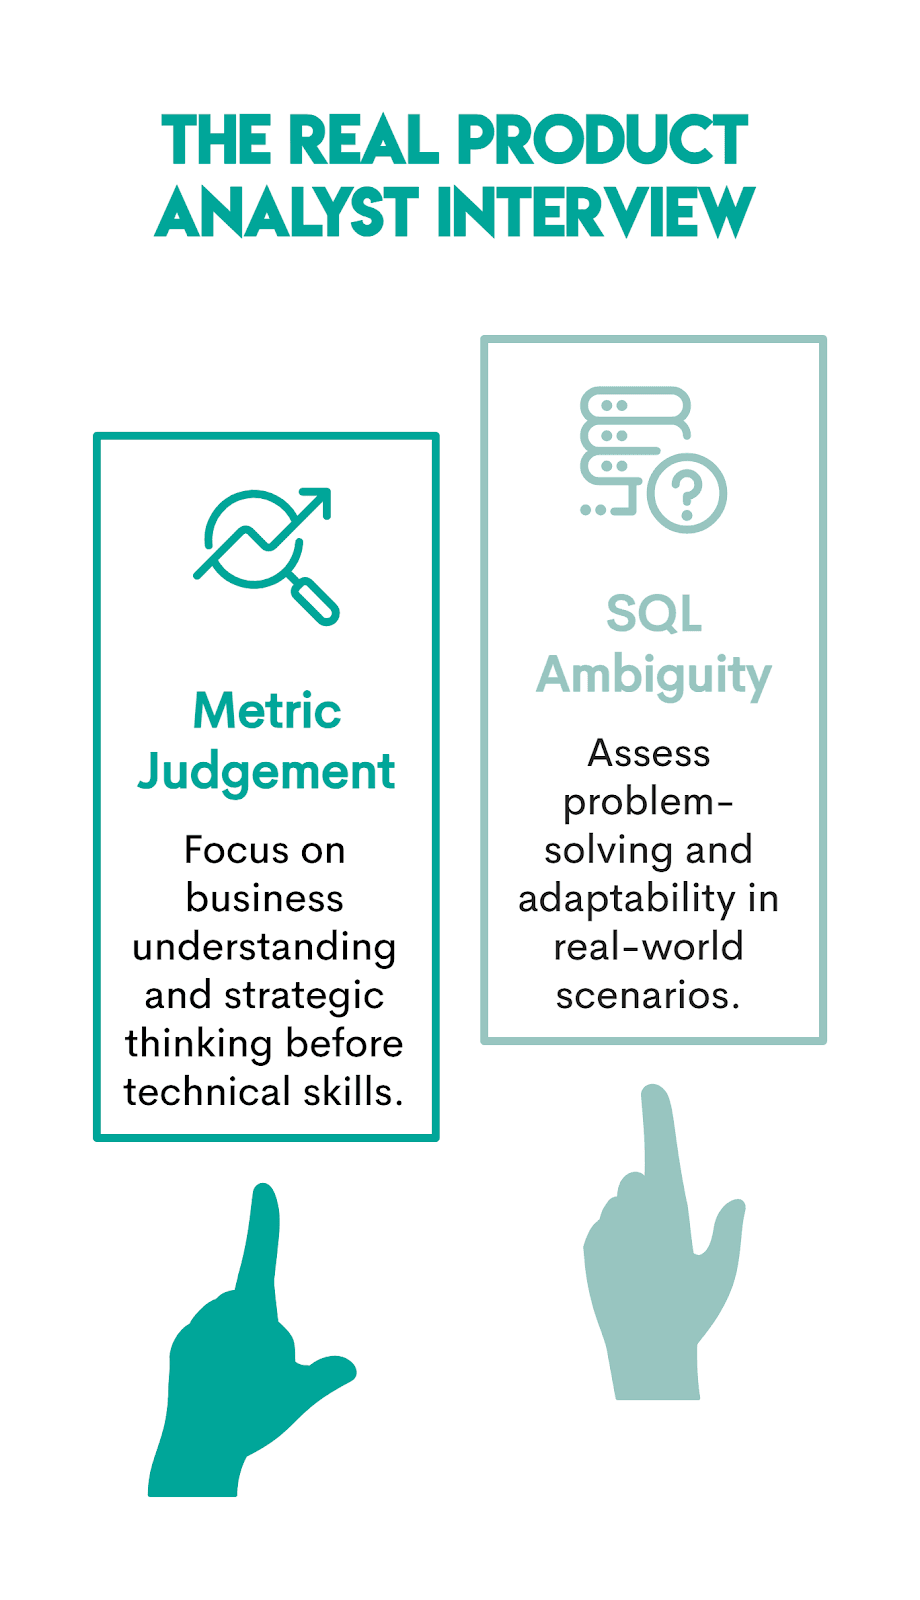
1. Metric Judgement: Business First, SQL Second
The main focus is on choosing the right metric for the problem before you. That’s what product analysts do. SQL is there only to perform calculations.
Below, I have listed the most important metrics that product analysts need to understand and calculate. While it covers most typical problems, it’s not an exhaustive list. It’s impossible to cover everything here. If you feel your interview could be more niche and industry-specific, you should explore more metrics, just in case.

The interviewers expect you to:
- pick one or two metrics that match the problem
- explain why you chose those metrics
- translate the calculation into SQL
It’s not rare to see candidates immediately jump into calculation. But what’s the point in the correct calculation, when you calculated the wrong thing? Interviewers will mark that down instantly.
2. SQL Under Ambiguity: Real Job Conditions
The product analyst interview questions are intentionally ambiguous. As already mentioned, it’s up to you to come up with metrics to define and calculate. The interviewers want to test whether you understand what you’re doing (from the business point of view), not just syntax.
They expect you to notice the ambiguity and ask clarifying questions or come up with reasoning yourself. For example:
- What is the definition of an active user?
- Is the metric event-based or session-based?
- Do we measure the metric by first action or first purchase?
- What about the users accessing from multiple devices?
Only after clarifying that, and only then, can you deal with actual data and SQL coding.
Product Analyst Interview Format
Product analyst interviews don’t follow a unified script, and the actual process (organizational and in terms of the number of interviews) differs from company to company.
Still, there are not unlimited ways to assess candidates. In most cases, interviews will include one or more of the approaches illustrated below.
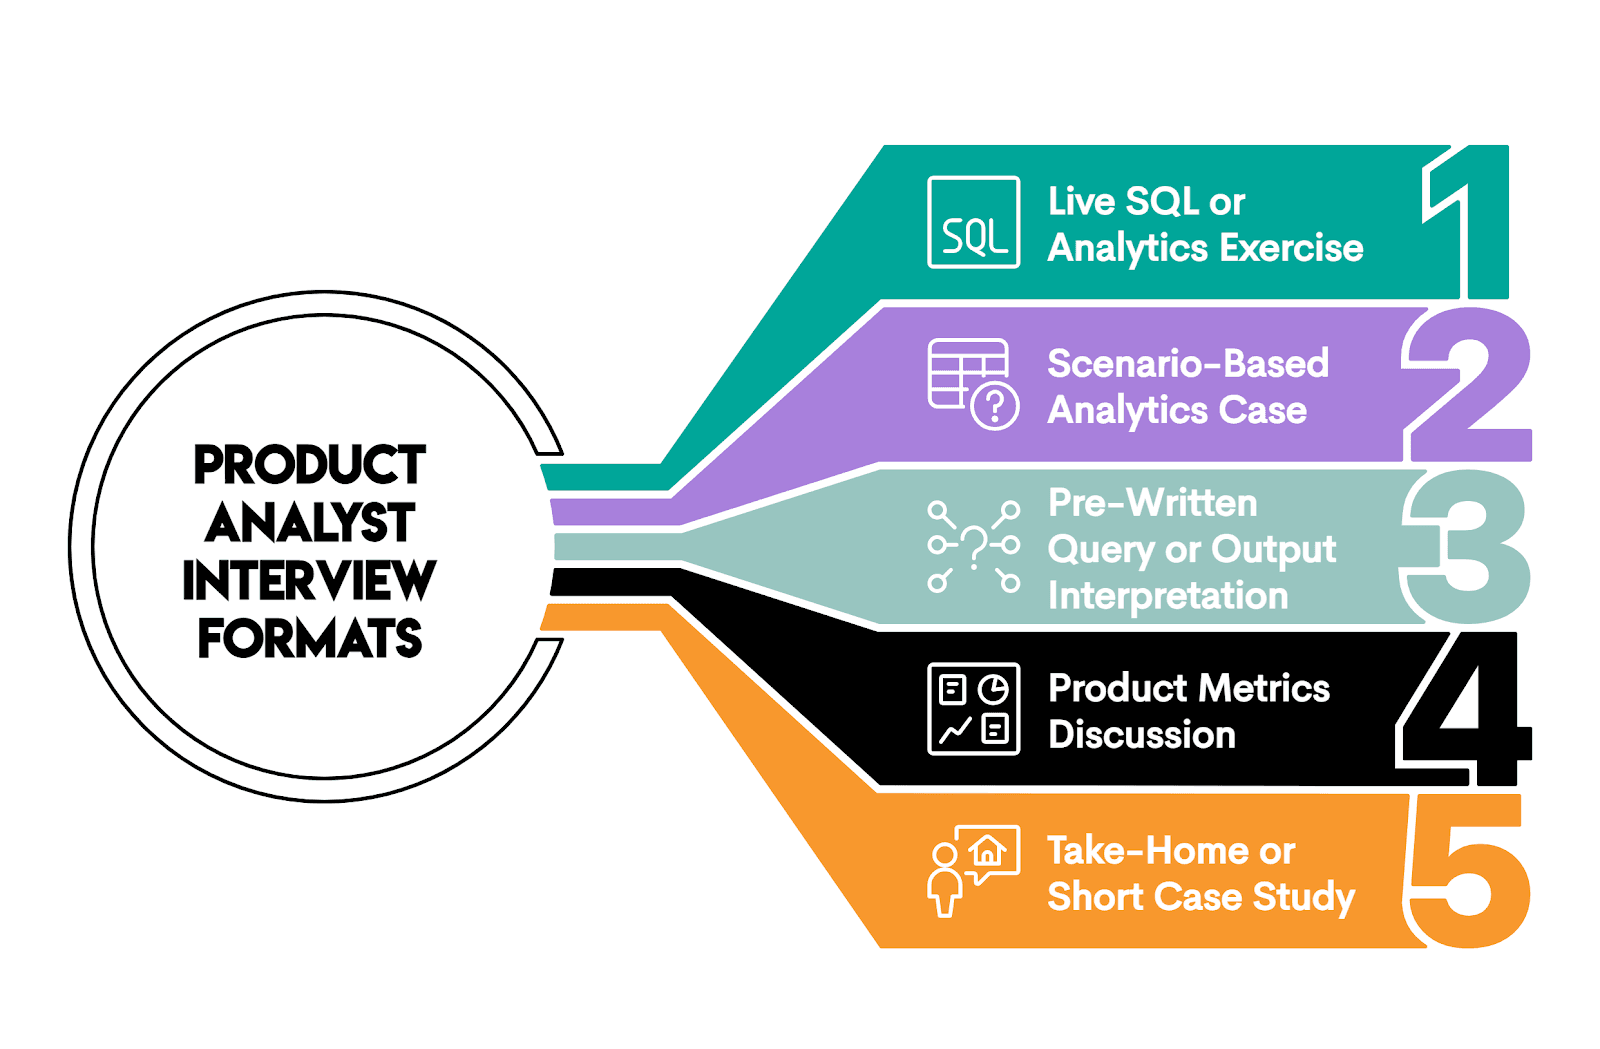
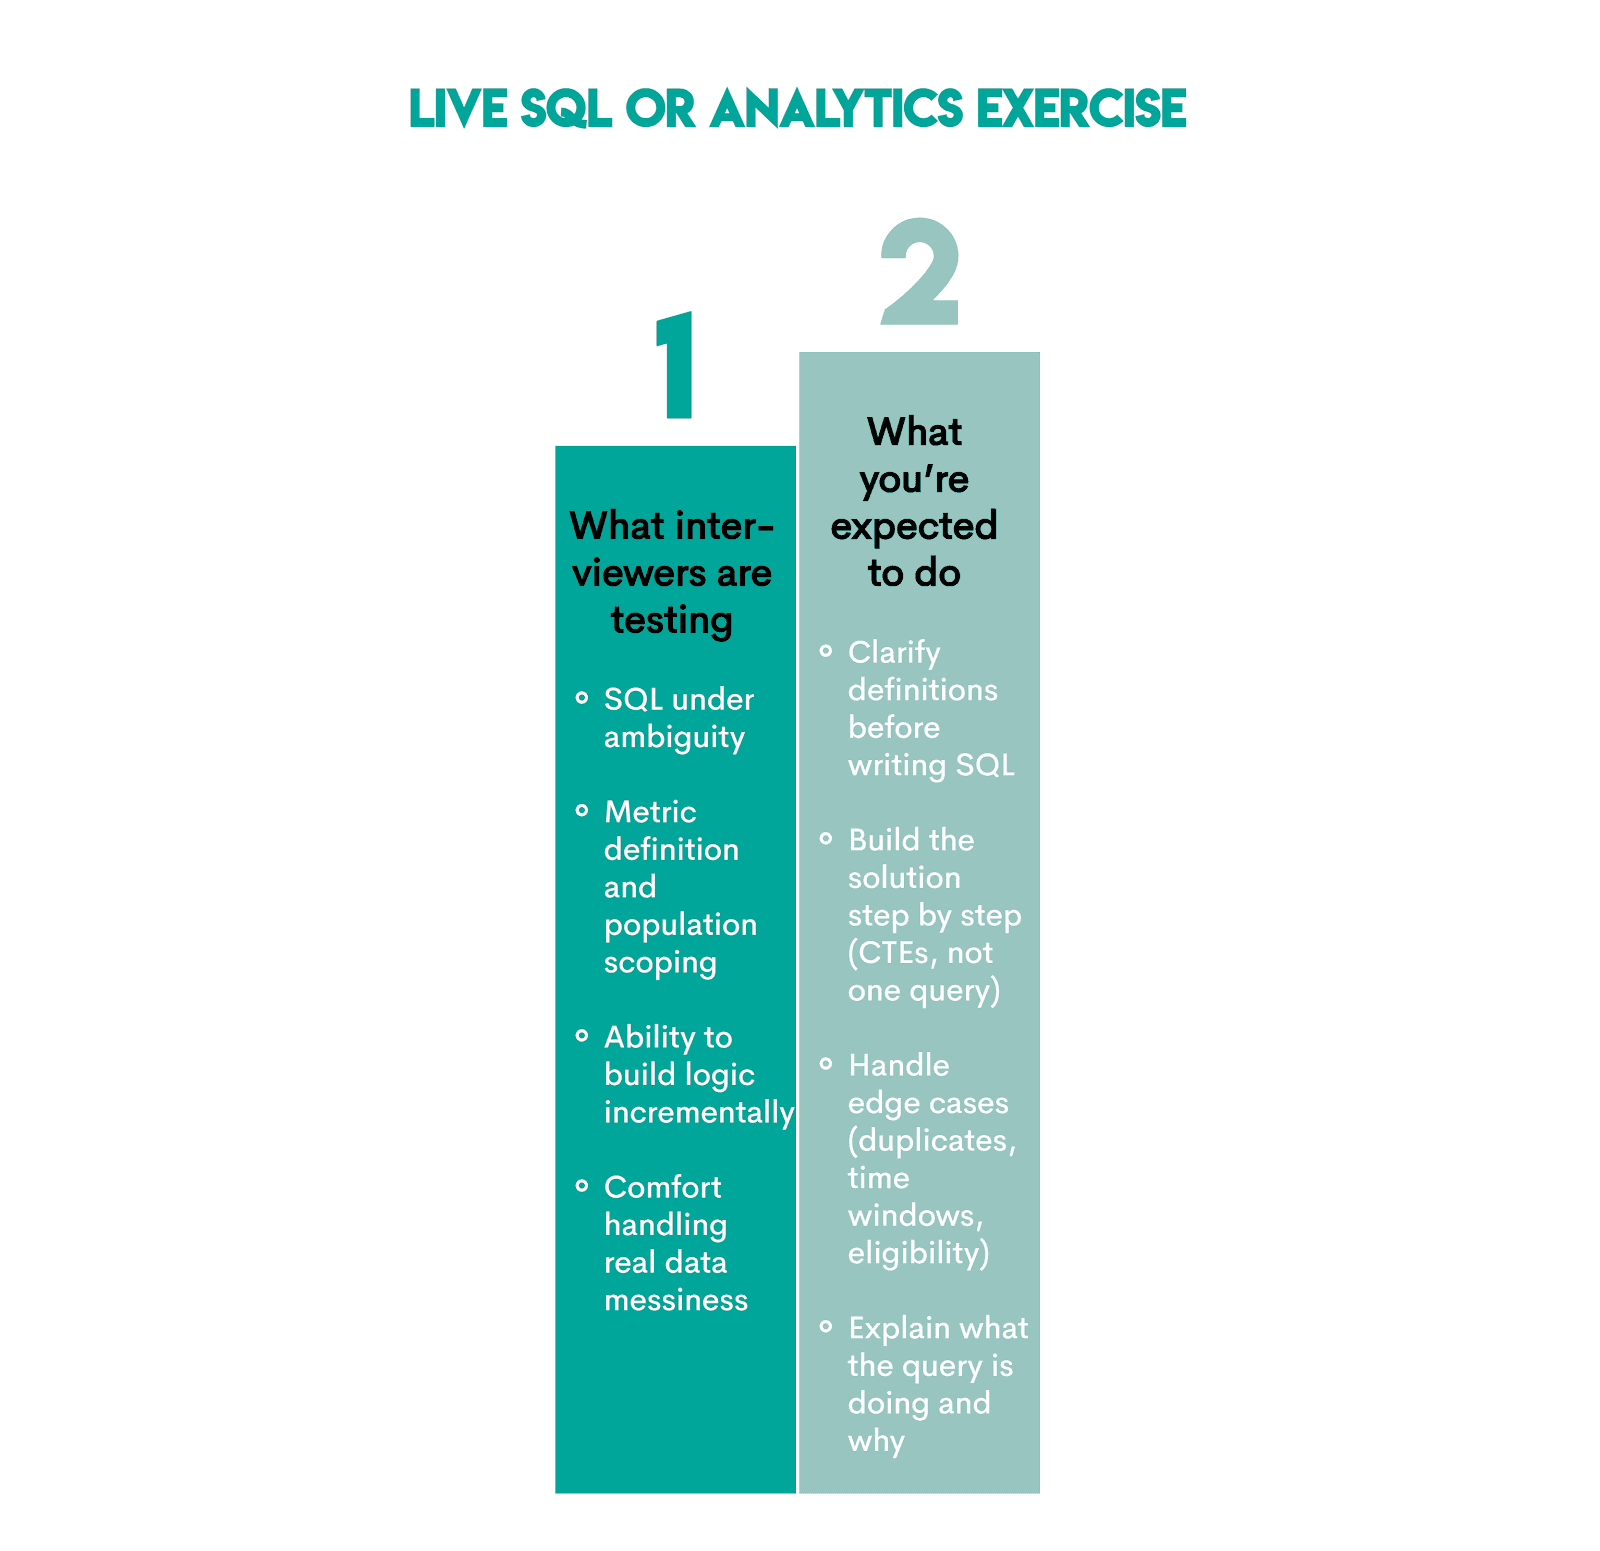
1. Live SQL or Analytics Exercise
This format means solving analytics problems in real time, often with incomplete or vague requirements. You expect questions along these lines:
- “Calculate Day 7 retention.”
- “Find where users drop in this funnel.”
- “Compare feature usage before and after the app launch.”
The idea behind this is to see if you can translate a vague business requirement into an exact SQL code.
Here’s an overview of what this format is testing and what you’re expected to do.
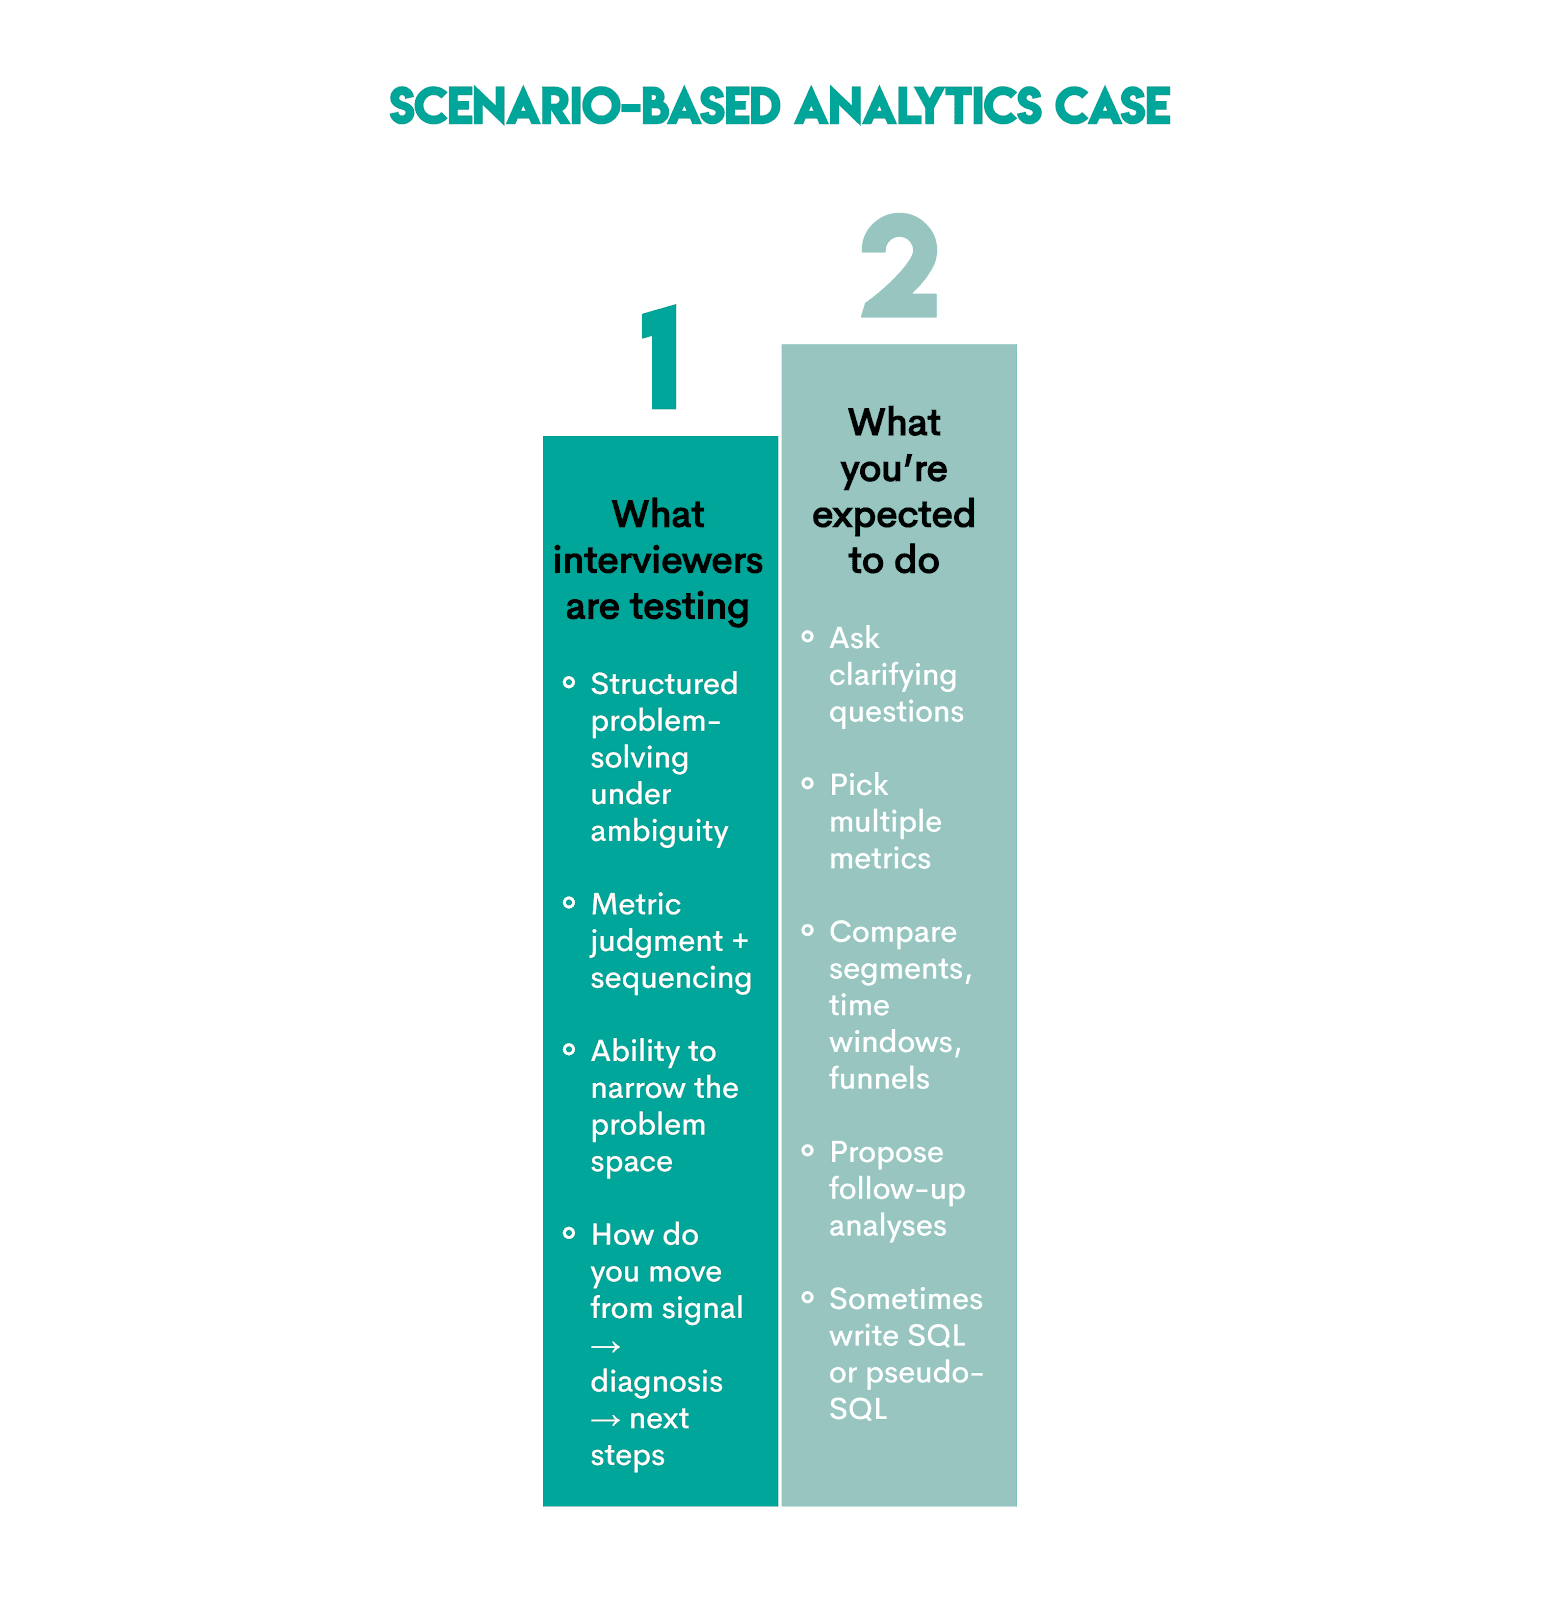
2. Scenario-Based Analytics Case
This is when you get a simulated product problem where something changed. Your task is to find out what and why. Typical questions sound like:
- “Retention dropped last week. Why?”
- “Checkout conversion declined, but traffic remained flat. Why?”
- “Engagement increased after a feature launch. Is that good or bad?”
By asking these questions, interviewers want to see if you can fix a real product issue using data.
Here’s what’s being tested and how to approach answering these questions.
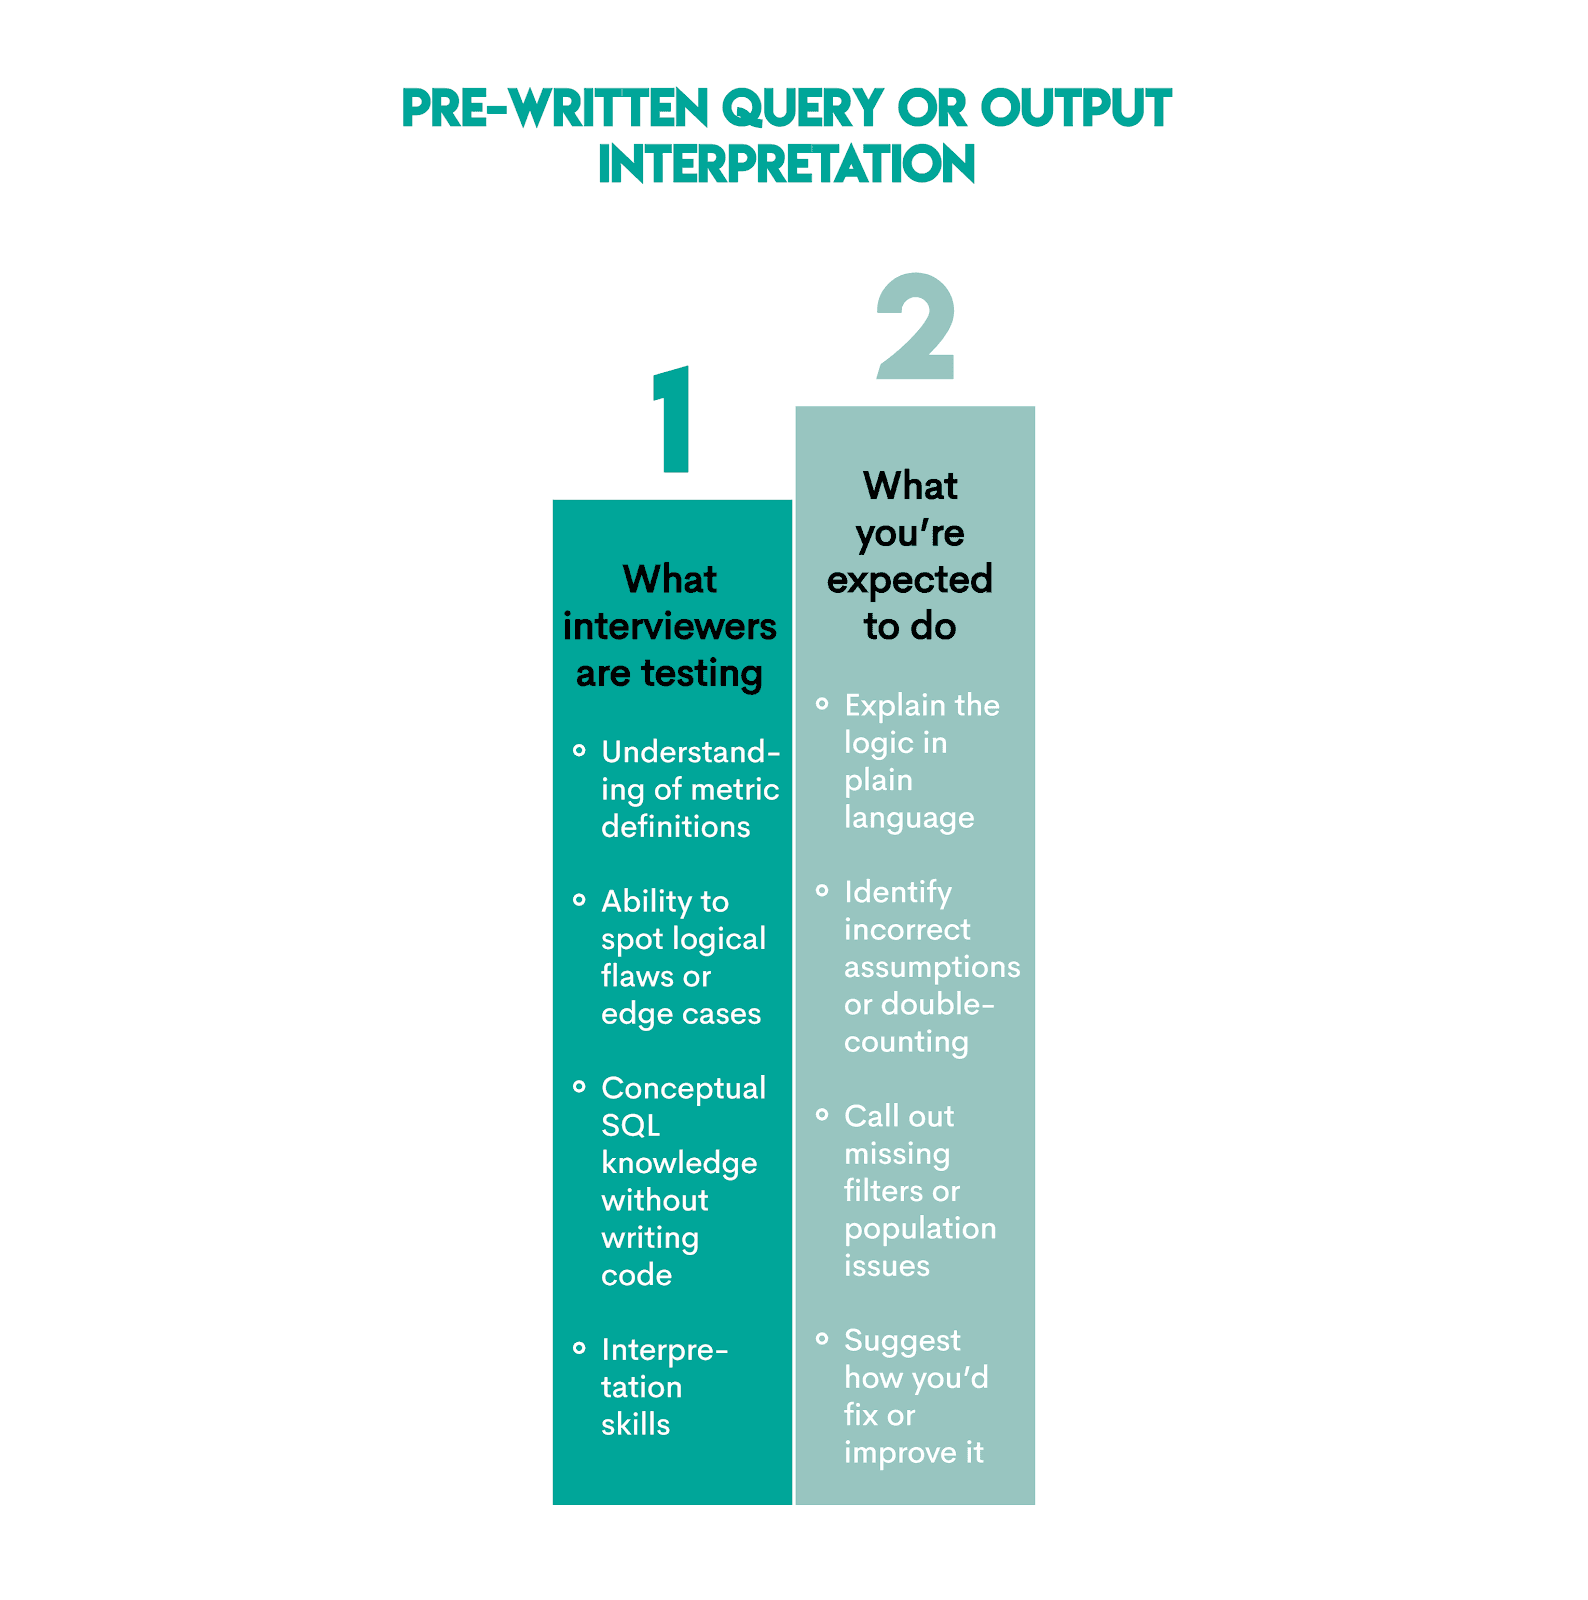
3. Pre-Written Query or Output Interpretation
These types of questions give an already written SQL query, table, or chart. You have to explain and critique it. Expect something along these lines:
- “What does this query calculate?”
- “Is this the right way to measure retention?”
- “What’s wrong with this metric definition?”
This is just another, reversed way of testing whether you understand the metrics behind the SQL.
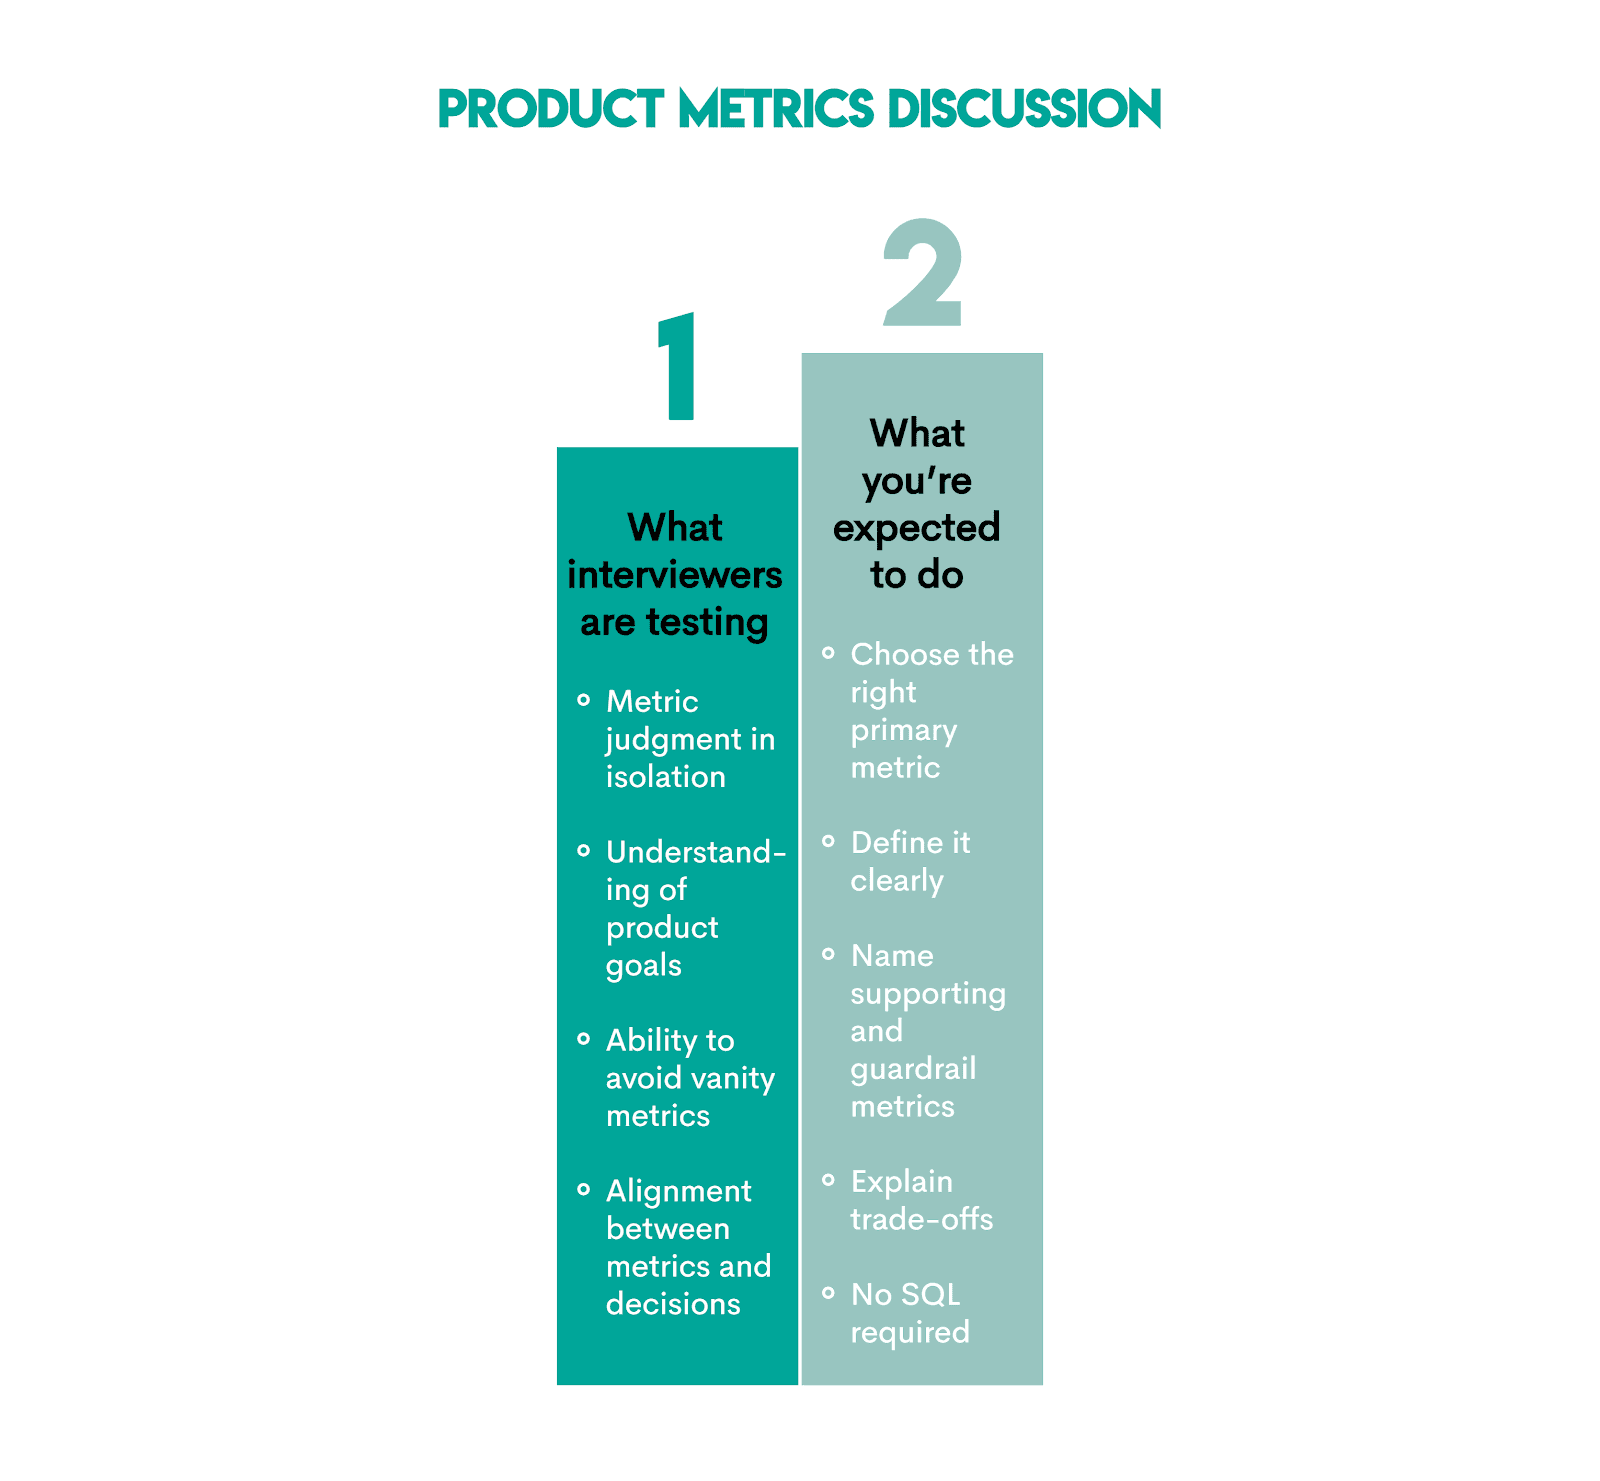
4. Product Metrics Discussion
These are conceptual discussions about what should be measured. Typically, you’ll be asked:
- “How would you measure success for this feature?”
- “What metrics matter most for this product?”
- “What would you track weekly as a PM?”
The interviewers want to see whether you understand what actually matters in the product analysis, even before looking at the data.
Here are more details on what's being tested and what you’re supposed to do.
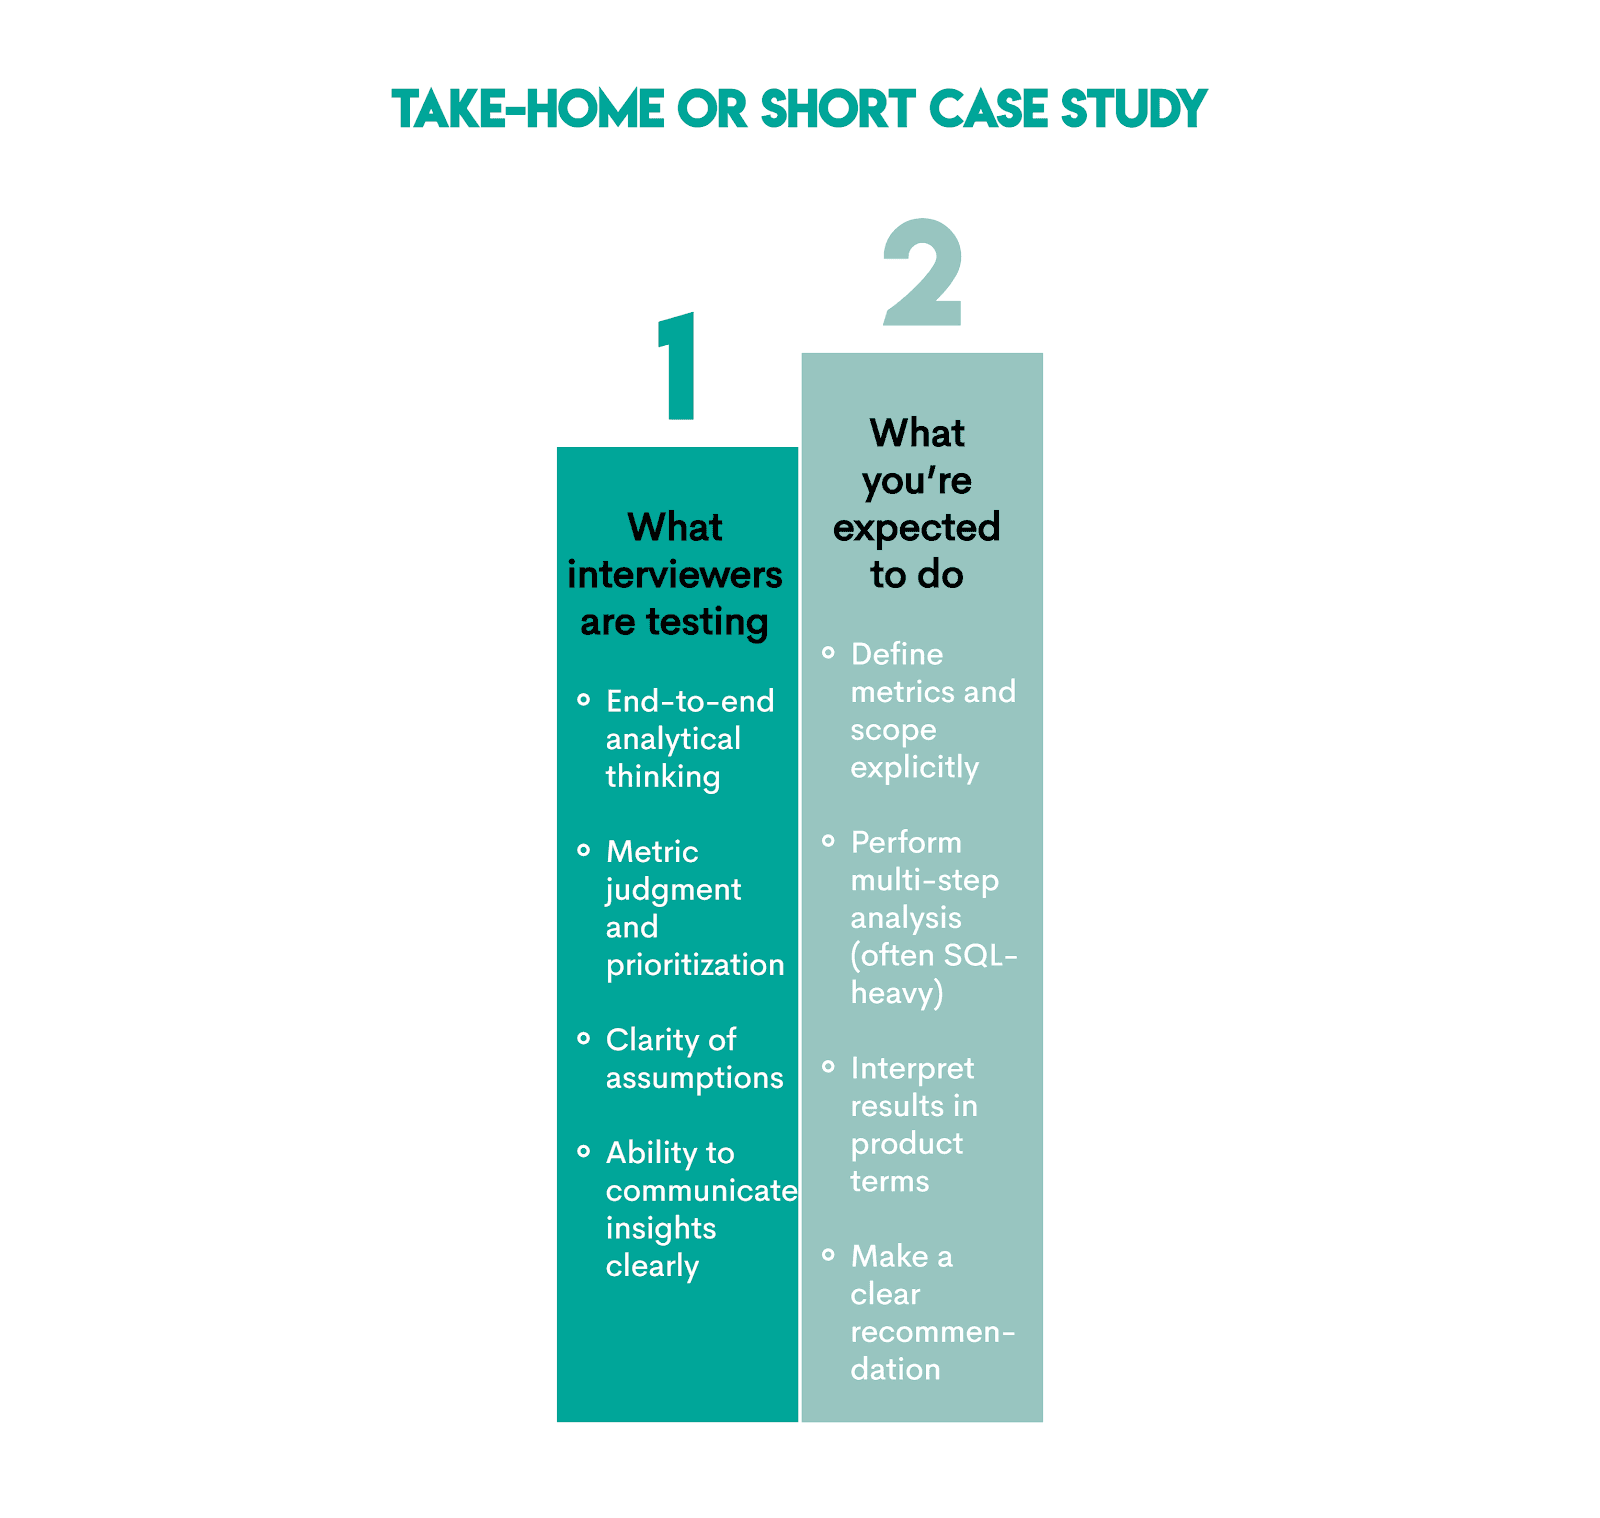
5. Take-Home or Short Case Study
This is an assignment completed outside the interview, hence the name. It’s a more elaborate analytics assignment than the single questions you get in the interview. You’re given a dataset, a problem statement, constraints, and are asked to provide a certain type of deliverable, e.g., SQL, slides, write-up, notebook, etc.
Typically, you’d be asked to:
- “Analyze this dataset and share insights.”
- “Evaluate the impact of this feature.”
- “Recommend what the team should do next.”
The idea behind this is to see if you can own a comprehensive analysis and turn it into a business decision.
All those interview formats and question types are typically spread across a few interview stages, usually at least those three:
- recruiter or HR screen
- hiring manager interview
- technical or analytics interview
However, this is largely irrelevant to your preparation for the product analyst interview; the same skills appear across all interview stages.
Product Analyst Interview Questions by Topic
The five interview question formats we presented above deal with how your knowledge is assessed. We’ll now focus on the “what” – topics tested and questions appearing in real product analyst interviews.
Core Product Metrics Questions
As their name suggests, these questions focus on product metrics. Typically, these are not coding questions.
Evaluation Criteria
When asking core product metrics questions, interviewers are not much interested in hearing a textbook definition of a specific metric.
Your answers to these interview questions should score highly on:
- Clarifying assumptions
- Matching metric to product goal
- Showing awareness of metric limitations
- Explaining why, not just what
Here are several examples of such questions.
Question #1: Returning User
Returning User
Last Updated: January 2022
What metrics can be used to determine if a certain user is a returning one?
How Should You Frame the Question?
On the surface, this question sounds like the interviewer is interested in a definition. Nope. There’s no textbook-prescribed metric that determines whether a user is returning or not.
The interviewer tests whether you understand that “returning” depends on product type, time horizon, and the definition of meaningful activity.
The framing of the question: “It depends on what we mean by returning and what the product is optimizing for.”
Trade-Offs & Decision Rules
Framing shows that you understand you could use different metrics depending on the returning user. Here are some examples.
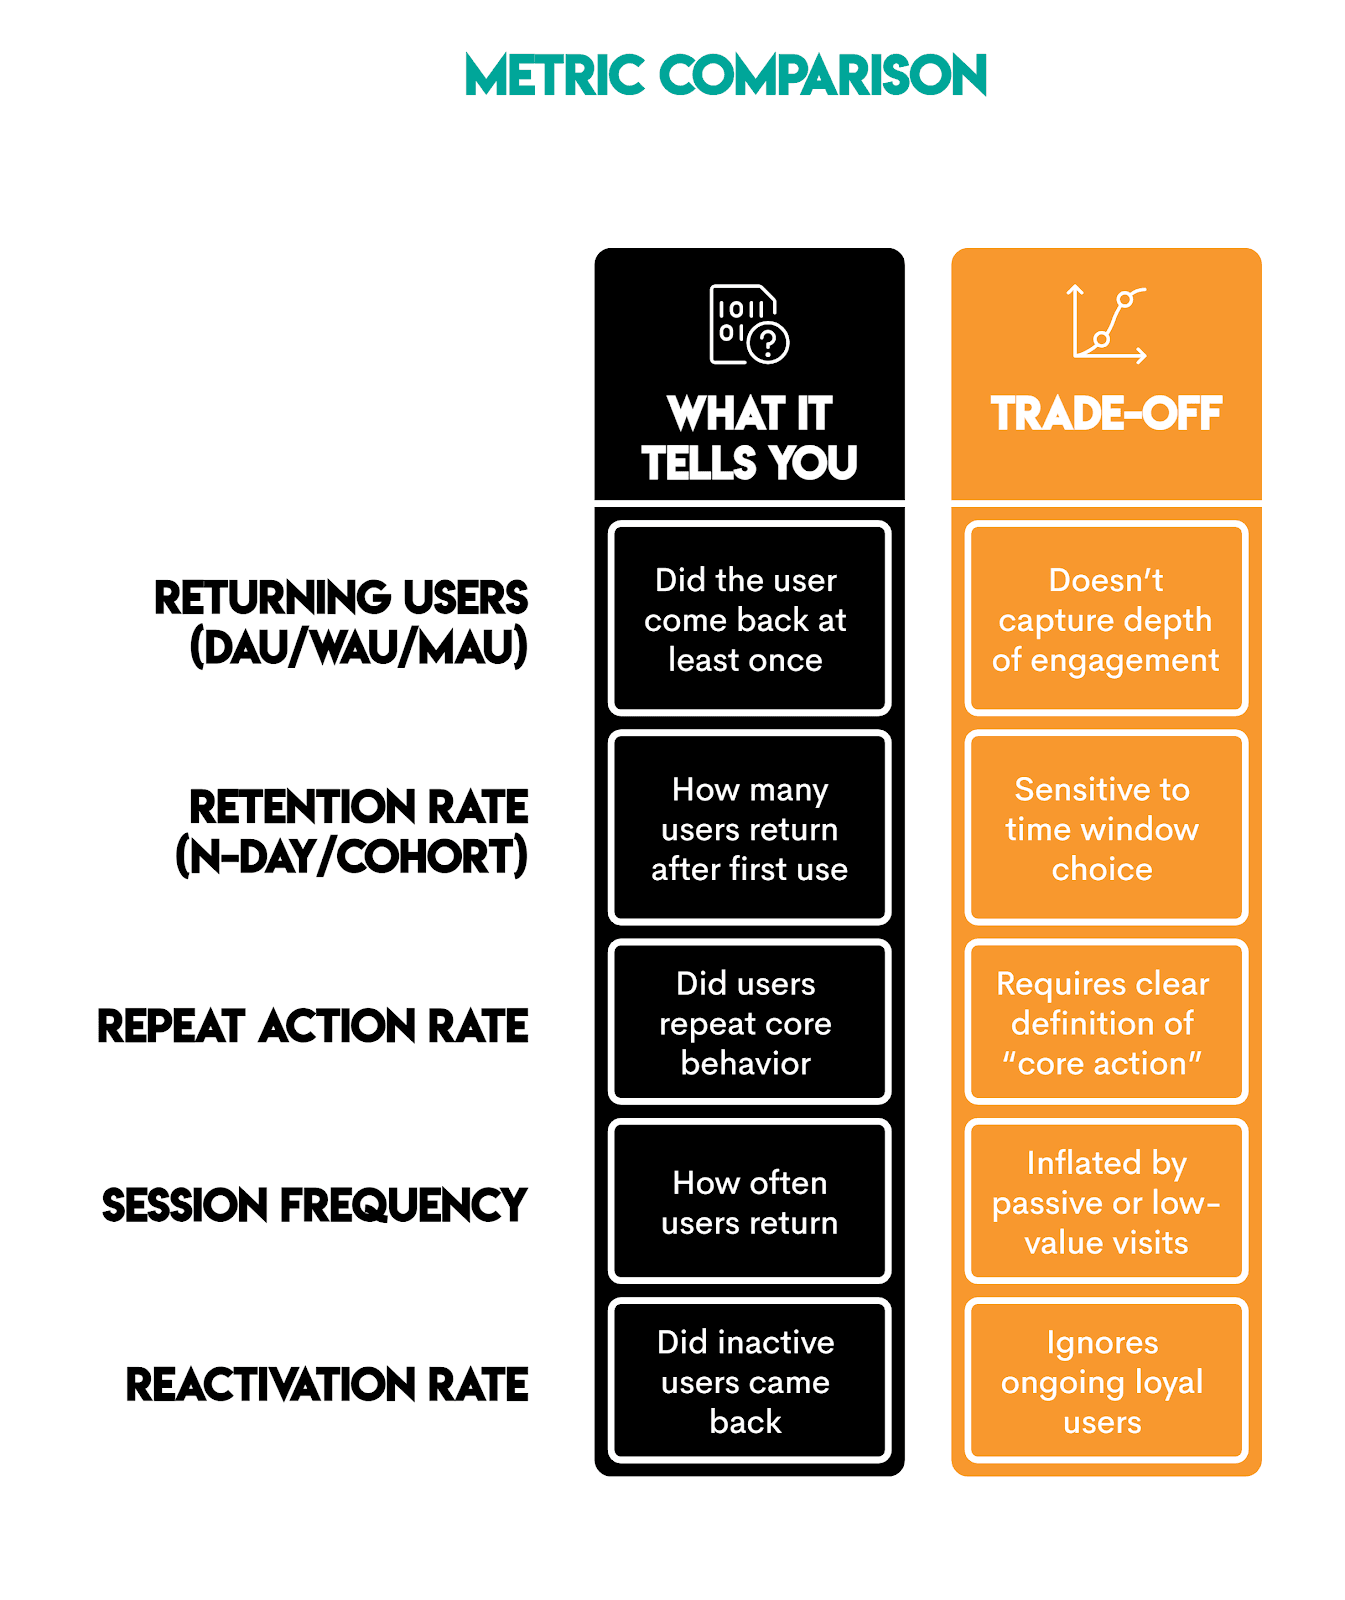
This part shows your understanding of which metric is suitable for what, and you state that explicitly in your answer:
- Use retention rate for product health
- Use repeat core action for value creation
- Use returning user counts for scale and growth tracking
Consider Edge Cases & Assumptions
A strong answer should consider edge cases and state assumptions.
For this particular case, you could call out edge cases such as:
- Cross-device users (identity resolution)
- Notification-drive opens
- Feed auto-refresh and preload
- Event-driven spikes (election, sports, crises)
- Passive consumption without interaction
Finally: Interview-Ready Answer
Following our own advice, a solid answer could read along these lines:
“I’d define a returning user as someone who comes back within a defined time window and performs a meaningful interaction, not just opens the app.
To measure this, I’d primarily use cohort-based retention tied to a core action, and pair it with the repeat core action rate to confirm users are returning with intent.
Cohort retention tells me whether users come back after the first value.
Repeat core action helps validate that the return reflects real engagement rather than notification-driven opens.”
Typical Follow-Ups
A strong answer would take into consideration the possible follow-ups, and cover most of the basic ones, such as:
- “Returning within what time window?”
- “Does opening the app count as returning?”
- “Which particular metric would you actually use?”
As you’ve already covered that, you’d probably get the more probing questions, such as:
- “What’s the core action here?”
Pro tip: Commenting/sharing on Facebook, saving/replying on Instagram, sending messages on WhatsApp
- “What retention window would you choose?”
Pro tip: Start with Day-7 or Week-1 retention for high-frequency Meta products; captures habitual return without over-counting noise
- “Why cohort retention instead of DAU/WAU?”
Pro tip: Cohort retention isolates true return behavior, DAU/WAU mixes acquisition and engagement
- “How would you validate that notification-driven opens aren’t inflating this?”
Pro tip: Compare interaction depth and downstream actions for notification-driven return vs. organic return that confirms intent.
- “Would this definition change across Meta products?”
Pro tip: The core action changes, the logic stays the same, i.e., the value-creating interaction.
- “What would make you distrust this metric?”
Pro tip: For example, if retention increases without a corresponding increase in meaningful interactions or downstream engagement.
Using a similar approach, try answering the following questions.
Question #2: New Users Engagement
New Users Engagement
Last Updated: May 2022
How would you evaluate the engagement of the new users? Clearly define the metrics and KPIs that you would use.
Question #3: Customer Engagement and Disengagement
Customer Engagement and Disengagement
Last Updated: July 2022
How do you measure customer engagement and disengagement?
Question #4: Health of Groups
Health of Groups
Last Updated: October 2021
How would you determine the health of a Meta/Facebook Group?
Question #5: Ad Success Metrics
Ad Success Metrics
Last Updated: September 2021
What metrics would you use to measure the success of an Instagram ad?
Retention & Churn SQL Interview Questions
These questions focus on testing how well you reason about retention and churn metrics, and whether you can calculate them in SQL.
Question #6: Churn Rate Of Lyft Drivers
Churn Rate Of Lyft Drivers
Calculate the overall churn rate for Lyft drivers across all years in the dataset. Churn is defined as the percentage of drivers who have stopped driving for Lyft, as indicated by a recorded end_date in the lyft_drivers table. In your answer, express the churn rate as a ratio, instead of a percentage. For example, 0.1 instead of 10%.
Here’s the dataset preview.
What This Question Really Asks?
On the surface, the problem looks like a simple aggregation. If you think that, you’ve fallen for a trick. Interviewers like to ask deceptively simple questions, but what they’re actually testing here is:
- Translating a business definition of churn into SQL
- Choosing the correct denominator for a rate
- Numeric precision
Metric Decision Rule
Global churn is explicitly defined in the question as “the percentage of drivers who have stopped driving for Lyft, as indicated by a recorded end_date in the lyft_drivers table.”
The decision you need to make is what data you must use to calculate it:
- Numerator – count of churned drivers, i.e., whose
end_dateis non-NULL - Denominator – count of all drivers
Solution Walkthrough
The code below does the following:
- Identifies churned drivers:
end_date IS NOT NULL - Counts churned drivers:
COUNT()with CASE WHEN Statement - Divide by total drivers:
COUNT(*) - Cast to decimal: prevents integer division
The output shows the churn rate of 0.5.
| global_churn_rate |
|---|
| 0.5 |
We chose this approach because:
- It makes the churn calculation logic obvious
- Usually more efficient (or at least no worse) than the
WHERE + subqueryapproach (Alternative solution 1) - More generalizable if the question evolves into churn by country/acquisition channel/cohort/month; just add the grouping column in
SELECTand GROUP BY
Alternative solution 1: WHERE + subquery
Aside from lacking all the pros of the official approach, this solution is, in addition, easier to break if someone edits the query. For example, by removing WHERE end_date IS NOT NULL.
Alternative solution 2: COUNT(end_date)
This is the simplest solution, simpler even than our official solution. COUNT(end_date) counts only non-NULL values, so the conditional logic is not needed.
Use this when churn is exactly “non-NULL end_date”. Use conditional aggregation (the official solution) when you want the most robust pattern that survives potential changes.
How Do You Know Your Solution is Correct?
You don’t, but there are some sanity checks you could perform to be 99% sure.
- Does
COUNT(*)equal the number of drivers? - Confirm
end_dateis populated only for churned drivers - Is the ratio between 0 and 1?
Common Mistakes & Avoiding Them
Here are several mistakes this question tries to force you into making.
Mistake 1: Dividing without casting
This mistake results in integer division, which silently truncates the result. In other words, even though your calculation is nominally correct, you’ll get incorrect output.
See for yourself by running the code without casting.
Keep in mind you must cast/convert to decimal either the numerator or the denominator.
Mistake 2: Grouping by year
Some of you think this code calculates what the interviewer wants.
Be careful, because the question asks for overall churn across all years, not time-based churn.
Assumptions & Edge Cases
The edge cases to consider when writing the solution could be:
- Drivers who leave can return later
- Multiple rows per driver
- Soft churn without an
end_date
No need to write the solution to take this into account. The important thing is to know that these edge cases could break your code, so be prepared to extend your solution if the interviewer asks you to.
Now that you’re familiar with the return and churn questions, solve some other similar examples.
Question #7: Monthly Churn Rate
Monthly Churn Rate
Last Updated: November 2021
Calculate the churn rate of September 2021 in percentages. The churn rate is the difference between the number of customers on the first day of the month and on the last day of the month, divided by the number of customers on the first day of a month. Assume that if customer's contract_end is NULL, their contract is still active. Additionally, if a customer started or finished their contract on a certain day, they should still be counted as a customer on that day.
Use this dataset.
Write and check your solution in the code editor.
Question #8: First Day Retention Rate
First Day Retention Rate
Last Updated: February 2022
Calculate the first-day retention rate of a group of video game players. The first-day retention occurs when a player logs in 1 day after their first-ever log-in. Return the proportion of players who meet this definition divided by the total number of players.
Use this dataset.
Write and check your solution in the code editor.
Question #9: Retention Rate
Retention Rate
Last Updated: July 2021
You are given a dataset that tracks user activity. The dataset includes information about the date of user activity, the account_id associated with the activity, and the user_id of the user performing the activity. Each row in the dataset represents a user’s activity on a specific date for a particular account_id.
Your task is to calculate the monthly retention rate for users for each account_id for December 2020 and January 2021. The retention rate is defined as the percentage of users active in a given month who have activity in any future month.
For instance, a user is considered retained for December 2020 if they have activity in December 2020 and any subsequent month (e.g., January 2021 or later). Similarly, a user is retained for January 2021 if they have activity in January 2021 and any later month (e.g., February 2021 or later).
The final output should include the account_id and the ratio of the retention rate in January 2021 to the retention rate in December 2020 for each account_id. If there are no users retained in December 2020, the retention rate ratio should be set to 0.
Use this dataset.
Write and check your solution in the code editor.
Cohort Analysis Interview Questions (Multi-Step SQL)
These questions focus on tracking behavior over time relative to an anchor event, such as a signup or first purchase. They are typically multi-step SQL questions, so they also test whether you can break a complex problem into sequential steps and keep the correct grain in each step when tracking behavior over time relative to an anchor event.
Question #10: Finding User Purchases
Finding User Purchases
Last Updated: December 2020
Identify returning active users by finding users who made a second purchase within 1 to 7 days after their first purchase. Ignore same-day purchases. Output a list of these user_ids.
Here’s the dataset preview.
The Grain Interviewers Are Checking
In this question, there are four grains interviewers want to see you control:
- Raw data grain (
user_id + created_at (timestamp)): There are multiple rows per user, possibly multiple purchases per day. This grain is not suitable for finding first and second purchases. - Normalized activity grain (
user_id + purchase_date): This grain creates a stable unit for sequencing, as it collapses multiple same-day purchases. - User-sequence grain (
user_id + ordered purchase index): This grain uses theROW_NUMBER()window function to add order without changing row count, and makes the first and second orders explicit - Output grain (
user_id): Here, each user appears at most once.
Solution Walkthrough
We’ll use CTEs to write clean code, with the sequential steps easy to understand.
- CTE
daily: Sets the event grain that ignores same-day purchases - CTE
ranked: Defines first vs second order per user - CTE
first_two: Collapse to one row per user with the first two dates - Final
SELECT: Apply the business rule window (second purchase is 1-7 days after the first)
Here’s the code.
Why This Solution Approach?
Alternative approach #1: The question that’s probably surfacing is: “Can I use RANK() or DENSE_RANK() instead of ROW_NUMBER()?”
The short answer is: Yes.
The long(er) answer is: Using RANK(), or DENSE_RANK() doesn’t achieve anything. Those functions are designed to handle ties. However, we already removed ties in the daily CTE. So, you could use RANK() or DENSE_RANK(), but it’s unnecessary.
Alternative approach #2: Giving the official solution we’ve shown above should satisfy your interviewer. Why shouldn’t it? The answer makes the first vs second order explicit, it’s robust and portable, and all the grains are in check.
However, you might get asked to optimize that code. Of course, it’s possible to do it. The idea is to use LEAD(), and you’ll end up with only two CTEs instead of three.
The first CTE is identical. The second CTE is slightly tweaked by adding LEAD() to get the second purchase date. The third CTE you don’t need anymore.
Final SELECT also stays the same.
Common Mistakes
This question, like all the questions, wants to force you into making mistakes. Here’s what to look out for:
- Using
COUNT(*) >= 2instead of identifying the first and second purchase - Applying the 1-7 day filter before determining the purchase order
- Forgetting to deduplicate same-day purchases
- Returning multiple rows per user instead of a user-level result
Now, try to solve several more multi-step cohort analysis questions.
Question #11: User Activity Analysis
User Activity Analysis
Last Updated: November 2024
Identify users who have logged at least one activity within 30 days of their registration date.
Your output should include the user’s ID, registration date, and a count of the number of activities logged within that 30-day period.
Do not include users who did not perform any activity within this 30-day period.
Use this dataset.
Write and check your solution in the code editor.
Question #12: Premium Accounts
Premium Accounts
Last Updated: March 2022
You have a dataset that records daily active users for each premium account. A premium account appears in the data every day as long as it remains premium. However, some premium accounts may be temporarily discounted, meaning they are not actively paying — this is indicated by a final_price of 0.
For each date, count the number of premium accounts that were actively paying on that day. Then, track how many of those same accounts are still premium and actively paying exactly 7 days later, if that later date exists in the dataset. Return results for the first 7 dates in the dataset.
Output three columns: • The date of initial calculation. • The number of premium accounts that were actively paying on that day. • The number of those accounts that remain premium and are still paying after 7 days.
Use this dataset.
Write and check your solution in the code editor.
Question #13: Consecutive Days
Consecutive Days
Last Updated: July 2021
Find all the users who were active for 3 consecutive days or more.
Use this dataset.
Write and check your solution in the code editor.
Question #14: User Streaks
User Streaks
Last Updated: October 2022
Provided a table with user ID and the dates they visited the platform, find the top 3 users with the longest continuous streak of visiting the platform up to August 10, 2022. Output the user ID and the length of the streak.
In case of a tie, display all users with the top three longest streak lengths.
Use this dataset.
Write and check your solution in the code editor.
Question #15: New And Existing Users
New And Existing Users
Last Updated: March 2021
Calculate the share of new and existing users for each month in the table. Output the month, share of new users, and share of existing users as a ratio.
New users are defined as users who started using services in the current month (there is no usage history in previous months). Existing users are users who used services in the current month, and who also used services in any prior month of 2020.
Assume that the dates are all from the year 2020 and that users are contained in user_id column.
Use this dataset.
Write and check your solution in the code editor.
Funnel & Activation SQL Interview Questions
These questions test your ability to construct correct metrics from event-level data. You have to define populations consistently, manage intermediate steps without changing the unit of analysis, and, finally, compute the metrics correctly.
Question #16: SMS Confirmations From Users
SMS Confirmations From Users
Last Updated: November 2020
Meta/Facebook sends SMS texts when users attempt 2FA (two-factor authentication) to log in. The fb_sms_sends table logs all SMS texts sent by the system.
However, due to an ETL issue, this table contains some invalid entries, specifically, rows where type = 'confirmation' or other unrelated message types (like friend requests). These records should be ignored.
Only rows with type = 'message' represent actual 2FA texts that were sent to users.
Use the fb_confirmers table to identify which of these messages were successfully confirmed by users.
Calculate the percentage of confirmed SMS 2FA messages (where type = 'message') sent on August 4, 2020.
We’ll work with two tables. The first one is fb_sms_sends.
The second table is fb_confirmers.
Decisions to Make
This question is pretty explicit in its requirements and definitions, so there’s not that much for you to decide. The goal here is for the interviewer to see if you can follow clear instructions and translate them into code.
However, that doesn’t mean that you have no decisions to make. They may be few, but they’re still very important.
- Define the metric: confirmed messages (those with
type = message)/total number of messages sent - Type of join: You should use
LEFT JOINfromfb_sms_sendstofb_confirmers, which will keep the unconfirmed sends in the denominator. If you useINNER JOIN, the result will always be 100%, as you literally calculate “confirmation share among confirmed records.”
Solution Walkthrough
Here’s what the code below does.
- Defines the metric:
COUNT(b.phone_number)::FLOAT/COUNT(a.phone_number) * 100 AS perc - Sets the denominator grain: Rows in
fb_sms_sendson2020-08-04withtype = 'message'; each row corresponds to one SMS sent. - Choose the join type:
LEFT JOINto keep the unconfirmed messages in the dataset.
Here’s what the full code looks like.
Here’s the output showing the metric is 20%.
| perc |
|---|
| 20 |
Calling Out Edge Cases
The data we’re using is pretty straightforward and clean. You can expect to get a little trickier data, so you should call out edge cases and check with the interviewer if you should account for them.
Possible edge cases are:
- Multiple sends to the same phone number on the same day (denominator is per send, not per user).
- Multiple confirmer rows per phone/date (needs deduping if table isn’t unique).
- Confirmation with no send record (should not count, as you anchor on sends).
NULLphone number (these should probably be excluded, but you should check).
Follow-Ups To Expect
After providing the above solution, be ready to give some additional explanations:
- “Why
LEFT JOIN, and notINNER JOIN?” - “What exactly counts as ‘sent’ vs ‘confirmed’?”
- “How do you know ETL junk isn’t inflating/deflating the metric?”
- “What happens if a phone number confirms without a second record?”
Question #17: Same-Day Orders
Same-Day Orders
Last Updated: November 2024
Identify users who started a session and placed an order on the same day.
For these users, return the total number of orders placed on that day and the total order value for that day.
Your output should include the user_id, the session_date, the total number of orders, and the total order value for that day.
Use this dataset.
Write and check your solution in the code editor.
Question #18: Acceptance Rate By Date
Acceptance Rate By Date
Last Updated: November 2020
Calculate the friend acceptance rate for each date when friend requests were sent. A request is sent if action = sent and accepted if action = accepted. If a request is not accepted, there is no record of it being accepted in the table.
The output will only include dates where requests were sent and at least one of them was accepted (acceptance can occur on any date after the request is sent).
Use this dataset.
Write and check your solution in the code editor.
Question #19: Marketing Campaign Success
Marketing Campaign Success [Advanced]
You have the marketing_campaign table, which records in-app purchases by users. Users making their first in-app purchase enter a marketing campaign, where they see call-to-actions for more purchases. Find how many users made additional purchases due to the campaign's success.
The campaign starts one day after the first purchase. Users with only one or multiple purchases on the first day do not count, nor do users who later buy only the same products from their first day.
Use this dataset.
Write and check your solution in the code editor.
Feature Impact & Experimentation Questions
These questions are all about reasoning about cause and effect between product changes and outcomes. They probe your understanding of how metrics interact (hypothetically) and how an observed change could (or should) be validated or tested.
Let’s see what feature impact and experimentation questions involve.
Question #20: Graph of Sales and Revenue
Graph of Sales and Revenue
Last Updated: May 2022
You are given a graph presenting changes in sales and revenue over time. You can see that while the revenue graph looks like a U-shaped parabola (first decreases and then increases), the graph of the number of sold units has a shape of an inverted letter U (first increases, then decreases). Explain to a stakeholder why the graph looks like that.
What the Interviewers Want To See
We classified this as an easy question, but it still requires you to think. That’s what the interviewers are most interested in. In a bit more detail, they want to see you:
- Understand that revenue = price x quantity
- Explain opposing trends
- Explain trade-offs in plain language
Interview-Ready Answer
The two graphs show how price impacts demand and revenue.
“The product prices were probably decreased first. That made the product more affordable, so the units sold increased. However, this had a negative effect on revenue; despite the increased demand, sales generated less revenue due to the price decrease.
Later on, prices increased. This had an opposite effect: number of units sold decreased, but the higher price more than offset the lower volume, so the revenue went up.”
Typical Follow-Ups
The answer I gave above would get you high scores on the correct intuition marks. However, some interviewers might be interested – after establishing the base point of you making sense – in your reasoning about causality, evidence, and decision.
They would probably ask at least one of these questions. (The idea is not to memorize the answers, so the “answers” in brackets are only suggestions that should give you the idea of different directions you could take in answering the additional questions.)
#1: “How do you know price is the driver?”
(You’d want to check price history, discounts, and promotions. Probably segment by time, cohort, or campaign. Compare metrics – average selling price, units sold, revenue – pre and post price change. That’s all to confirm whether price is the driver or not.)
In short, sales volume peaked when prices were low, and revenue peaked when prices rose.
#2: “What else could cause this pattern?”
(Possibly: mix shifts (enterprise vs retail), bundling or packaging changes, channel effects, external demand shocks.)
#3: “What would you do next?”
(You’d want to suggest A/B pricing tests, price elasticity analysis, holding quality/features constant, monitoring retention and lifetime value, not just revenue.)
#4: “Which metric would you prioritize when deciding what to do next?”
(The metric changes depend on the goal. If you want a decision about prices, you could use revenue per user (RPU), average selling price (ASP), units sold, conversion rate, gross margin. If the goal is a growth vs monetization trade-off, use revenue growth rate or unit growth rate. Prioritizing long-term business health? Use customer lifetime value (LTV), retention, churn, repeat purchase rate, cohort revenue over time.)
Now try to solve a couple more problems.
Question #21: A/B Testing a Campaign
A/B Testing a Campaign
Last Updated: January 2022
Robinhood wants to encourage more people to create an account and plans a campaign where they would give out a few free stocks to new users. Describe in detail how would you implement an A/B test to determine the success of this campaign.
Question #22: Cities with Higher or Lower Demand
Cities with Higher or Lower Demand
Last Updated: February 2022
Lyft offers ride-sharing services in over 640 cities in the United States. In what way and using which metrics would you detect a city with the current demand significantly higher or lower than the average?
Multi-Step SQL Case Questions (Real Interview Prompts)
These are (relatively similar) to multi-step cohort analysis SQL questions in that they, too, test how you decompose business problems into a logical sequence of query steps. However, the problems in this case are more open-ended, simulating the actual requests you’ll get at your job: procedural, not formulaic prompts (you decide what to do in what order), and you have to decompose the actual problem.
Now, to examples.
Question #23: Rank Variance Per Country
Estimating Birthdays
Last Updated: January 2019
We at Meta/Facebook would like to develop a way to estimate the month and day of people's birthdays, regardless of whether people give us that information directly. What methods would you propose, and data would you use, to help with that task?
The question gives you two tables. Here’s the fb_comments_count table.
Here’s the fb_active_users table.
What Does It Want?
Despite the word “rank” in the question title and the extensive use of DENSE_RANK() in the solution, this question is not about ranking. At least, it’s not only about that.
The output depends on chaining intermediate results correctly, and that’s what this question is about: the procedure. Specifically, it tests:
- Decomposition skills: how you turn the problem into a sequence of transformations (monthly totals -> ranks -> deltas)
- Grain discipline skills: keeping one row, meaning one thing, as you move from events -> country-month -> country
Decisions & Trade-Offs
There are three main decisions you have to make here.
- Aggregating before ranking: You can’t rank countries until each country has a single total per month.
- Using
DENSE_RANK(): The question says “Countries with the same total should share the same rank, and the next rank should increase by one (without skipping numbers).”, which means usingDENSE_RANK()when ranking, notRANK()(the latter skips ranks). - Comparing ranks on aligned grains: The comparison must be at
country(one row per country with December & January ranks), not at the comment-event level.
Solution Walkthrough
Here’s what the solution does.
CTE monthly_comments: Joins the tables to get country, limits comments to those from 2019-12-01 inclusive to 2020-02-01 exclusive in WHERE and sums them. The result is one row per country per month with the total number of comments.
WITH monthly_comments AS
  (SELECT u.country,
          date_trunc('month', c.created_at)::date AS month_start,
          SUM(c.number_of_comments) AS total_comments
   FROM fb_comments_count AS c
   JOIN fb_active_users AS u ON c.user_id = u.user_id
   WHERE c.created_at >= '2019-12-01'
     AND c.created_at < '2020-02-01'
   GROUP BY u.country,
            date_trunc('month', c.created_at)::date),
CTEs december & january: We split two months into two separate datasets showing country and total_comments.
december AS
  (SELECT country,
          total_comments
   FROM monthly_comments
   WHERE month_start = '2019-12-01'),

january AS
  (SELECT country,
          total_comments
   FROM monthly_comments
   WHERE month_start = '2020-01-01'),
CTEs december_rank & january_rank: We rank countries within each month by total_comments DESC using DENSE_RANK().
december_rank AS
  (SELECT country,
          total_comments,
          DENSE_RANK() OVER (ORDER BY total_comments DESC) AS dec_rank
   FROM december),

january_rank AS
  (SELECT country,
          total_comments,
          DENSE_RANK() OVER (
                             ORDER BY total_comments DESC) AS jan_rank
   FROM january),
CTE rank_compare: Joins the december_rank and january_rank CTEs, producing one row per country with both December 2019 and January 2020 ranks.
rank_compare AS
  (SELECT d.country,
          d.dec_rank,
          j.jan_rank,
          d.total_comments AS dec_comments,
          j.total_comments AS jan_comments
   FROM december_rank d
   JOIN january_rank j USING (country))
Final SELECT: Here, we keep countries whose ranking improved (dec_rank > jan_rank) and sort the output from the lowest rank number (highest rank) to the highest rank number (lowest rank).
rank_compare AS
SELECT country
FROM rank_compare
WHERE dec_rank > jan_rank
ORDER BY dec_rank;
Here’s the whole code.
Avoiding Typical Mistakes
When solving that question, try not to fall into one of its traps.
- Using
RANK()instead ofDENSE RANK(): This will cause ties to be skipped, hence the result will be incomplete/incorrect. - Incorrect data filtering: Using
created_at <= '2020-01-31'instead ofcreated_at < '2020-02-01'could miss or duplicate edge dates, depending on the data. Not in the case of our data, as the columncreated_atshows dates. But if it were a timestamp, SQL would treatcreated_at <= '2020-01-31'as a timestamp at midnight, excluding other events the rest of'2020-01-31'. At interviews, you often don’t control the schema, so it’s safer to use half-open ranges, as in the solution, to capture full months without boundary bugs. - Ranking across the entire dataset: That’s not going to work. You need a separate ranking for each month, not a single global rank.
Here are several other questions of the same type.
Question #24: Player with Longest Streak
Player with Longest Streak
Last Updated: September 2021
You are given a table of tennis players and their matches that they could either win (W) or lose (L). Find the longest streak of wins. A streak is a set of consecutive won matches of one player. The streak ends once a player loses their next match.
For this question, disregard edge cases such as: players who never lose, streaks that start before the first loss, and streaks that continue after the final match.
Use this dataset.
Write and check your solution in the code editor.
Question #25: Google Fit User Tracking
Google Fit User Tracking
Find the average session distance travelled by Google Fit users based on GPS location data. Calculate the distance for two scenarios:
- Taking into consideration the curvature of the earth
- Taking into consideration the curvature of the earth as a flat surface
Assume one session distance is the distance between the biggest and the smallest step. If the session has only one step id, discard it from the calculation. Assume that session can't span over multiple days. Output the average session distances calculated in the two scenarios and the difference between them.
Formula to calculate the distance with the curvature of the earth:
Formula to calculate distance on a flat surface:
Use this dataset.
Write and check your solution in the code editor.
Question #26: Fans vs Opposition
Fans vs Opposition
Last Updated: March 2020
Meta/Facebook is quite keen on pushing their new programming language Hack to all their offices. They ran a survey to quantify the popularity of the language and send it to their employees. To promote Hack they have decided to pair developers which love Hack with the ones who hate it so the fans can convert the opposition. Their pair criteria is to match the biggest fan with biggest opposition, second biggest fan with second biggest opposition, and so on. Write a query which returns this pairing. Output employee ids of paired employees. Sort users with the same popularity value by id in ascending order.
Duplicates in pairings can be left in the solution. For example, (2, 3) and (3, 2) should both be in the solution.
Use this dataset.
Write and check your solution in the code editor.
Question #27: Average Time Between Steps
Average Time Between Steps
Facebook wants to understand the average time users take to perform certain activities in a feature. User activity is captured in the column step_reached.
Calculate the average time it takes for users to progress through the steps of each feature. Your approach should first calculate the average time it takes for each user to progress through their steps within the feature. Then, calculate the feature's average progression time by taking the average of these user-level averages. Ignore features where no user has more than one step.
Output the feature ID and the average progression time in seconds.
Use this dataset.
Write and check your solution in the code editor.
ML-Style Analytics Questions (Product Data Focus)
This question category is about models and metrics in a product context rather than how you write code. More precisely, these questions focus on your ability to frame prediction or classification problems, choose appropriate evaluation metrics, reason about bias and trade-offs, and connect model outputs to product decisions.
For example, like in these questions.
Question #28: Recommendation System
Recommendation System
Last Updated: December 2021
You are given the list of Facebook friends and the list of Facebook pages that users follow. Your task is to create a new recommendation system for Facebook. For each Facebook user, find pages that this user doesn't follow but at least one of their friends does. Output the user ID and the ID of the page that should be recommended to this user.
The dataset consists of two tables. The first one is users_friends.
The second is users_pages.
Avoid Falling For These Traps
The question seems deceptively simple: you’re interested in “pages my friends follow”. But have you considered this?
- Should you include pages followed by multiple friends once or multiple times?
- What if friendship is stored one-directionally (e.g., A -> B but not B -> A)
- How would you rank recommendations?
- How do you avoid recommending pages the user already follows?
Typical follow-ups and edge cases revolve around those mistakes.
How to Approach It?
Your solution should imply this in its logic:
- Candidate generation: user -> friends -> friends’ pages
- Exclusion: removing pages that the user already follows
- Uniqueness: output one row per
(user_id, page_id)recommendation
Also, when choosing the approach, the main trade-off is deciding how you perform exclusion.
NOT EXISTSis usually the safest exclusion mechanism (avoidsNULLpitfalls).LEFT JOIN … IS NULLwould also work, but it’s easier to break if the join keys aren’t unique or if you accidentally filter the right table inWHERE.
Solution Walkthrough
- Define output grain: one row per
(user_id, page_id)should already exist inusers_pages. - Generate candidates: join
users_friendswithusers_pagesto get the pages friends follow. - Exclude existing follows: remove pages already followed by the user with a subquery in
NOT EXISTS. - Deduplicate: keep distinct recommendations
- Validate: confirm zero overlap with
users_pagesfor the same user-page pairs.
Here’s the code.
Try solving these two additional problems.
Question #29: Algorithm Performance
Algorithm Performance
Last Updated: July 2021
Meta/Facebook is developing a search algorithm that will allow users to search through their post history. You have been assigned to evaluate the performance of this algorithm.
We have a table with the user's search term, search result positions, and whether or not the user clicked on the search result.
Write a query that assigns ratings to the searches in the following way: • If the search was not clicked for any term, assign the search with rating=1 • If the search was clicked but the top position of clicked terms was outside the top 3 positions, assign the search a rating=2 • If the search was clicked and the top position of a clicked term was in the top 3 positions, assign the search a rating=3
As a search ID can contain more than one search term, select the highest rating for that search ID. Output the search ID and its highest rating.
Example: The search_id 1 was clicked (clicked = 1) and its position is outside of the top 3 positions (search_results_position = 5), therefore its rating is 2.
Use this dataset.
Write and check your solution in the code editor.
Question #30: Naive Forecasting
Naive Forecasting
Last Updated: December 2020
Some forecasting methods are extremely simple and surprisingly effective. Naïve forecast is one of them; we simply set all forecasts to be the value of the last observation. Our goal is to develop a naïve forecast for a new metric called "distance per dollar" defined as the (distance_to_travel/monetary_cost) in our dataset and measure its accuracy.
Our dataset includes both successful and failed requests. For this task, include all rows regardless of request status when aggregating values.
To develop this forecast, sum "distance to travel" and "monetary cost" values at a monthly level before calculating "distance per dollar". This value becomes your actual value for the current month. The next step is to populate the forecasted value for each month. This can be achieved simply by getting the previous month's value in a separate column. Now, we have actual and forecasted values. This is your naïve forecast. Let’s evaluate our model by calculating an error matrix called root mean squared error (RMSE). RMSE is defined as sqrt(mean(square(actual - forecast)). Report out the RMSE rounded to the 2nd decimal spot.
Use this dataset.
Write and check your solution in the code editor.
Common Tables Used in Product Analyst SQL Interviews
Product analyst interviews revolve around a certain number of recurring tables that represent how product data is stored in practice.
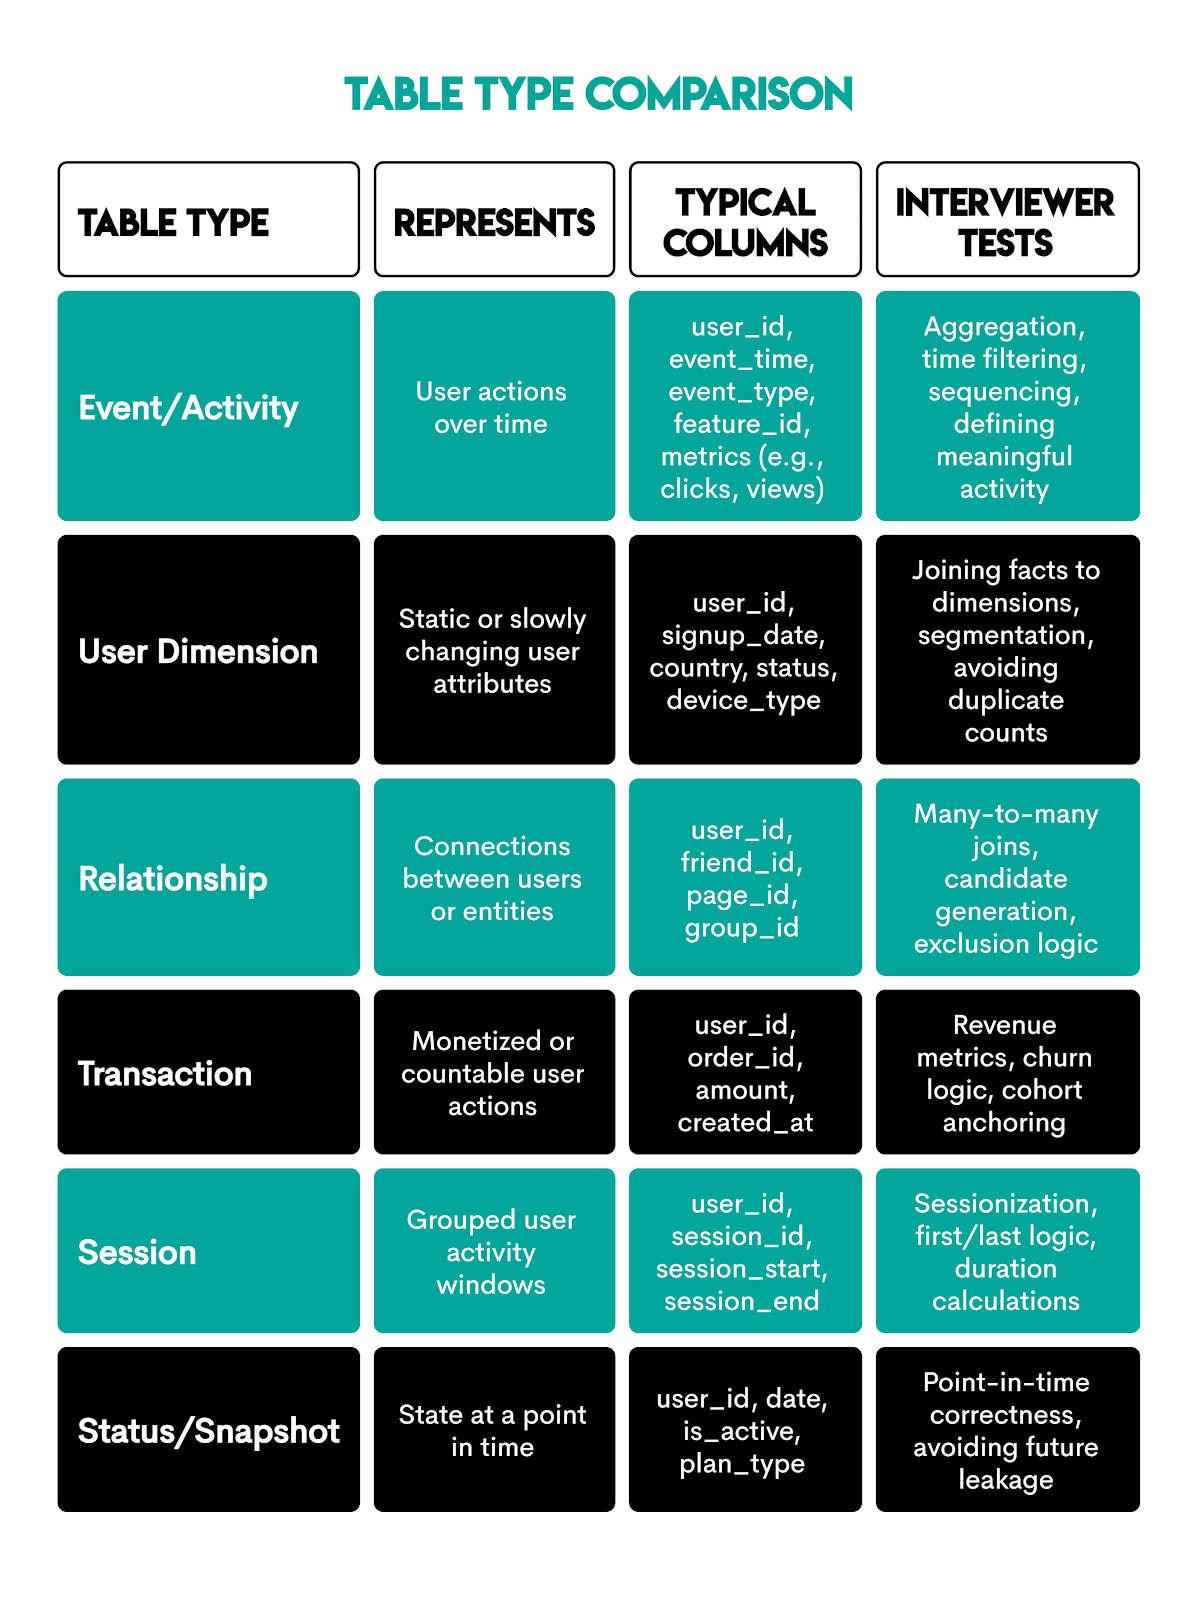
Interview tip: Identify table roles early (event vs dimension vs relationship) and adjust joins and aggregation grain accordingly. Don’t treat all tables the same.
SQL Skills Checklist for Product Analysts
Product analyst interview questions, as we’ve seen, focus on product-related knowledge, even when requiring SQL coding. Still, SQL is the single most important tool you have for showcasing your product knowledge.
Here’s what SQL skills you’d need to be fluent in.

Conclusion
The 30 questions in this guide reflect actual product analyst interview requirements: problem structuring, choosing the right metric, explaining your reasoning, and writing a workable SQL code.
Knowing all this doesn’t remove difficulty, but it gives you knowledge and confidence. That’s what’ll make the difference at your interview.
Share