SQL UNION vs UNION ALL: Differences You Need to Know

Categories:
 Written by:
Tihomir Babic
UNION vs UNION ALL is a crucial decision that analysts make daily. A wrong choice leads to erroneous business metrics. This article will help you avoid that.
Did you know that UNION removes duplicates and UNION ALL keeps them?
You probably did, as do most data analysts. What many don’t know is that this difference has the potential to hit you where it hurts most – business metrics. Use the wrong one, and customer counts, revenue totals, retention rates, and segmentation logic get shattered.
Duplicates matter in analytics. You’ll see why in the four common reporting scenarios. We’ll show you how both operators behave in those, show you an easy-to-apply framework to decide when to use UNION vs UNION ALL, and talk about performance differences and common mistakes.
UNION vs UNION ALL
UNION and UNION ALL have some differences, but also similarities.
Similarities
UNION and UNION ALL are called set operators. They both vertically combine the result sets of two or more queries into one result.
They also share the criteria that must be met for the two operators to run.
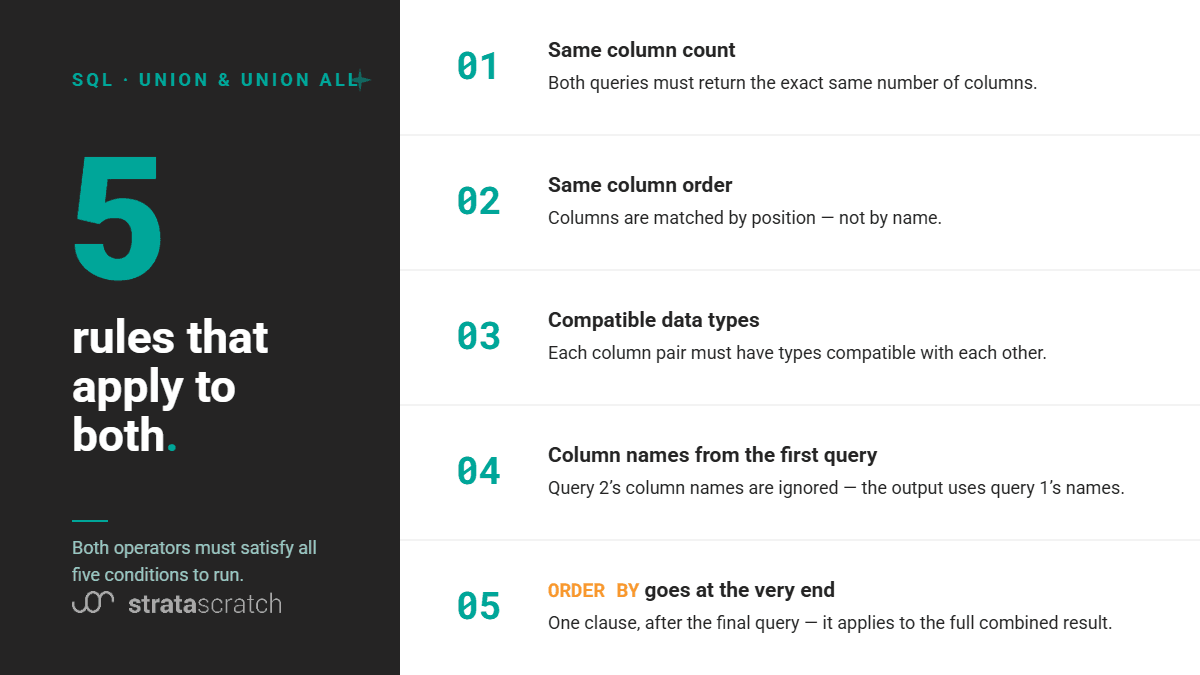
Here end the similarities.
Differences
UNION deduplicates the result. What you get back is a clean output without rows that share the same value in every column.
UNION ALL doesn’t do that. Every row from every query is stacked into an output, duplicate or not.
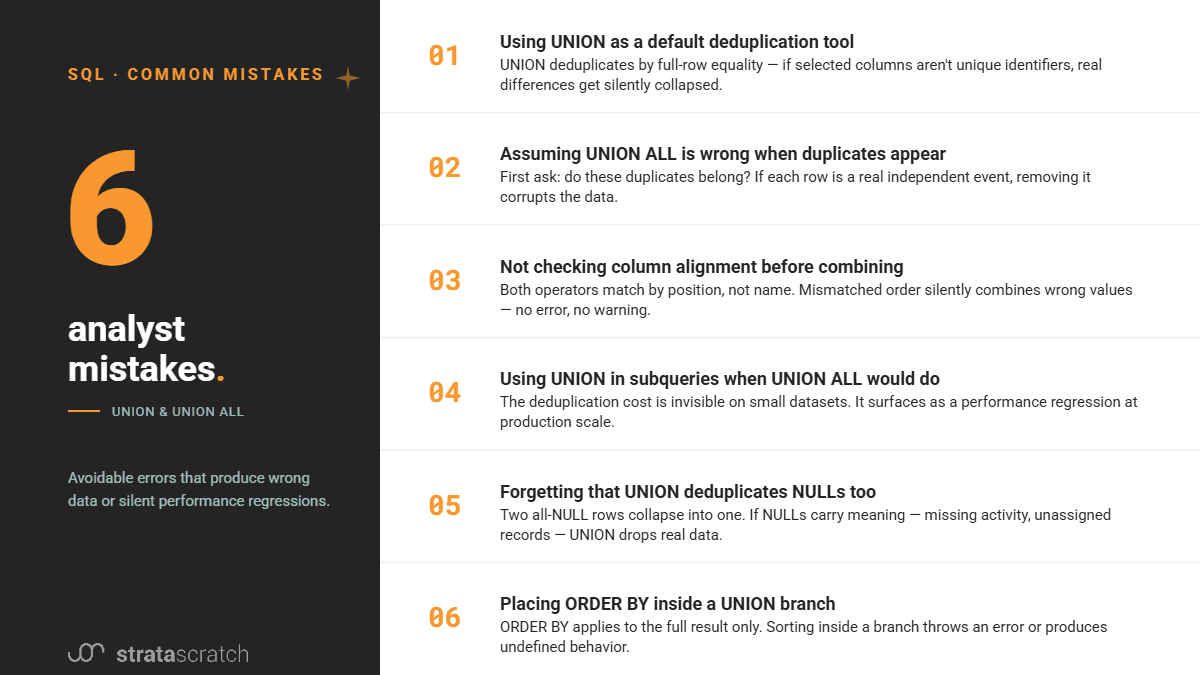
Another difference is how they handle NULLs. UNION sees two NULLs in the same column as equal. Consequence: rows with NULLs will be deduplicated like rows with any other duplicate values. UNION ALL keeps them all; predictably, as it doesn’t remove duplicates.
The only difference in syntax is the ALL keyword.
SELECT user_id, event_date
FROM mobile_logs
UNION
SELECT user_id, event_date
FROM web_logs;
This combines the two queries’ outputs and deduplicates.
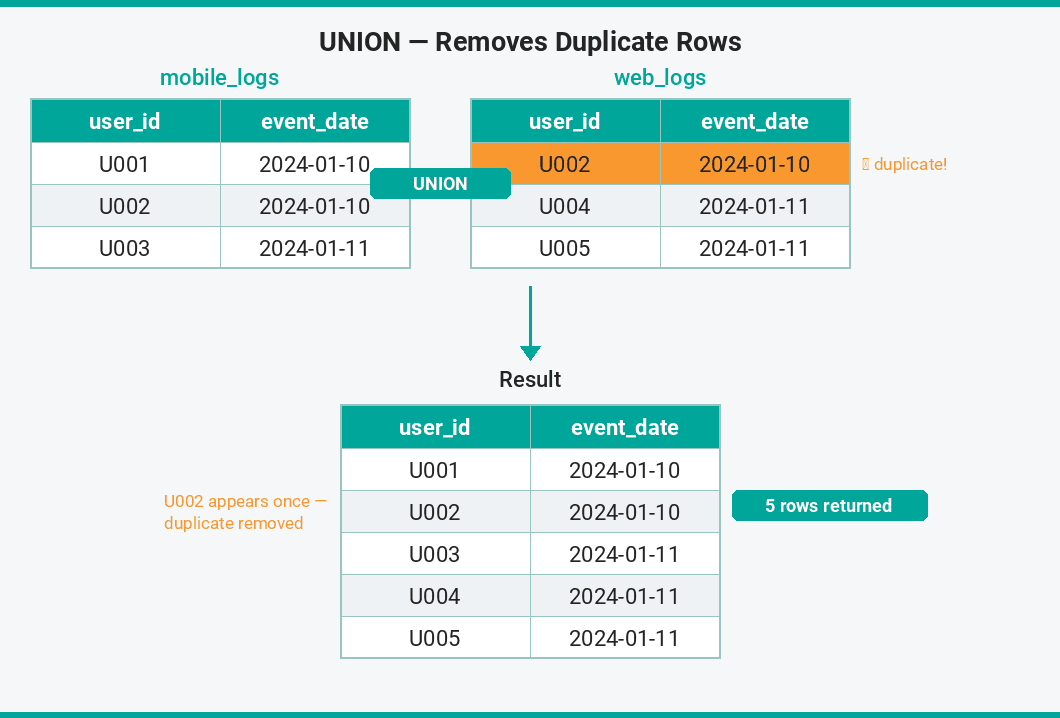
For the other operator, you just change its name; everything else stays exactly the same.
SELECT user_id, event_date
FROM mobile_logs
UNION ALL
SELECT user_id, event_date
FROM web_logs;
This time, the output contains all the rows from both SELECT statements, including duplicates.
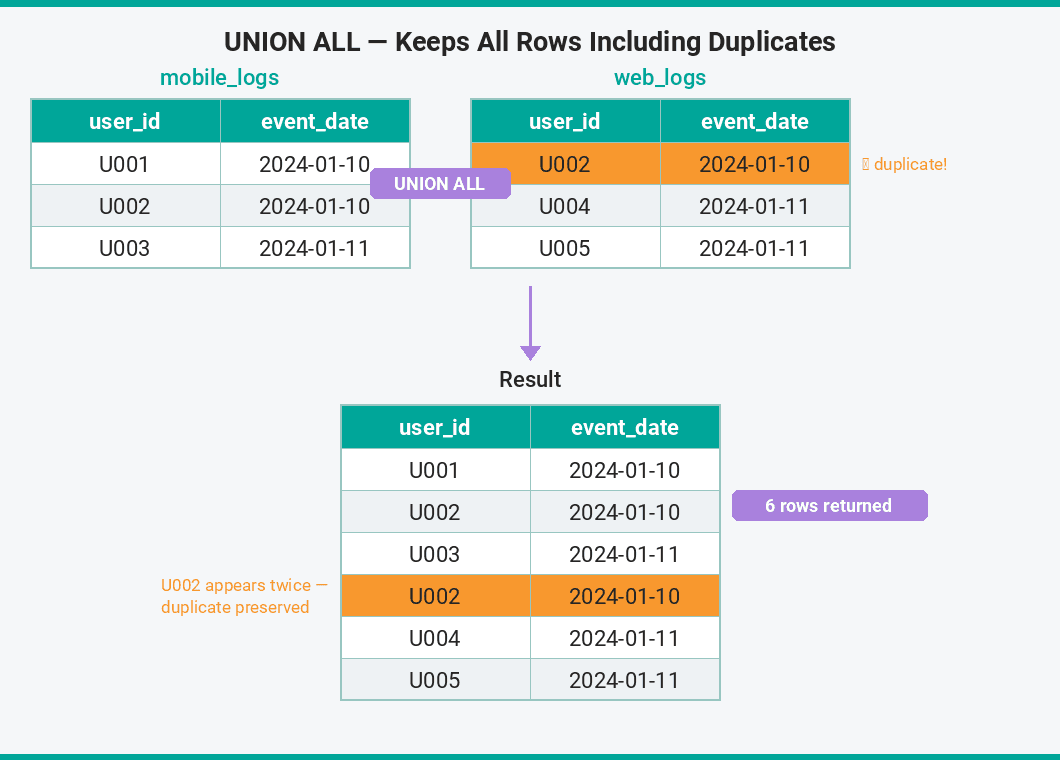
Why Duplicates Matter in Analytics
Many analysts think of duplicates exclusively as a dirty data issue, something to be removed always and at all costs.
That’s incorrect. Duplicates are not inherently wrong. They’re contextual. The question you should ask is not “are there any duplicates?”, but “do duplicates belong in my analysis?”
And that’s how you decide whether to use UNION or UNION ALL. For example, some analytical tasks require every occurrence of an event: message counts, transaction totals, activity logs. Others require a clean, distinct set: unique user lists, combined lookup tables, deduplicated reference data. Both are valid. Both appear constantly in real analytics work.
That is also where things can go wrong. Use UNION on an event log, and you erase legitimate repeated actions without realizing it. Use UNION ALL to combine two regional sales tables that share overlapping records, and every duplicate transaction gets counted twice in your revenue total.
Duplicates matter in analytics because they carry meaning depending on the context. On that context hangs the decision between UNION and UNION ALL.
How UNION vs UNION ALL Can Change Your Metrics
In the previous section, I touched on how choosing the wrong operator can dramatically change your metrics.
The four scenarios below show exactly how that plays out across the most common analytical contexts – each using a different metric type, with duplicate handling having direct, measurable consequences.
Customer Count Example
In this example, we’ll find the number of interactions and the number of people involved each day.
Daily Interactions By Users Count
Last Updated: July 2018
Find the number of interactions along with the number of people involved with them on a given day. Be aware that user1 and user2 columns represent user ids. Output the date along with the number of interactions and people. Order results based on the date in ascending order and the number of people in descending order.
The facebook_user_interactions table stores each interaction as a row with user1 and user2 columns; both are user IDs.
To count distinct people per day, each user needs to appear only once, regardless of which ID column they came from. This is a task for UNION.
This will count users who appear as both user1 and user2 on the same day only once.
| day | n_interactions | n_people |
|---|---|---|
| 0 | 4 | 4 |
| 2 | 3 | 4 |
| 1 | 3 | 4 |
UNION ALL doesn’t do that.
This output shows how UNION ALL inflates the people count: instead of 4 people per day, the count is now 8, 6, and 6.
| day | n_interactions | n_people |
|---|---|---|
| 0 | 4 | 4 |
| 2 | 3 | 4 |
| 1 | 3 | 4 |
Revenue Example
In this example, the task is to calculate daily revenue. More precisely, the net revenue of the product PROD-2891 for April 15-28, 2025, from the US market.
Daily Revenue
Last Updated: June 2025
You work as a data analyst for an e-commerce platform. The sales team needs to understand the net revenue performance of Product ID 'PROD-2891' in the US market for purchases made during a recent two-week period. The dataset contains purchases and refunds. Refunds link to their original purchase via the original_transaction_id field.
Calculate daily net revenue for April 15-28, 2025. Include completed purchases of PROD-2891 made in the US during that period, and any completed refunds linked to those purchases, regardless of when the refund was processed or which country is recorded on the refund row. Show zero for days with no activity. Return transaction_date and daily_net_revenue.
Both completed purchases and completed refunds are in the product_sales table and should be included in the calculation.
To get net revenue per day, purchases and their associated refunds need to land in the same aggregation. UNION ALL combines them into one dataset after finding the US purchases and linked refunds, but before SUM() runs.
Here’s the output.
| transaction_date | daily_net_revenue |
|---|---|
| 2025-04-15 | 0 |
| 2025-04-16 | 0 |
| 2025-04-17 | 449.99 |
| 2025-04-18 | 449.99 |
| 2025-04-19 | 0 |
| 2025-04-20 | 449.99 |
| 2025-04-21 | 0 |
| 2025-04-22 | 0 |
| 2025-04-23 | 449.99 |
| 2025-04-24 | 899.98 |
| 2025-04-25 | 449.99 |
| 2025-04-26 | 899.98 |
| 2025-04-27 | 449.99 |
| 2025-04-28 | 899.98 |
Using UNION here risks dropping any refund whose amount exactly matches a purchase on the same day. That would mean showing your net revenue as higher than it actually is.
Retention Example
We’ll now find the top 10 most active users on Meta/Facebook Messenger by calculating the total number of messages sent and received by each user.
Most Active Users On Messenger
Last Updated: November 2020
Meta/Facebook Messenger stores the number of messages between users in a table named 'fb_messages'. In this table 'user1' is the sender, 'user2' is the receiver, and 'msg_count' is the number of messages exchanged between them. Find the top 10 most active users on Meta/Facebook Messenger by counting their total number of messages sent and received. Your solution should output usernames and the count of the total messages they sent or received
The fb_messages table stores each exchange with user1 as sender, user2 as receiver, and msg_count as the number of messages.
We must account for both roles – message sending and receiving – that comprise the user activity. Therefore, we use UNION ALL before the aggregation runs.
Here’s the output.
| username | total_msg_count |
|---|---|
| tanya26 | 57 |
| johnmccann | 47 |
| craig23 | 43 |
| herringcarlos | 37 |
| wangdenise | 36 |
| trobinson | 35 |
| lindsey38 | 31 |
| lfisher | 29 |
| jennifer11 | 28 |
| ucrawford | 26 |
Using UNION would deduplicate the dataset, understating users’ activity.
You can see that for all users, except one, the total message count is lower, and the ranking is off.
| username | total_msg_count |
|---|---|
| tanya26 | 37 |
| craig23 | 34 |
| johnmccann | 32 |
| herringcarlos | 30 |
| jennifer11 | 28 |
| lfisher | 27 |
| wangdenise | 26 |
| trobinson | 26 |
| ucrawford | 25 |
| scottmartin | 23 |
Segmentation Example
We’ll tweak the following question’s requirements. Instead of what it says, we will count runners by age group across both genders.
Difference Between Times
Last Updated: October 2021
In a marathon, gun time is counted from the moment of the formal start of the race while net time is counted from the moment a runner crosses a starting line. Both variables are in seconds.
You are asked to check if the interval between the two times is different for male and female runners. First, calculate the average absolute difference between the gun time and net time. Group the results by available genders (male and female). Output the absolute difference between those two values.
The male and female runners are recorded in separate tables.
The risk here is that a male and a female runner have identical finish stats, which will be indistinguishable once the gender label is stripped. This is why we need to use UNION ALL.
Here’s the output.
| age | runner_count |
|---|---|
| 15 | 3 |
| 16 | 3 |
| 17 | 3 |
| 18 | 4 |
| 19 | 8 |
| 20 | 4 |
| 21 | 3 |
| 22 | 8 |
| 23 | 5 |
| 24 | 8 |
| 25 | 3 |
| 26 | 5 |
| 27 | 4 |
| 28 | 6 |
| 29 | 2 |
| 30 | 5 |
| 31 | 8 |
| 32 | 2 |
| 33 | 4 |
| 34 | 5 |
| 35 | 4 |
| 36 | 14 |
| 37 | 9 |
| 38 | 6 |
| 39 | 3 |
| 40 | 7 |
| 41 | 7 |
| 42 | 5 |
| 43 | 5 |
| 44 | 6 |
| 45 | 7 |
| 46 | 5 |
| 47 | 2 |
| 48 | 7 |
| 49 | 1 |
| 50 | 5 |
| 51 | 4 |
| 54 | 1 |
| 55 | 2 |
| 56 | 2 |
| 57 | 1 |
| 60 | 1 |
| 61 | 1 |
With UNION, the count will be silently deflated.
You can’t see the difference in this preview. But run both codes in the widget, and you’ll see it at age 26.
| age | runner_count |
|---|---|
| 15 | 3 |
| 16 | 3 |
| 17 | 3 |
| 18 | 4 |
| 19 | 8 |
| 20 | 4 |
| 21 | 3 |
| 22 | 8 |
| 23 | 5 |
| 24 | 8 |
| 25 | 3 |
| 26 | 4 |
| 27 | 4 |
| 28 | 6 |
| 29 | 2 |
| 30 | 5 |
| 31 | 8 |
| 32 | 2 |
| 33 | 4 |
| 34 | 5 |
| 35 | 4 |
| 36 | 14 |
| 37 | 9 |
| 38 | 6 |
| 39 | 3 |
| 40 | 7 |
| 41 | 7 |
| 42 | 5 |
| 43 | 5 |
| 44 | 6 |
| 45 | 7 |
| 46 | 5 |
| 47 | 2 |
| 48 | 7 |
| 49 | 1 |
| 50 | 5 |
| 51 | 4 |
| 54 | 1 |
| 55 | 2 |
| 56 | 2 |
| 57 | 1 |
| 60 | 1 |
| 61 | 1 |
Decision Framework: Should You Use UNION or UNION ALL?
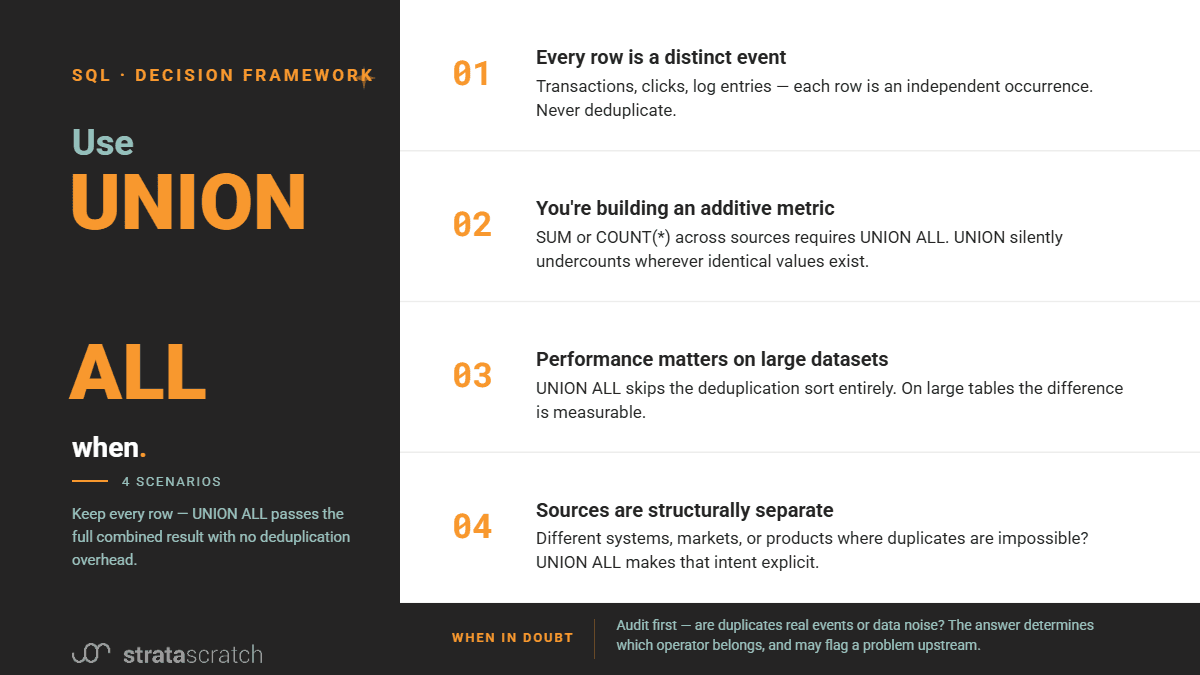
The default in most analytical work should be UNION ALL. UNION should be a deliberate choice.
Here’s the framework that will help you think through the decision.
When to Use UNION
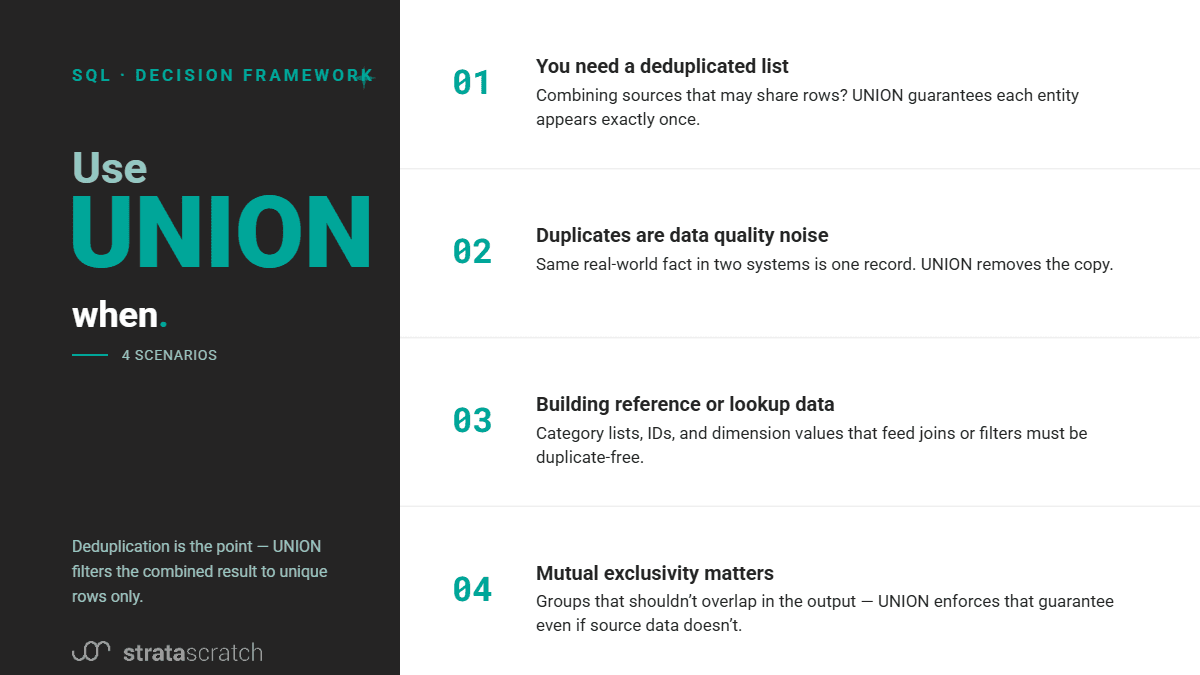
When to Use UNION ALL
Performance Differences Between UNION and UNION ALL
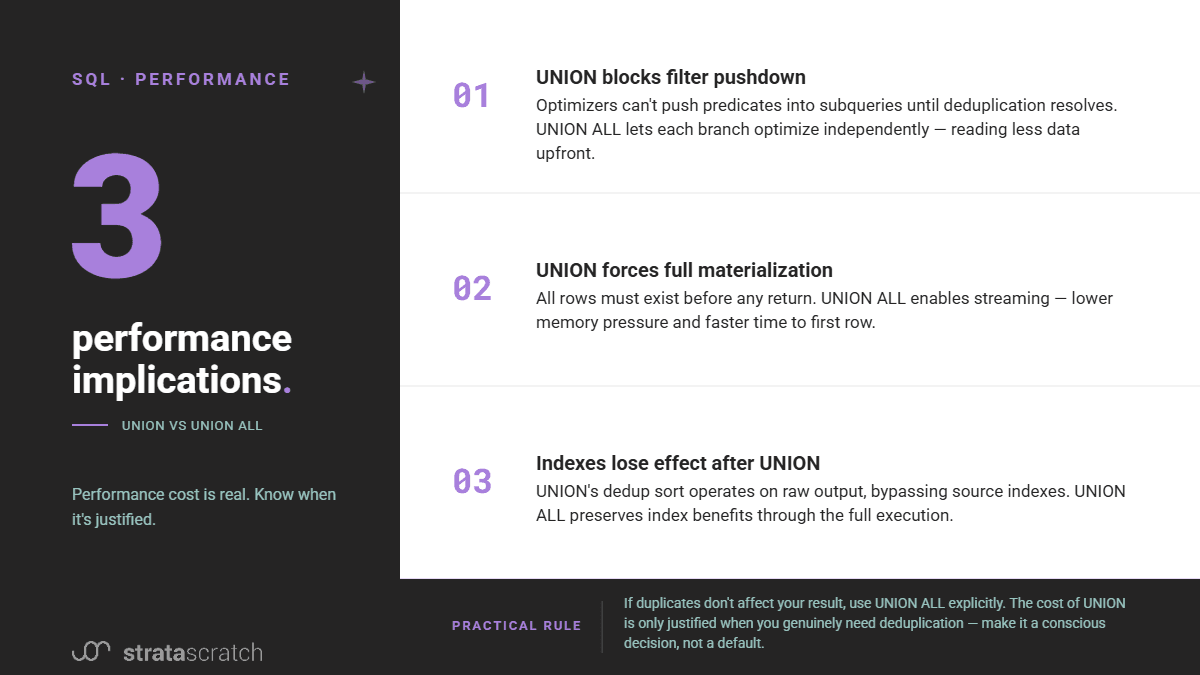
The performance difference comes down to one thing: UNION does extra work. First, it does the same thing as UNION ALL by stacking the result sets. Then, it sorts or hashes the entire combined dataset to identify and remove duplicate rows.
That extra work is not noticeable in the small datasets we used. However, it can quickly become significant with the increase in data volume, pushing query runtimes from seconds into minutes.
Common Mistakes Analysts Make
UNION vs UNION ALL vs INTERSECT vs EXCEPT
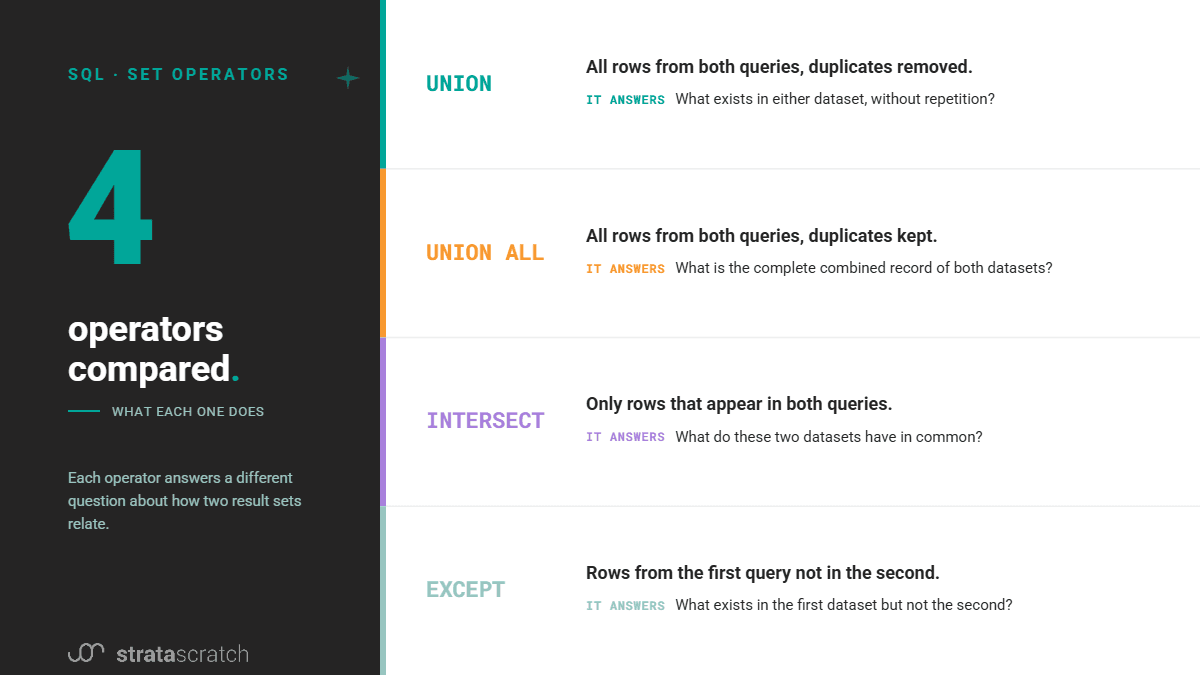
Besides UNION and UNION ALL, there are two more set operators in SQL: INTERSECT and EXCEPT.
They all require the same structural compatibility: matching column counts, matching order, and compatible data types. Beyond that, they diverge significantly in what they return.
Here’s an overview of all four.
(Here’s more about INTERSECT in SQL.)
Conclusion
The main difference between UNION and UNION ALL is how they treat duplicates: the former removes them, the latter keeps them.
The business examples we’ve shown demonstrate how duplicates (or the absence thereof) can affect metrics and lead to reporting that is completely off the mark.
Therefore, deciding between UNION and UNION ALL is a crucial aspect of your analytics work.
FAQs
1. Is UNION slower than UNION ALL?
Yes.
More precisely, UNION ALL is always faster for additive metrics over event data from genuinely separate sources. That’s because UNION performs deduplication after combining the result sets.
2. Does UNION remove duplicate IDs or duplicate rows?
It removes duplicate rows.
UNION compares every selected column simultaneously, meaning that it removes a row only if every column value matches another row exactly. If two rows have the same user_id but different timestamps, amounts, etc., they are not considered duplicates and will appear in the result.
For deduplicating an ID column, use SELECT DISTINCT or ROW_NUMBER() with a partition.
3. Should I use UNION ALL by default?
Yes.
UNION ALL should be your starting point because it’s faster, more explicit, and makes no assumptions about your data.
Use UNION deliberately, after you’ve confirmed that the query requires row deduplication.
4. Does UNION treat NULL values as duplicates?
Yes.
If every selected column in two rows is NULL, they are treated as identical, and UNION will output only one such row.
This is a rare occasion when SQL treats NULL as an actual value.
5. Can UNION change my aggregate metrics?
Yes.
Aggregation built on top of a UNION will return wrong results if legitimate duplicate rows are removed before the aggregation. For example, the calculated revenue will be erroneously lower if you remove transactions that should be included in the calculation simply because they share the same amount, date, and products, so you thought duplicates were a result of poor data quality.
Share