Concepts and Questions to Prep for Your Data Analyst Job Interview


Categories:
 Written by:
Nathan Rosidi
The demand for Data Analysts is on the rise – market analysis shows that up to 85% of companies have adopted data analysis technologies.
Let’s begin with a simple question: What is a data analyst? Data analysts gather and use data to answer questions and provide solutions to problems. Daily tasks as a data analyst involve:
- The collection and storage of data
- Maintaining a clean and organized data structure
- Query preparation to gather data for business questions and/or create reports
- Use of gathered and organized data to provide real solutions for everyday problems
Some common tools a data analyst should become familiar with include:
- SQL
- Python
- R, SAS, and or SPSS
- Excel
But what kind of company can you expect to work at as a data analyst? In January of 2022, the Economic Times cited (data analytics to be the most desired skill in 2022). During your research, you may have come across the term FAANG. FAANG is the acronym for the top 5 most reputable companies for data analysis: Facebook, Amazon, Apple, Netflix, and Google. However, options aren’t limited to these businesses. With the need for data analysis skills rapidly on the rise, the market is full of options like phone companies, internet providers, grocery stores, schools, etc. Here's a great article (11 Best Companies to Work for as a Data Scientist) on other reputable places a data analyst should scope out.
No matter where you go, as mentioned above, SQL skills are a must for a data analyst. We have identified 5 essential skills that every data analyst should know: JOIN, subqueries & CTEs, RANK, aggregate functions, and case expressions. Below you will find a brief introduction to each feature, a sample interview question that utilizes that concept, and a short overview of how a data analyst would approach the proposed problem.

1. Joins
What is a Join?
Often, you will need to gather data from multiple tables to perform a task. To accomplish this, a JOIN must be used. A join brings two tables together to produce a new, merged table on constraints specified in a query. The generic syntax* of a join is:
SELECT values
FROM table a
    JOIN table b
    ON a.commonvalue = b.commonvalue
The join method specified – INNER, LEFT OUTER, RIGHT OUTER, FULL – will utilize the columns and the queries differently. For example, an inner join will only display rows where the data in the right-hand table satisfies the join condition on the left. A left outer join, however, first performs an inner join, then for all rows on the left-hand side of the argument that did not find a match, the row is added with a null value for the column on the right.
Using JOIN in a Query
A well-organized join can give you access to all of the data you need to optimize a query. Here is a question on StrataScratch that uses JOIN: Product Transaction Count


Link to the question: https://platform.stratascratch.com/coding/10163-product-transaction-count
Select *
FROM excel_sql_transaction_data t
    JOIN excel_sql_inventory_data i
    ON t.product_id = i.product_id
Assumptions
Because the data set is housed in two separate tables for this problem, we use JOIN to gather all of the data needed for the query. This question notes that some products may have no transactions and to ignore them. Therefore, an INNER JOIN should be used because it will only produce rows where table a finds a match in table b on the constraint. You’ll also see the use of COUNT() is important to this solution, which will be covered further below.
Approach
The rest of the approach for this solution requires identifying the output needed (product_name and the number of transactions). The SELECT statement will select the product_name and the COUNT() of the number of transactions. This is why JOIN is required for this solution. The COUNT() function must pull from the excel_sql_transaction_data table, but the project requires us to also pull the product name from the excel_sql_inventory_data table. The INNER JOIN is completed on the common element, product_id. Finally, the results will be grouped by product.
Practicing JOIN with this Question
Use the code widget below to see how JOIN works with data from this question (this is not the solution to the posted question). Click Run Code to see what happens when two tables are joined.
SELECT *
FROM excel_sql_transaction_data t
JOIN excel_sql_inventory_data i ON t.product_id = i.product_id
Check out our post "SQL JOIN Interview Questions" to practice more such questions.
Coming up, the next topic we will cover is subqueries and CTEs. We will include a practice question that combines the use of JOIN with this next skill.
2. Subqueries & CTEs
What is a Subquery? What is a CTE?
A subquery is a query that is nested inside another query. For example, if you are tasked with counting sheep, but you don’t know what a sheep is, the question “what is a sheep” becomes a subquery inside “how many sheep are present?”. Subqueries are used in the WHERE clause of your current query and nested inside parenthesis (), sometimes referred to as a parenthesized subquery. Parenthesized subqueries are used in subquery expressions, which are used to see if data exists within the query, if specific data can or cannot be found in a table, etc.
When called using the WITH clause, a subquery becomes a CTE. The acronym CTE stands for common table expression. A CTE acts similarly to a temporary table, but is designed only to be used within the query – once the query completes, the CTE is automatically destroyed. CTEs are often used for readability within a query, especially when recursion is involved. Below is a general example of how a CTE appears and can be used in a query:
WITH cte_name_here AS (
   SELECT values
   FROM table
   WHERE...
)

SELECT value
FROM cte_name_here
WHERE...
Using Subquery & CTE in a Query
The following question on the StrataScratch platform can be solved using a CTE in the query:

Link to the question: https://platform.stratascratch.com/coding/10173-days-at-number-one
Assumptions
Two tables are provided for this data analyst interview question, so the first assumption is that we will perform a JOIN to gather all data needed for the solution. The question is asking for the number of days where a song has been in the top position in the US and worldwide rankings on the same date, not the total number of days where the song has ranked #1 in the US and worldwide separately. Since the output is requesting the track name and number of days the track has been in the 1st position, the use of COUNT() is expected in this query.
Approach
On this approach, a CTE will be created to hold the track name and date that a song has been in the first position for the worldwide market only. Once the CTE is initialized, a LEFT JOIN is performed between the two tables on the track name column. We’ll reduce the results only to where the position is ranked 1 in the worldwide table and then group those results by the track name, then the date. We now have a new data set that only includes the track name and the date that the song was at position 1 worldwide.
A new query can be prepared next which will join the results from the CTE with the table holding the US rankings. Since the trackname was returned in the CTE, this will be the value that the JOIN is performed on. The SELECT statement will request the track name from the US table and the COUNT() of the dates from the US table. The results will be filtered in the WHERE clause to only return results where the date in the US table matches that of the date returned from the CTE (which houses the date from the worldwide table). Since COUNT() was used, the results will be grouped by the trackname, and as per the instructions, ORDER BY will also order by track name in A-Z, or ascending order.
Practicing CTE with this Question
Use the code widget below to practice creating a CTE (this is not the solution to the posted question). Click Run Code to see how all data appears when queried after a CTE is created.
WITH temp_CTE AS
  (SELECT us.trackname,
          ww.date
   FROM spotify_daily_rankings_2017_us us
   LEFT JOIN spotify_worldwide_daily_song_ranking ww ON ww.trackname = us.trackname
   WHERE ww.position = 1
   GROUP BY us.trackname,
            ww.date)
SELECT *
FROM temp_CTE
Let’s switch gears and move to the next concept, RANK() and its similar function DENSE_RANK(), to discuss how ranking values works in PostgreSQL.
3. Rank

What is Rank?
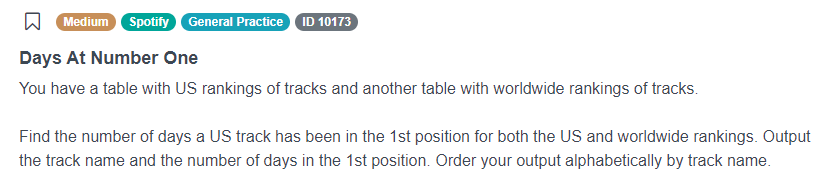
SQL RANK Function is a function that assigns a ranking to every row of a result set. The RANK() function is a member of the SQL window functions family. Window functions use data from a set of table rows to perform a calculation. In this case, the calculation is numbering these values lowest to highest based on the argument(s) specified in the query. If desired, a partition can be specified that will allow multiple categories (partitions) in a result set to be ranked. In partitioned rankings, each category starts with rank 1, so one set of data may produce several sets of rankings.
Similar to RANK() is the DENSE_RANK() window function. DENSE_RANK() also assigns a ranking to every row of a result set, but when there are duplicate values in the result set, RANK() will display tied rankings, but it will skip the next rank number until it hits a unique value (i.e. 1, 2, 2, 4, 4, 4, 7, etc.), whereas DENSE_RANK() will continue ranking in sequence after hitting a tied value (i.e. 1, 1, 2, 2, 3, 4, 5, etc.), shown below.
Here is an example of how RANK() is called vs DENSE_RANK():
RANK() OVER(
[PARTITION BY name_of_column_for_partition]
ORDER BY name_of_column_to_rank
)
Dense_Rank is:
DENSE_RANK() OVER(
[PARTITION BY name_of_column_for_partition]
ORDER BY name_of_column_to_rank
)
Note that the partition expression is in brackets [] because it is optional when using RANK and DENSE_RANK. Here is what the results of RANK and DENSE_RANK look like compared to one another when there are tied/equal values:
RANK:

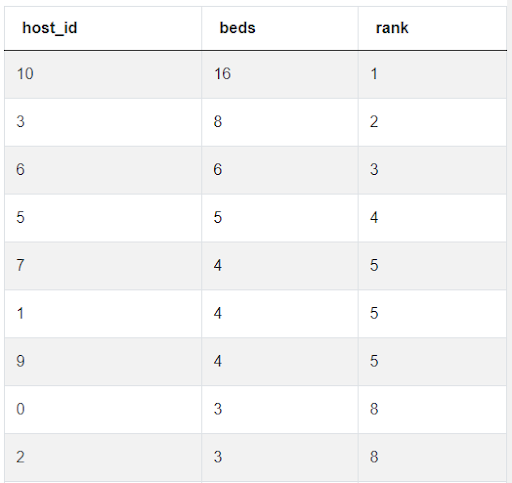
DENSE_RANK:

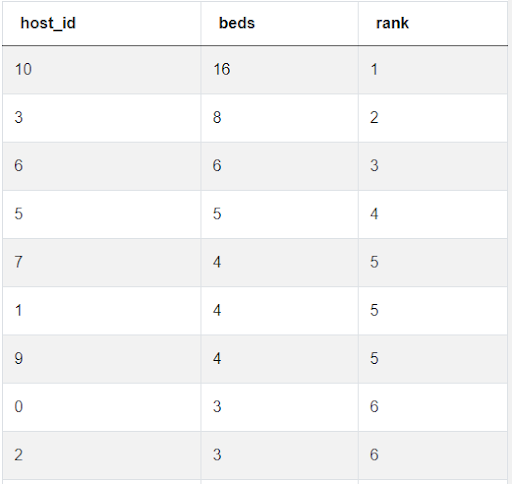
One final window function similar to RANK() and DENSE_RANK() is ROW_NUMBER(). The ROW_NUMBER() function returns the number of the current row. This is initialized the same as RANK() and DENSE_RANK(). The example below shows how the results change when ROW_NUMBER() is used:
ROW_NUMBER:

Why is Rank used?
Rank is best used when results should be ordered and numbered. For example, if you want to find the top performers in your company based on a set of parameters, use RANK() or DENSE_RANK() in your query to easily identify the results. The choice between the two functions often comes down to whether the caller wants to include “ties” in the results. Because the data in the table can also be partitioned into smaller groups to rank (each starting with the value 1), RANK() would be helpful if tasked with evaluating the popularity of perishable foods in a grocery store’s inventory with separate rankings for fruits, vegetables, deli, etc.
Using Rank in a Query
The following question is an excellent example of using DENSE_RANK() in a query.

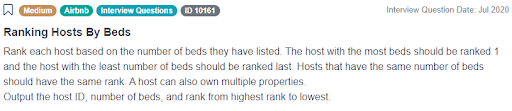
Link to the question: https://platform.stratascratch.com/coding/10161-ranking-hosts-by-beds
Assumptions
Because this question is clear that the output is looking for a ranking, we know either RANK() or DENSE_RANK() will be used. Since the instructions do not state to allow ties or rankings of equal levels, the choice here is DENSE_RANK(). Since a host can have multiple properties, we’ll want to SUM the number of beds. Finally, since a host can have multiple properties, but the interview question presented doesn’t state to separate the number of beds by property, this is something you would want to clarify with the interviewer.
Approach
First steps are to prepare a select statement to find the number of beds per host. Use SUM() to find the total number of beds. For readability and ease of use, we house these results in a CTE for the duration of the query. Once the number of beds are found, the desired columns from the CTE will be selected and DENSE_RANK() used to order rows by highest number of beds. It is important to take care not to use the rank function too early or results won’t be accurate.
Practicing RANK with this Question
Use the code widget below to see how data in a table can be ranked(this is not the solution to the posted question). Click Run Code to see the result set. Change RANK() to DENSE_RANK() and then ROW_NUMBER() to see how the results change.
SELECT RANK() OVER(
                   ORDER BY n_beds DESC) AS rank,
       apartment_id,
       apartment_type,
       n_beds
FROM airbnb_apartments
Next, we will cover aggregate functions, which will cover SUM() suggested above and other aggregate functions.
4. Aggregate Functions - COUNT(), SUM(), MAX(), MIN()
SQL Aggregate functions is just a scary way to summarize a number of built-in SQL window functions that return a single result from a set of multiple input values. There are a multitude of functionalities available in aggregate functions, such as finding a sum of values, finding the range of a set of values, counting rows in a column, etc. Due to the robust nature of these functions, instead of providing an example here of how to initialize one or more aggregate functions, please refer to the PostgreSQL Documentation for in-depth explanation.
Why are Aggregate Functions Used in SQL?
Frankly, queries would be pretty boring without aggregate functions. They offer robust functionality for solving everyday tasks. Common aggregate functions are SUM(), which produces the sum of the rows in a specified column; COUNT(), which counts the number rows present in a column that meets a specification; MAX(), which produces the highest value from the rows in a column; and MIN() which produces the lowest value from the rows in a column. Because of the wide array of functionalities available with aggregate functions, it’s possible to say they are one of the most powerful skills a data analyst can develop.
Using Aggregate Functions in a Query
To work through a problem that uses aggregate functions in its solution, let’s look at the following question from StrataScratch.

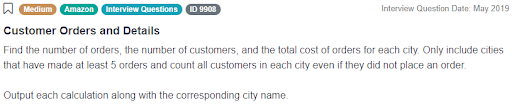
Link to the question: https://platform.stratascratch.com/coding/9908-customer-orders-and-details
Assumptions
This question requests an output of orders made in each city from a dataset with columns for the city name, the number of orders, the number of customers, and the total cost of orders for that city. This means we will need to use COUNT() to get the total number of orders and customers, and SUM() to find the total cost of orders. These results will be grouped by the city column, but results will need to be limited (LIMIT) to only cities that have had 5 or more orders. Finally, because there are multiple tables in this example, a LEFT JOIN will be used since we want to include all customers in each city in our calculations, even customers who have not made an order.
Approach
Reviewing both tables provided, the common value in both tables is the custid column, which will be used for the join. By preparing the JOIN statement first, we are able to gather all data points needed to pull from both tables. A LEFT JOIN will be used to include all customers, even those who have not placed an order. Once the join clause is prepared, the SELECT statement is next. The SELECT should return the city, total number of orders, total number of customers, and the total cost. For total number of orders and total number of customers, use COUNT() respectively. Because the same customer may have placed multiple orders, use the DISTINCT keyword to avoid duplicates. To find the total cost of all orders per city, use SUM(). The GROUP BY clause is often used beside aggregate functions, and in many cases you will receive a syntax error if it is omitted. Results should be grouped by city. Finally, we are expected to limit results to cities that have had 5 or more orders. Use the HAVING clause in conjunction with your GROUP BY to limit the count of orders by 5 or more ( > 5).
Practicing Aggregate Functions with this Question
Use the code widget below to practice using aggregate functions (this is not the solution to the posted question). Click Run Code to see how COUNT and SUM can be used to gather the total number of orders made by a customer and sum the total cost using data from the orders table:
SELECT cust_id,
       COUNT(cust_id) AS num_orders,
       SUM(total_order_cost) AS total_cost
FROM orders
GROUP BY cust_id
ORDER BY cust_id DESC
Next up, we will discuss the use of case expressions in sql, including an example where you can continue practicing aggregate functions while introducing this next concept.
5. Case Expressions
What is a Case Expression?
A case expression, signified by CASE in a query, is a conditional expression similar to an If/Else statement in other languages. A condition is specified in the query along with the result if that condition is met. In many cases, the term case statement is used interchangeably with case expression. See below for a generic example of how CASE appears in a query:
SELECT CASE WHEN condition THEN result
    ELSE other_result
    END
Why are Case Expressions Used?
CASE expressions are very beneficial when a value or action is dependent upon a specific row or column’s state. Queries are optimized and shortened by CASE expressions, often saving tens of lines of code. CASE is not limited to just one condition – up to 255 separate conditions/arguments can be evaluated in a case expression! Without use of a case expression, queries would be tedious and time-consuming.
Using CASE in a Query
The following question is a great way to learn and practice how to use a case expression in a query. This data analyst interview question also uses aggregate functions, allowing you to further enhance that skill.

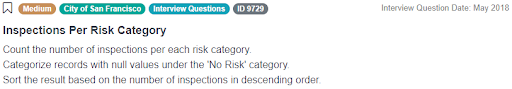
Link to the question: https://platform.stratascratch.com/coding/9729-inspections-per-risk-category
Assumptions
Resolution for this question should include two columns: the risk category and the number of inspections per each category. While the output is simple, there’s more going on under the surface. Not all health inspections will result in a violation or risk. This means that the risk_category field may be null for one or more rows of health inspections. We will need to identify these rows and assign them to No Risk, which is where CASE will be used in the query.
Approach
In the select statement, we will use a CASE expression** to find all rows with a NULL value in the risk_category column first. This will be assigned to No Risk. Otherwise, it will keep the current value. Next, use COUNT() to find the total count of inspection_ids. Use GROUP BY in conjunction with COUNT on the risk_category column. Results should be ordered by the number of inspections from highest to lowest, so we will use ORDER BY [value] DESC to finish up the query.
Practicing CASE with this Question
Use the code widget below to see an example of a case expression using data from this question (this is not the solution to the posted question). Click Run Code to see how a case expression can assign a health inspection as “passed” or “failed” based on the score documented:
SELECT business_name,
       inspection_date,
       CASE
           WHEN inspection_score > 50 THEN 'passed'
           ELSE 'failed'
       END
FROM sf_restaurant_health_violations
ORDER BY inspection_date DESC
**A note on the use of CASE expression: for this particular problem, COALESCE() is a more efficient solution than CASE. COALESCE() is a syntactic shortcut for CASE. Coalesce returns the first of its arguments that is not null. It can be used to substitute a default value for null values. In this case, COALESCE (risk_category, 'No Risk') will return the value in the risk_category column if it is not null. Otherwise, the value for that row will return ‘No Risk’.
Conclusion
In the above sections, we’ve learned how to use JOIN, subqueries & CTEs, RANK, aggregate functions, and case expressions. We’ve counted through data, ranked items in a list, joined tables, and iterated through case conditions. These are all skills in a data analysts’ daily repertoire that we encourage sharpening whenever possible. Being well-practiced in these subjects is an advantage when interviewing for or preparing for a new position in the field of data science. While the topics covered in this article are great basics for all to learn, there’s so much more to learn in your journey to becoming or growing as a data analyst. Check out our posts "Data Analyst Interview Questions" and "Data Analyst SQL Interview Questions" for more practice in the diverse field of data analytics.
Share