Advanced Data Analytics Interview Questions


Categories:
 Written by:
Irakli Tchigladze
In this article, we’ll answer several SQL, Python, and statistics advanced data analytics interview questions, so you get through the interview easier.
Technology has allowed businesses to collect and maintain more data than ever before. Information is no longer stored in thick paper folders but in databases and spreadsheets.
Digitization of information has created new opportunities for analyzing data. Companies are always looking for professionals who can perform data analytics to find useful insights.
In this article, we will explore the meaning of data analytics, and common tasks employees have to perform. We will also walk you through several advanced data analytics interview questions and practice essential skills like SQL, Python, Statistics, and Math.
What is Data Analysis?
Data analysis means working with data to find insights that can be used to make data-based decisions. Companies need qualified professionals to analyze the data and avoid common pitfalls like selection bias or common calculation mistakes.
Data analysis also often needs to prepare data by removing inconsistencies. Depending on the company, data analysts may also need to perform various other tasks:
- Define the goal of data analysis. What information or insights are we looking for?
- Collect the data or identify existing data sources important for answering the question.
- Clean the data. Remove inconsistencies in the data that might lead to inaccurate results. For example - NULL, duplicate, or outlier values. Also, explore the data’s structure, value types, important columns, and information in the table.
- Analyze the data. Write the query and calculate the metrics. Return only essential information and discard the rest.
- Visualize findings. Turn your findings into nice graphs and charts
Most of these steps include coding, at least to some extent. This article will focus on calculating metrics using SQL and Python.


What Do Data Analysts Do?
Data analysts’ day-to-day duties might vary from one company to another. Generally, data analysts sort through large volumes of data, identify trends and patterns, and find useful information that could influence strategic decisions.
One of the most common tasks is preparing data for analysis. Typically, initially collected data is inconsistent and contains NULL, duplicate, and outlier values. Or you might need to convert values to another type. In short, the data is not clean. Data analysts remove these inconsistencies and lay the groundwork for accurate data analysis.
Data analysts rarely perform advanced duties like data modeling, predictive analytics, or machine learning. Companies usually hire data scientists to do those jobs. If you’d like to do this, you better apply for data scientist jobs. Read our blog post on Data Science Interview Questions to start.
Every data analyst must know two programming languages - SQL and Python. It is also important to have the ability to look at data, quickly comprehend what it represents, and find meaning. To learn more, read our blog post about data analyst skills.
Interview questions reflect common data analyst tasks and test the knowledge of essential skills. Later in this article, we will walk you through answers to actual data analytics interview questions.
Advanced Level Data Analytics Interview Questions

Let’s go through some advanced data analytics interview questions to practice SQL, Python, and analytical thinking.
If you like the challenge, we have more Data Analyst Interview Questions on the StrataScratch blog.
The following two SQL questions will require you to know some important data analytics SQL concepts. However, to get more theory behind those (and many others!), refer to our SQL Cheat Sheet.
SQL Data Analytics Interview Questions
Data analysts primarily use SQL to work with data. Let’s examine some advanced data analytics interview questions and discuss their best possible solutions.
Question 1: Year Over Year Churn
Last Updated: February 2020
Calculate the year-over-year change in the number of Lyft drivers who churned. Churn is defined as the year a driver's employment with Lyft ends, indicated by the end_date field in the dataset. Drivers with no end_date are considered active.
Output the year (based on the end_date year) along with the number of drivers who churned in that year, the number of churns in the previous year, and whether the number has increased ('increase'), decreased ('decrease'), or stayed the same ('no change').
Link to the question: https://platform.stratascratch.com/coding/10017-year-over-year-churn
Understand the Question
For many companies, churn rate is one of the most important metrics. It measures the number of users who stopped using a product or a service. An alarming number of churns could indicate a poor product or other significant problem.
In this case, candidates interviewing at Lyft were asked to find the number of drivers who left the platform in a specific year. The high year-over-year churn might indicate the drivers' dissatisfaction with Lyft.
Available data
Candidates interviewing at Lyft were provided with the lyft_drivers table to answer this data analytics interview question.
Every record contains four values.
- index is a number assigned to every record.
- start_date is the date when the driver signed up for Lyft.
- end_date is when the driver stopped driving for Lyft.
- yearly_salary represents the driver’s earnings per year.
Data analysts should be able to identify important values by looking at available data.
Logical Approach
The question asks us to find the number of drivers who stopped driving in a specific year.
We can do this by grouping records by year and using the COUNT() aggregate function to get the number of end_date values in each group.
Initially, we do not have a year value – only a date when the driver stopped driving. So let’s start by writing a subquery that extracts the year value from every end_date value that exists (is not NULL).
The answer should also include churns for the previous year. We can simply use the LAG() function to return the number of churns of the previous row.
By now, we have three out of four values needed for an answer - the year, the number of churns for that year, and the previous year.
The answer should also include a verbal description of changes in churn numbers. ‘increase’ if they increased from the previous year, ‘decrease’ if they decreased, and ‘no change’ if they stayed the same.
Write the code
1. Extract years from end_date values
Let’s start by using the DATE_PART() function to extract the year from the end_date value (which we cast to date type).
It’s also a good practice to use the AS command to give year values a descriptive name - year_driver_churned.
SELECT DATE_PART('year', end_date::date) AS year_driver_churned
FROM lyft_drivers
WHERE end_date IS NOT NULL
NULL end_date values represent drivers who did not quit. We only need drivers who quit, so we can use the WHERE clause to discard end_date values that are NULL. This query will be a subquery written in the FROM clause of the main query.
2. Find churn numbers for the current and previous year
Let’s write another query to work with the result of the query from step 1.
We need to return the year, the number of churned drivers (end_date values) for that year, and the previous year.
To find the number of churns in each year, simply SELECT year_driver_churned values from the subquery and group records by year. Then use the COUNT() aggregate function to count the number of records in each group.
We also need to find the number of churns in the previous year. For that, we can use the LAG() window function.
The first argument to the LAG() function is the COUNT(*) aggregate function which counts the number of drivers churned each year. The second argument specifies the number of rows to offset. In this case, it is 1, so LAG() will access the value one row before the current one. The third argument to the LAG() function is optional and stands for the default value for the first row.
The OVER clause specifies the window frame. In other words, how to apply the window function. We do not have a PARTITION BY subclause, so the function is applied to the entire table. We only order records by year_driver_churned value.
SELECT year_driver_churned,
          COUNT(*) AS n_churned,
          LAG(COUNT(*), 1, '0') OVER (ORDER BY year_driver_churned) AS n_churned_prev
   FROM
     (SELECT DATE_PART('year', end_date::date) AS year_driver_churned
      FROM lyft_drivers
      WHERE end_date IS NOT NULL) base
   GROUP BY year_driver_churned
   ORDER BY year_driver_churned ASC
3. Create a text value to describe change
The previous query returns three of the four necessary values for the final answer - year, churn for that year, and churn for the previous year.
We should SELECT all three values from the result of the query.
Finally, we need to generate the fourth value - a text to describe changes in churn number. We can use a CASE expression to compare churn rates and return corresponding text.
SELECT *,
       CASE
           WHEN n_churned > n_churned_prev THEN 'increase'
           WHEN n_churned < n_churned_prev THEN 'decrease'
           ELSE 'no change'
       END
FROM
  (SELECT year_driver_churned,
          COUNT(*) AS n_churned,
          LAG(COUNT(*), 1, '0') OVER (
                                      ORDER BY year_driver_churned) AS n_churned_prev
   FROM
     (SELECT DATE_PART('year', end_date::date) AS year_driver_churned
      FROM lyft_drivers
      WHERE end_date IS NOT NULL) base
   GROUP BY year_driver_churned
   ORDER BY year_driver_churned ASC) calc
Try running the query to see if it returns the expected answer.
Output
The answer to this data analytics interview question should contain four values: years (ordered in ascending order), drivers churned for this year, for the previous year, and text to represent changes in the churn rate.
Question 2: Finding Minimum, Average, and Maximum Prices And Working With Strings
Last Updated: February 2018
You are given a table named airbnb_host_searches that contains data for rental property searches made by users. Determine the minimum, average, and maximum rental prices for each popularity-rating bucket. A popularity-rating bucket should be assigned to every record based on its number_of_reviews (see rules below).
The host’s popularity rating is defined as below: • 0 reviews: "New" • 1 to 5 reviews: "Rising" • 6 to 15 reviews: "Trending Up" • 16 to 40 reviews: "Popular" • More than 40 reviews: "Hot"
Tip: The id column in the table refers to the search ID.
Output host popularity rating and their minimum, average and maximum rental prices. Order the solution by the minimum price.
Link to the question: https://platform.stratascratch.com/coding/9632-host-popularity-rental-prices
Understand the Question
In this data analytics interview question, Airbnb interviewers want us to calculate pricing differences between established and new hosts on its platform.
In data analytics and many of its sub categories (cost analytics, revenue analytics, inventory management) you’ll often have to aggregate data for groups based on the company's internal categories and definitions. For example, while doing revenue analytics, you may need to compare revenue from loyalty program members vs regular users.
Also, not all data in databases is numerical. Data analysts often have to work with textual data. This question is a great example for that, because we’ll need to concatenate several string values into one.
Available data
To answer this question, we need to work with the airbnb_host_searches table. It has 20 columns.
When doing advanced data analytics, sometimes you have to sort through a lot of unnecessary information to find important pieces of data.
Let’s look at the table and identify important columns.
The question tells us to output minimum, maximum and average prices, so the price column is most likely important
- number_of_reviews values will be used to define host categories, so they are also important.
- We need to concatenate price, room_type, host_since, zipcode, number_of_reviews values to create unique identifier for each host
Logical Approach
The question asks us to find minimum, average and maximum prices for hosts with different numbers of reviews. We will need to categorize hosts based on the number of reviews.
Also there is no unique identifier for hosts. id values identify user searches. The question tells us to create a new id value by concatenating the following values: price, room_type, host_since, zipcode, and number_of_reviews.
Two values are really important for answering this question - number of reviews and price of the rental. Both of these values are already in the table, but the question also tells us to generate a new value to identify each host.
Next, we create a new value - host category depending on the number of reviews. We can use the CASE expression to evaluate number_of_reviews and return corresponding text value (‘new’, ‘rising’ and so on). This query should also return the corresponding price for each property.
At this point, every record contains two values - host category and rental price. We can group hosts by category and use MIN(), MAX(), and AVG() aggregate functions to find the lowest, highest and average prices for each group.
Write The Code
1. List hosts with the corresponding number of reviews and price
The table contains much information. Two values are essential for finding an answer - number_of_reviews, and price. We should SELECT these values.
The question also tells us to create a new value to identify each host. To do this, we concatenate price, room_type, host_since, zipcode, and number_of_reviews values.
We use the DISTINCT clause to make sure host_id values are unique.
SELECT DISTINCT CONCAT(price, room_type, host_since, zipcode, number_of_reviews) AS host_id,
          number_of_reviews,
          price
   FROM airbnb_host_searches
In the next step, we’ll write this query as a CTE and define the host categories.
2. Define host categories
We need to work with the result of the query from step 1.
First, we need a CASE expression that looks at the number of reviews and returns one of these values: ‘New’, ‘Rising’, ‘Trending Up’, ‘Popular’, and ‘Hot’.
Save the result of the CASE expression as ‘host_popularity’.
We also need to SELECT price values to find minimum, maximum, and average prices for each host category.
WITH hosts AS
  (SELECT DISTINCT CONCAT(price, room_type, host_since, zipcode, number_of_reviews) AS host_id,
          number_of_reviews,
          price
   FROM airbnb_host_searches)

SELECT CASE
              WHEN number_of_reviews = 0 THEN 'New'
              WHEN number_of_reviews BETWEEN 1 AND 5 THEN 'Rising'
              WHEN number_of_reviews BETWEEN 6 AND 15 THEN 'Trending Up'
              WHEN number_of_reviews BETWEEN 16 AND 40 THEN 'Popular'
              WHEN number_of_reviews > 40 THEN 'Hot'
          END AS host_popularity,
          price
   FROM hosts
3. Find minimum, maximum, and average prices for each category of hosts
Let’s SELECT host_popularity values and group records by this value.
Then use MIN(), MAX(), and AVG() aggregate functions to find the lowest, highest, and average prices for each group.
The query from the previous step will now become a subquery in the FROM clause.
WITH hosts AS
  (SELECT DISTINCT CONCAT(price, room_type, host_since, zipcode, number_of_reviews) AS host_id,
          number_of_reviews,
          price
   FROM airbnb_host_searches)
SELECT host_popularity AS host_pop_rating,
       MIN(price) AS min_price,
       AVG(price) AS avg_price,
       MAX(price) AS max_price
FROM
  (SELECT CASE
              WHEN number_of_reviews = 0 THEN 'New'
              WHEN number_of_reviews BETWEEN 1 AND 5 THEN 'Rising'
              WHEN number_of_reviews BETWEEN 6 AND 15 THEN 'Trending Up'
              WHEN number_of_reviews BETWEEN 16 AND 40 THEN 'Popular'
              WHEN number_of_reviews > 40 THEN 'Hot'
          END AS host_popularity,
          price
   FROM hosts) a
GROUP BY host_pop_rating
Run the query to see its result.
Output
The query should return four columns: host category and minimum, maximum, and average prices for that category.
Python Data Analytics Interview Questions


Python is another extremely important skill for doing data analytics.
Question 3: Potentially overbudget projects
Last Updated: November 2020
You are given a set of projects and employee data. Each project has a name, a budget, and a specific duration, while each employee has an annual salary and may be assigned to one or more projects for particular periods. The task is to identify which projects are overbudget. A project is considered overbudget if the prorated cost of all employees assigned to it exceeds the project’s budget.
To solve this, you must prorate each employee's annual salary based on the exact period they work on a given project, relative to a full year. For example, if an employee works on a six-month project, only half of their annual salary should be attributed to that project. Sum these prorated salary amounts for all employees assigned to a project and compare the total with the project’s budget.
Your output should be a list of overbudget projects, where each entry includes the project’s name, its budget, and the total prorated employee expenses for that project. The total expenses should be rounded up to the nearest dollar. Assume all years have 365 days and disregard leap years.
Link to the question: https://platform.stratascratch.com/coding/10304-risky-projects
Understand the Question
Data analysts often need to analyze internal company data. In this case, we have to analyze data in three separate tables that contain information about projects, employees, and the assignment of employees to projects. Based on our analysis, we must determine whether the total salary of employees assigned to the project exceeds the budget.
Available data
We are given three tables to find the answer. One contains information about projects, one about employees, and a junction table that aligns projects with employees.
We’ll use the id value to combine linkedin_projects with the other two tables.
- We also need to find the difference between start_date and end_date to calculate project expense for the length of the project.
- We’ll compare project expenses with a budget value.
- Project name (title column) is also important to find total yearly expenses for the project.
- emp_id identifies employees.
- project_id identifies projects.
This is a junction table. Its only purpose is to align employees with projects.
- id identifies employees.
- first_name and last_name values are not important.
- To find total yearly expenses for the project, we need to add up salary values for each project.
Logical Approach:
We have information about projects and employees, and need to find projects where the expense is higher than budget.
To calculate project expenses, we need to add up salaries of every employee assigned to the project. First, we need to use the merge() function to combine three tables.
Most projects don’t last exactly one year. We need to calculate expenses for a specific duration of the project. To do this, calculate the difference between start_date and end_date values.
To calculate expenses specific duration of a project, first we divide total yearly expense by 365 to find daily expenses. Then multiply that by the number of days the project lasts.
Finally, to answer the question, we should return projects with higher expenses than the allocated budget.
To do this, we should calculate the difference between real expenses (considering project’s duration) and allocated budget. The project is over budget if that difference is positive (higher than 0).
We need to return the name, budget, and expenses for the duration of these projects.
Write the Code
1. Combine three tables
We need to combine three tables - linkedin_projects (contains information about projects), linkedin_emp_projects (relationship between employees and projects), linkedin_employees (information about employees).
import pandas as pd
import numpy as np
from datetime import datetime

df = pd.merge(linkedin_projects, linkedin_emp_projects, how = 'inner',left_on = ['id'], right_on=['project_id'])

df1 = pd.merge(df, linkedin_employees, how = 'inner',left_on = ['emp_id'], right_on=['id'])
We use the merge() function to combine linkedin_projects and linkedin_emp_projects and store the combined result. Then use merge() to also combine the linkedin_employees table.
In both cases, we use inner join to combine information for projects and employees who work on those projects. We do not need to return projects without employees, or information about employees that do not work on any of the projects in the linkedin_projects table.
As a result, the df1 variable contains information about projects as well as employees. Run the query to see the output.
2. Calculate expenses for duration of the project
To do this, first we need to find the duration and total yearly salary cost.
We also need to calculate project duration in days. To do this, find the difference between end_date and start_date values.
Next, let’s find the combined yearly salaries of all employees assigned to each project. Group records by project title and aggregate salary values.
df1['project_duration'] = (pd.to_datetime(df1['end_date']) - pd.to_datetime(df1['start_date'])).dt.days
df_expense = df1.groupby('title')['salary'].sum().reset_index(name='expense')
df_budget_expense = pd.merge(df1, df_expense, how = 'left',left_on = ['title'], right_on=['title'])
df_budget_expense['prorated_expense'] = np.ceil(df_budget_expense['expense']*(df_budget_expense['project_duration'])/365)
Then merge the combined table (df1) with df_expense to have details of projects, employees, and yearly project expenses in one table. We use left join to return information about all projects, even if we don’t have a budget for that project.
Finally, we can calculate expenses for the duration of the project. Multiply the project duration (in days) by total yearly expenses and divide it by 365.
You should give the value a descriptive name, like prorated_expense.
Use np.ceil() to round expenses to the next dollar amount, as it is specified in the question description.
3. Output projects that are over budget
The question tells us to output projects where prorated expenses exceed the budget.
First, we should find a difference between prorated_expense and budget values. Then create a filtered array df_over_budget to store projects where the difference is positive (above 0).
Finally, output title, budget, and prorated_expense values from the filtered table.
df_budget_expense['budget_diff'] = df_budget_expense['prorated_expense'] - df_budget_expense['budget']
df_over_budget = df_budget_expense[df_budget_expense["budget_diff"] > 0]
result = df_over_budget[['title','budget','prorated_expense']]
result = result.drop_duplicates().sort_values('title')
We use the drop_duplicates() to remove duplicate records and sort_values() to order projects by title.
The final answer should look like this:
import pandas as pd
import numpy as np
from datetime import datetime

df = pd.merge(linkedin_projects, linkedin_emp_projects, how = 'inner',left_on = ['id'], right_on=['project_id'])
df1 = pd.merge(df, linkedin_employees, how = 'inner',left_on = ['emp_id'], right_on=['id'])
df1['project_duration'] = (pd.to_datetime(df1['end_date']) - pd.to_datetime(df1['start_date'])).dt.days
df_expense = df1.groupby('title')['salary'].sum().reset_index(name='expense')
df_budget_expense = pd.merge(df1, df_expense, how = 'left',left_on = ['title'], right_on=['title'])
df_budget_expense['prorated_expense'] = np.ceil(df_budget_expense['expense']*(df_budget_expense['project_duration'])/365)
df_budget_expense['budget_diff'] = df_budget_expense['prorated_expense'] - df_budget_expense['budget']
df_over_budget = df_budget_expense[df_budget_expense["budget_diff"] > 0]
result = df_over_budget[['title','budget','prorated_expense']]
result = result.drop_duplicates().sort_values('title')
Run the query to see if it returns the right answer.
Output
The query should return title (project name), budget, and prorated_expense (expense based on the duration of the project). Expenses should be higher than the budget.
Question 4: Counting Instances and Working With Strings
Last Updated: February 2018
You're given a dataset of searches for properties on Airbnb. For simplicity, let's say that each search result (i.e., each row) represents a unique host. Find the city with the most amenities across all their host's properties. Output the name of the city.
Link to the question: https://platform.stratascratch.com/coding/9633-city-with-most-amenities
Understand Question
When doing data analytics, sometimes you need to work with millions of records that describe a specific product, event, action, or any other instance. During an interview, you may be asked to aggregate records to get insights about a certain segment or category, e.g., the number of products, buyers, orders, etc.
In this data analytics interview question, we need to aggregate individual search results to find the number of amenities in each city and then return the city with the most amenities.
We’ll again need to work with string values, but this time in Python.
Available data
We are given information about Airbnb searches and have to perform data analytics to find the city with the most amenities.
Let’s look at the airbnb_search_details table. It contains many values.
Out of these values, we’ll need only two:
- amenities contains the list of amenities for every individual search result.
- We need to group records by city
Logical Approach
This is a little challenging. Values in the amenities column are lists of amenities for each host. We need to find the number of amenities by city across all host properties.
First, we need to find the number of amenities for each host. Save this number. Then group hosts by city and find the total number of amenities by all hosts in a specific city.
Finally, we can use the MAX() aggregate function to find the city with the highest number of amenities.
Write the Code
1. Find the number of amenities for each host
The question tells us to treat each row as if it represents one host. Amenities value is an object that contains the list of all amenities.
Each string in the column amenities is separated by a comma, so we can simply convert the amenities to a string and count the instances of a comma (‘,’) in the string.
Lists don’t have a comma at the beginning or the end. The number of items separated by a comma is the number of commas + 1.
import pandas as pd
import numpy as np

df = airbnb_search_details
df['amenities_count'] = df['amenities'].str.count(',')+1
2. Find the number of amenities in each city
Next, we need to use the df.groupby() function to group records by city values. Then use the agg() function to sum the total of amenities_count values for each group.
grouped_asd = df.groupby('city',as_index=False).agg({'amenities_count':'sum'})3. Return the city with the highest number of amenities
In the previous step, we created a grouped_asd variable that contains cities and their corresponding number of amenities.
We must filter the group_asd array to find the record with the highest amenities_count value. Then access the city value of that record.
max_city = grouped_asd[grouped_asd['amenities_count'] == max(grouped_asd['amenities_count'])]['city'].tolist()
result = max_city
Try running the query to see if it matches the expected outcome.
Output
Final answer should include a single value - the city with the highest number of amenities. Yes, it’s New York City.
Data Analytics Interview Questions on Probability and Statistics

When interviewing for a senior data analytics role, you might be asked about probability and statistics.
We will here focus on the non-coding statistical questions. However, you might also be required to show your statistical knowledge in Python, too. For that, we have a Python Cheat Sheet where you can find practical examples of doing summary statistics in Python, as well as other helpful Python concepts.
Statistics Question: Analyzing Skewed Data
Analysts sometimes need to work with data with an uneven distribution where mode, median, and mean values are far apart from one another.

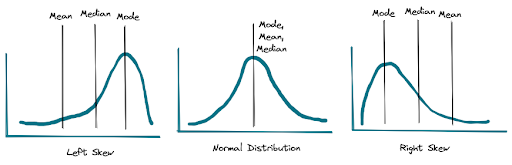
Skewed data can prevent us from doing (quality) statistical analysis. Important statistical tools like Z-test, t-test, and ANOVA work under the assumption that the error is normally distributed.
When interviewing for a senior position, interviewers might ask you to explain your approach to working with skewed data to get accurate results.
Let’s look at the specific wording of the question:
Link to the question: https://platform.stratascratch.com/technical/2332-skewed-data
Answer:
There are two ways to approach skewed data. One is to transform it into the square root or log representations. This eliminates the worst side effects of skewed data. Then we can conduct statistical tests as if it’s normally distributed.
The second is to conduct non-parametric statistical tests. This is especially effective for small samples of data. When working with skewed data, it’s better to make inference about the median, not the mean.
The most useful non-parametric statistical tests are: the Mann-Whitney test, Friedman test, Spearman rank correlation, and Kruskall-Walis test.
Probability Question: Expected Cost of Promotion
Data analysts sometimes need to use probability concepts and formulas to measure and predict things that haven’t yet happened.
This data analytics interview question is a prime example. Ride-hailing company Lyft plans to run a promotion, and it’s your job to estimate the cost of the promotion.
The company plans to give out $5 discounts to its riders. You need to calculate the total cost of the campaign.
Let’s look at the specific wording of the question:
Last Updated: October 2021
A $5 discount coupon is given to N riders. The probability of using a coupon is P. What is the expected cost for the company?
Link to the question: https://platform.stratascratch.com/technical/2310-cost-of-discount-coupons
Answer:
We’ll use the probability distribution function to answer this question. The output of the function depends on two variables: P and N.
P is the probability of customers using the coupon. The specific number is not given, so we can simply use P in the formula.
N is the number of riders who receive the discount.
A general formula for calculating the dollar amount of N number of customers using the coupon with a probability of P would be:
E(x) = N * P
But this doesn’t account for the dollar value of each discount, which is 5. So the final answer would be:
E(x) * 5 = N * P * 5
Read Probability and Statistics Interview Questions for more.
Summary
Data analytics is an important process of finding stories in seemingly meaningless series of numbers, texts, dates, and other bits of data. Executives at big companies often use these insights to make important decisions.
In this article, we looked at advanced data analytics interview questions you can expect when interviewing for data analyst positions.
If you enjoyed going through these data analytics interview questions, you can find many more on the StrataScratch platform. There are hundreds of coding and non-coding challenges of varying difficulty levels. The platform allows you to practice writing SQL and Python code, as well as important concepts of probability and statistics.
Share