Python Cheat Sheet – Technical Concepts for the Job Interview


Categories:
 Written by:
Vivek Sankaran
A quick reference Python cheat sheet for learning the common tasks. Data structures, functions, data wrangling – the basics any data scientist should know.
Python is among the most popular programming languages for Data Science. Along with SQL and R, most data science roles will require an above-average proficiency in Python. As a data analyst, you might be able to do most of your work in SQL. However, if you want to move to higher-paying roles like a Data Engineer or Data Scientist and work with complex tasks like building data pipelines or deal with Machine Learning Algorithms and Statistics, you must master Python. To understand the kind of questions asked in Data Science Interviews, have a look at our comprehensive article on Python Interview Questions and Answers. We also have a framework and step-by-step guide to solving Python Coding Interview questions.
In this Python cheat sheet, we will use basic Python data structures, control program flow, and define and use functions. We will perform basic data wrangling tasks like joining data sets, splitting data into groups, and aggregating data to generate summary statistics. You should NOT use Pandas or NumPy libraries to answer these questions. Later on, we will solve these exercises using the Pandas (and NumPy) libraries. We will be avoiding Pandas initially to make sure that you understand how even basic Python data structures like lists, dictionaries, tuples, and sets can be used for day-to-day data wrangling tasks. Further, there might be cases when one may not have access to the Pandas library because of admin permissions. In such a scenario, too, one should be able to perform these tasks.
Datasets
We will be using the EU referendum results data. There are three files. You can make use of the starter notebook to try these problems.
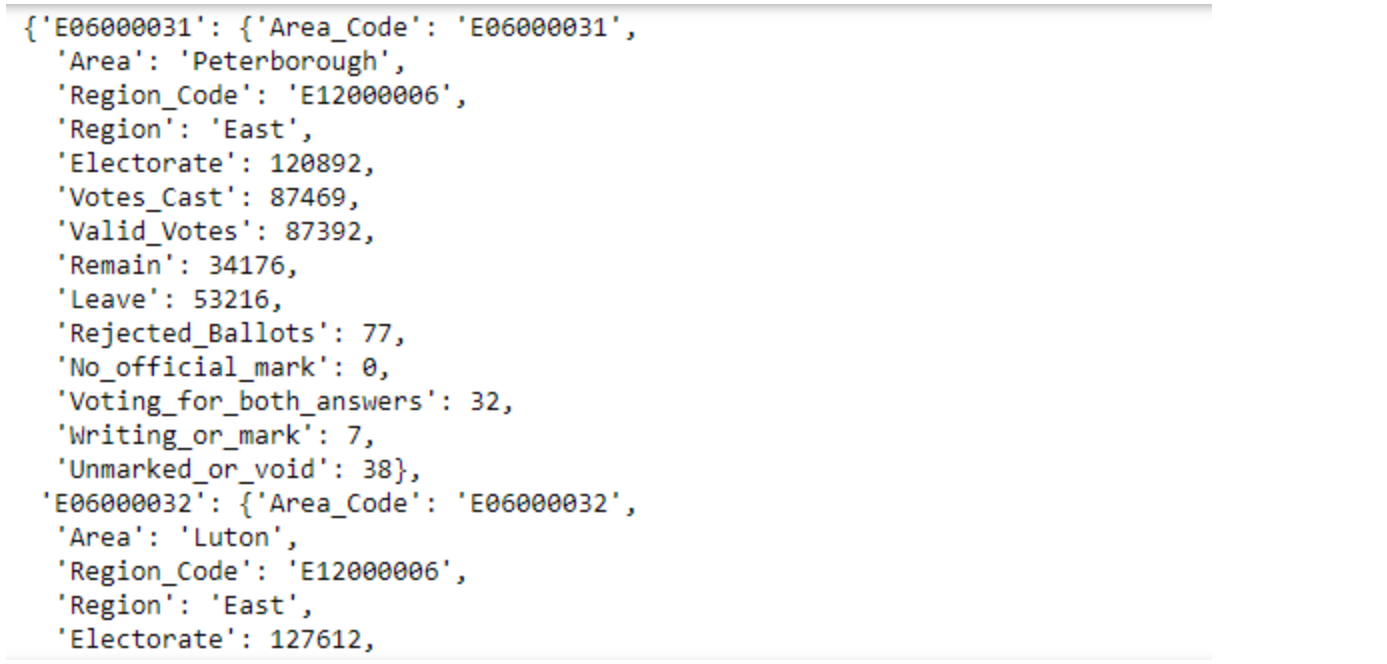
The first file, named uk_demo.json, contains information about the area, the region the area belongs to, and the electorate in the area. The data is presented in the following manner.


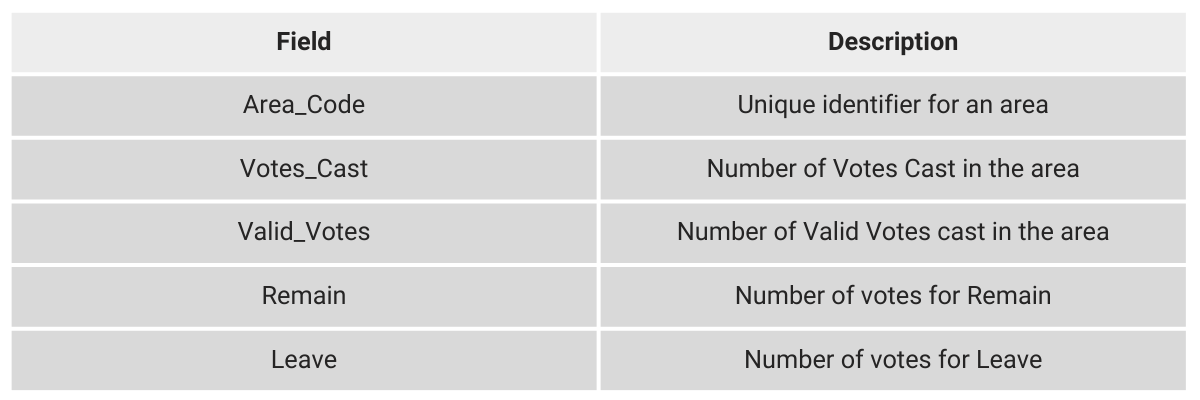
The second file, named uk_results.json, contains the results of the voting for each area. The data therein is arranged thus.
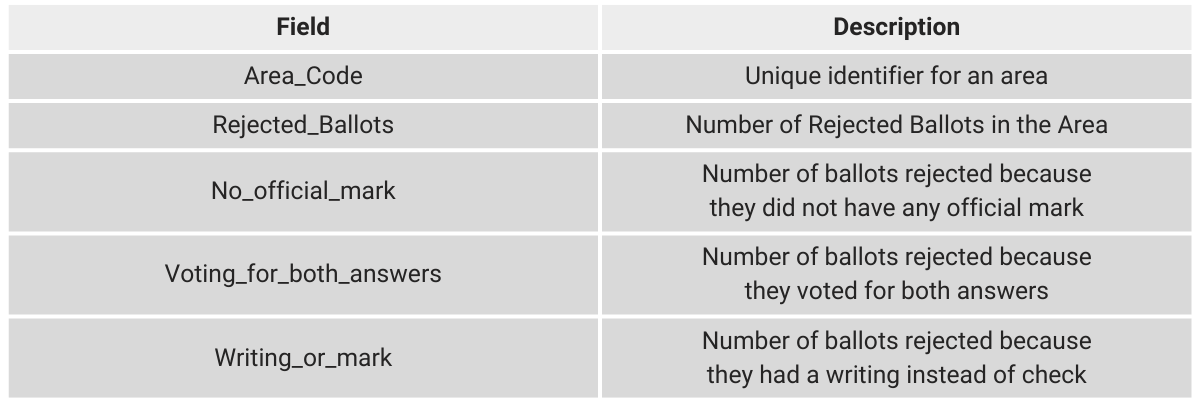
We also have additional info about the rejected votes in each region in the third dataset - uk_rejected_ballots.json
The data is presented in the following manner.
Reading Data Into Python
Before we start solving these problems in this python cheat sheet, we need to read data into Python. One way to do this is to download the file locally and then read it. A simpler way is to use the requests module. The requests module is the most widely used Python module for HTTP. We can transmit data securely using security protocols and user authentication easily using the requests module. For the purpose of this exercise, we will simply use the requests module to read the JSON file and load it into a Python list.
import requests
uk_demo_src = r"https://raw.githubusercontent.com/viveknest/statascratch-solutions/main/UK%20Referendum%20Data/uk_demo.json"
f = requests.get(uk_demo_src)
uk_demo = f.json()
uk_demo[:5]
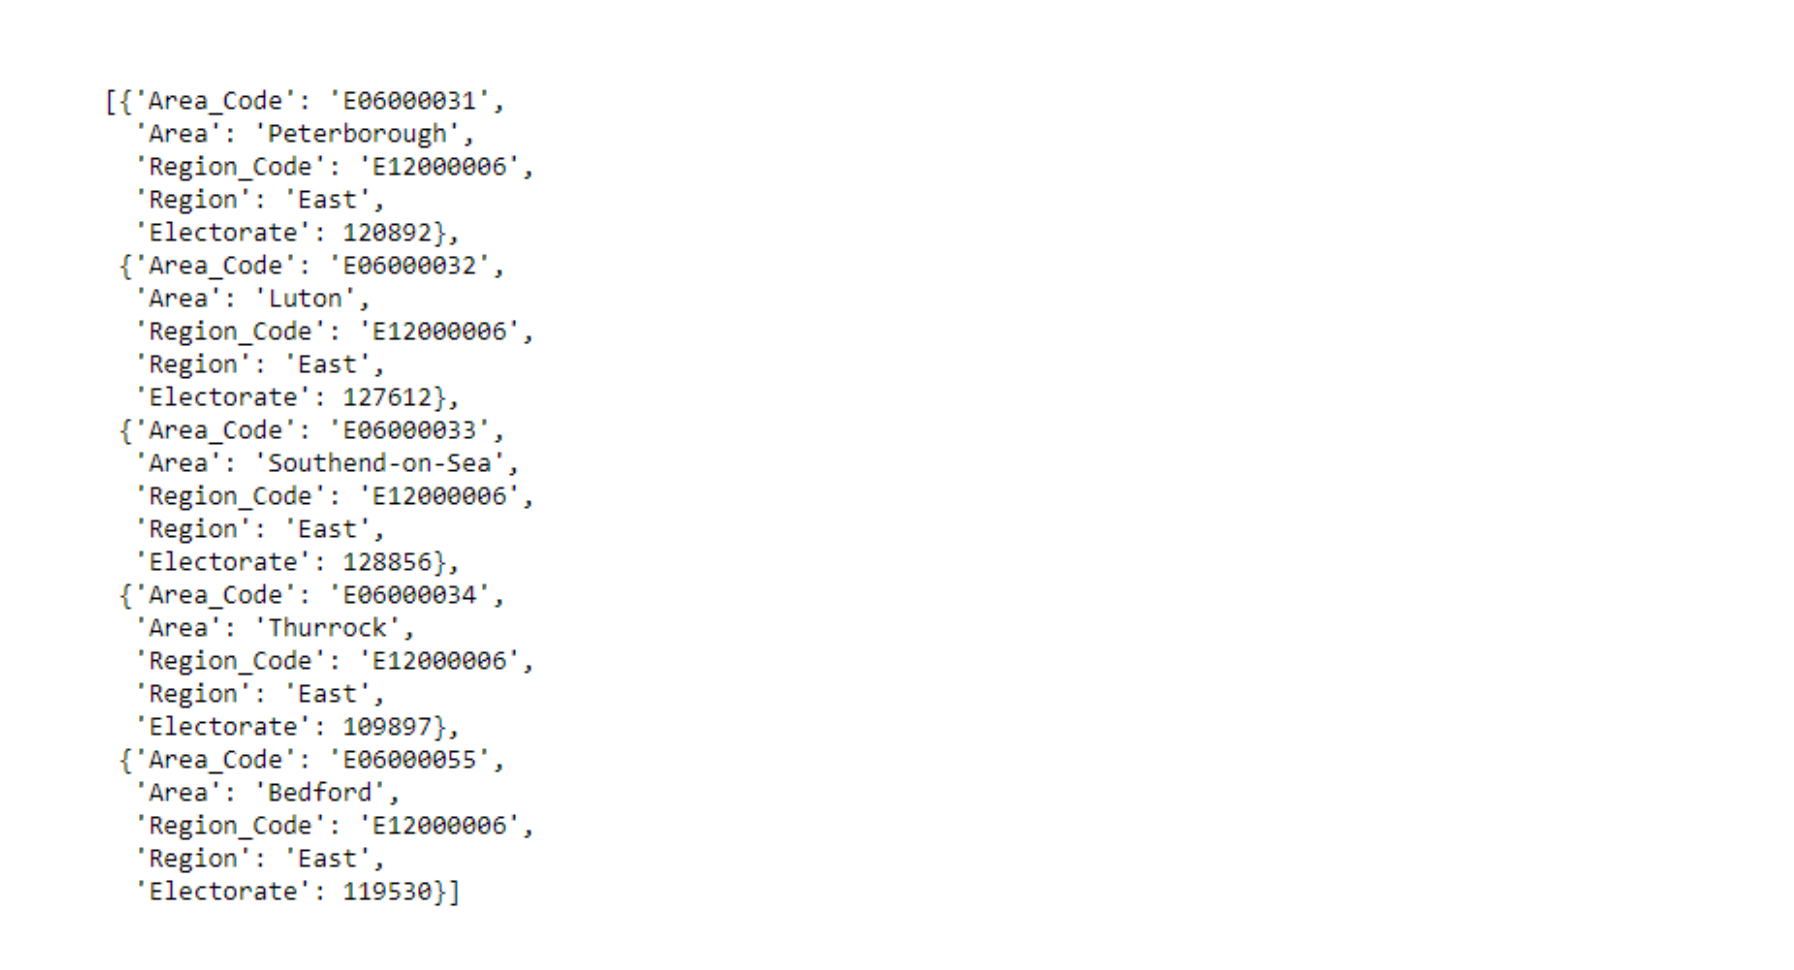
As you can see, the output is a list of dictionaries. We can do the same for the other two files as well.
uk_results_src = r"https://raw.githubusercontent.com/viveknest/statascratch-solutions/main/UK%20Referendum%20Data/uk_results.json"
f = requests.get(uk_results_src)
uk_results = f.json()
uk_results[:5]

uk_rejected_src = r"https://github.com/viveknest/statascratch-solutions/raw/main/UK%20Referendum%20Data/uk_rejected_ballots.json"
f = requests.get(uk_rejected_src)
uk_rejected = f.json()
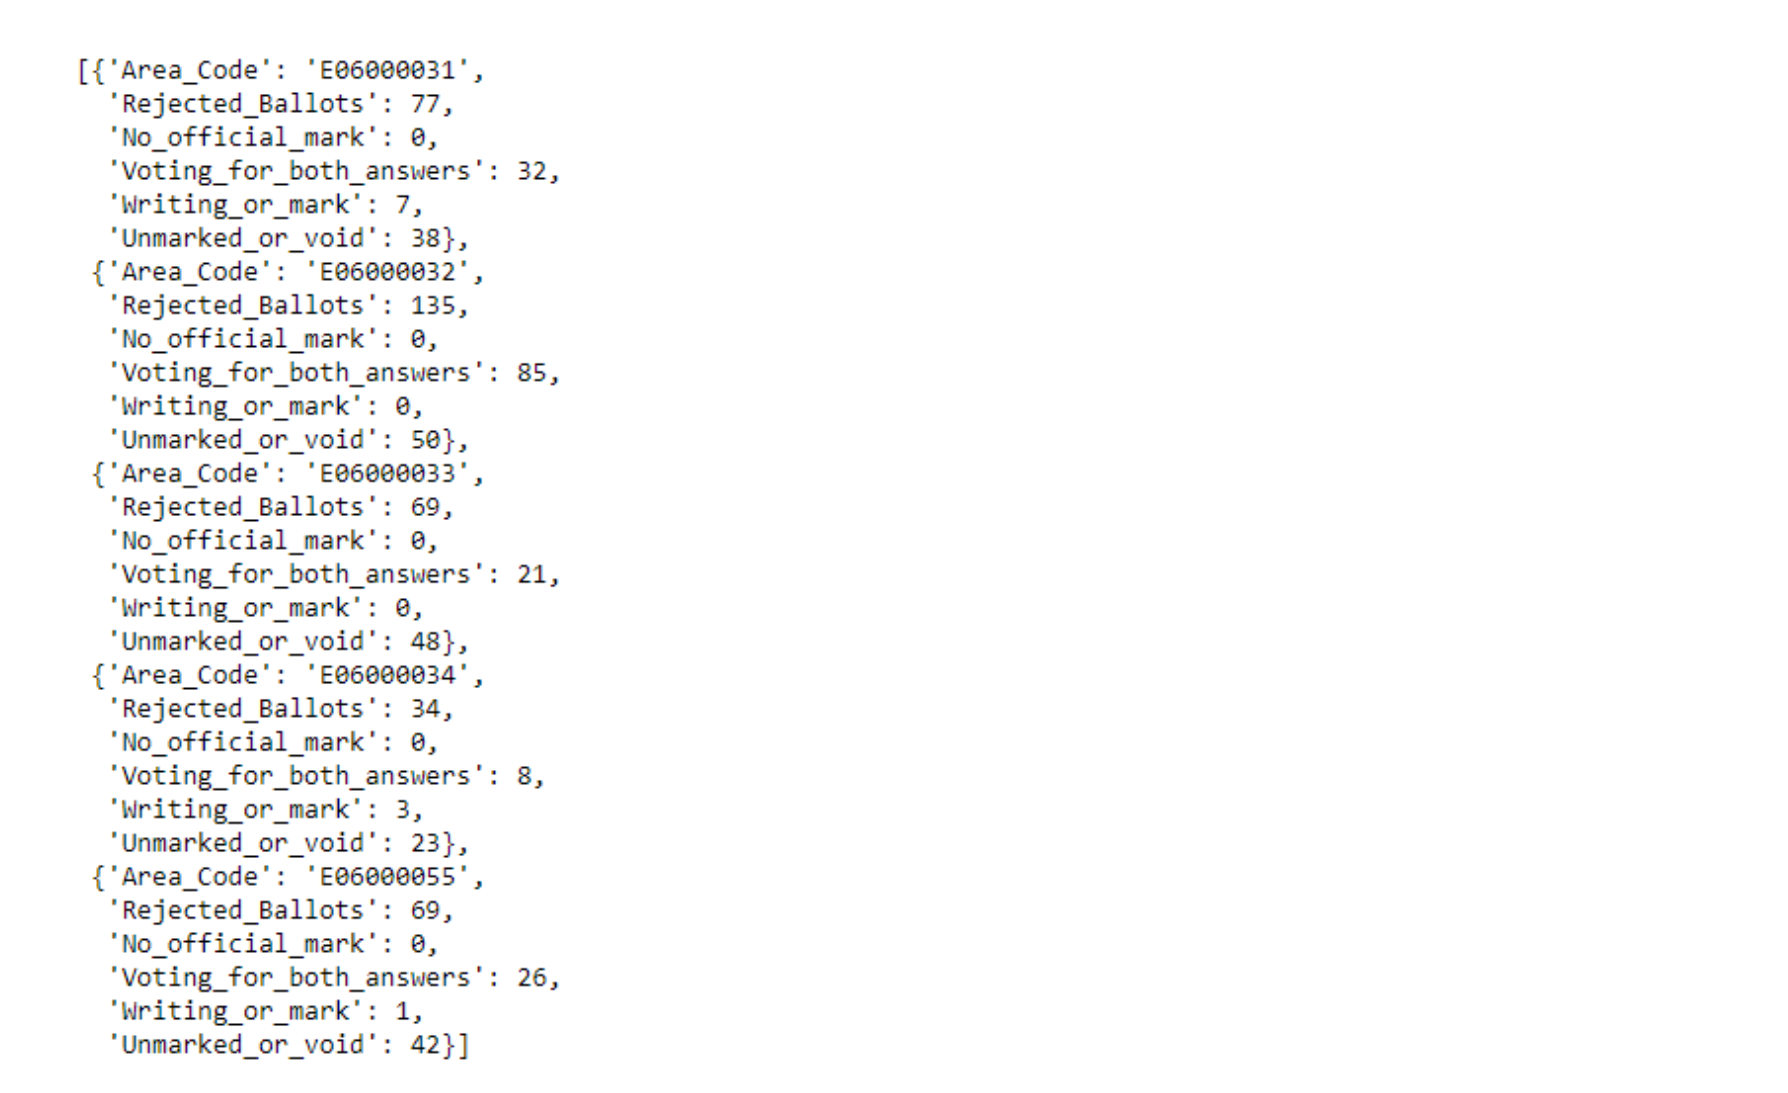
uk_rejected[:5]
Join the Datasets
First, in this Python cheat sheet, we need to “merge” the three lists using the Area_Code as the key. To accomplish this merging, we created a nested dictionary keeping the merge field as the key for the top-level dictionary. Since we will do this for multiple datasets, we create a simple function.
# Convert lists into a dictionary of dictionaries
def dict_convert(data, key = 'Area_Code'):
    out_dict = {}
    for row in data:
        out_dict.update({
            row[key]: row
        })
    return out_dict
We can simply pass each of the lists to this function and get a nested dictionary.
uk_demo_dict = dict_convert(uk_demo)
uk_demo_dict

We repeat this process for the other lists as well.
uk_results_dict = dict_convert(uk_results)
uk_rejected_dict = dict_convert(uk_rejected)
We now have the key of each of these dictionaries as the merge key. We can simply create a merged dictionary by accessing the nested dictionary using Area_Code, which is the key of the outer dictionary in each of the three dictionaries.
merged_dict = {}

for key in uk_demo_dict.keys():
    merged_dict.update({
        key: {**uk_demo_dict[key], **uk_results_dict[key], **uk_rejected_dict[key]}
    })
merged_dict
And there we have the three datasets merged into a single dictionary. If we want to get a list again, we can use “unnest” the dictionary into a list.
merged_list = [v for k,v in merged_dict.items()]
merged_list

Summary Statistics
The next in this Python cheat sheet is to find the maximum, minimum, median, 25th, and 75th percentile values for
- Electorate
- Number of Votes Cast
- Number of Valid Votes
- Number of Remain Votes
- Number of Leave Votes
- Number of Rejected Votes
Since we have to repeat the same process multiple times, we will create a function that generates the summary statistics. We use a variable parameter to specify the variable for which we need to find the summary statistic. Let us start off by defining the function. We would be passing the merged_dict that we had generated earlier as the source data.
def summ_stats(source_data, variable):
    return None
We need to extract the data points for the relevant variable. Since we would like to perform mathematical operations on these data points, we will use a list. We also sort the list so as to calculate the median, 25th, and 75th percentiles easily.
def summ_stats(source_data, variable):
    # Get the variable data
    out_list = []
    for k,v in source_data.items():
        out_list.append(v[variable])
    out_list.sort()

    return out_list

summ_stats(merged_dict, 'Electorate')

We start calculating the summary statistics now. We will output a dictionary with all these statistics. Finding minimum and maximum values is pretty easy. We simply use the built-in min() and max() functions.
def summ_stats(source_data, variable):
    # Get the variable data
    out_list = []
    for k,v in source_data.items():
        out_list.append(v[variable])
    out_list.sort()
    max_value = max(out_list)
    min_value = min(out_list)


    out_dict = {
        'Max': max_value
        , 'Min': min_value
    }

    return out_dict

summ_stats(merged_dict, 'Electorate')
Median
Median is the middle value of a dataset. If the number of elements (n) is odd, then the median is the following element.
If the n is even, then the median is the average of the following elements
and
To implement this in Python, we first need to find the number of elements in the list. We can do this by finding the length of the list using the len() function. Then we check if the number is odd or even. Here is a simple implementation of the odd / even checker.
def odd_even(number):
    # This function will return True if the number is even, otherwise it will return false
    if number // 2 == number / 2:
        return True
return Falseodd_even(4)
odd_even(11)
We use the same logic to check if the number of elements is odd or even and then calculate the median as described above.
def summ_stats(source_data, variable):
    # Get the variable data
    out_list = []
    for k,v in source_data.items():
        out_list.append(v[variable])
    out_list.sort()
    max_value = max(out_list)
    min_value = min(out_list)
    num_items = len(out_list)
    # Median Value
    if num_items //2 == num_items / 2:
        mid_value1 = num_items //2 - 1
        mid_value2 = num_items //2
        median_value = (out_list[mid_value1] + out_list[mid_value2]) / 2
    else:
        mid_value = (num_items + 1) // 2 - 1
        median_value = out_list[mid_value]


    out_dict = {
        'Max': max_value
        , 'Min': min_value
        , 'Median' : median_value
    }

    return out_dict

summ_stats(merged_dict, 'Electorate')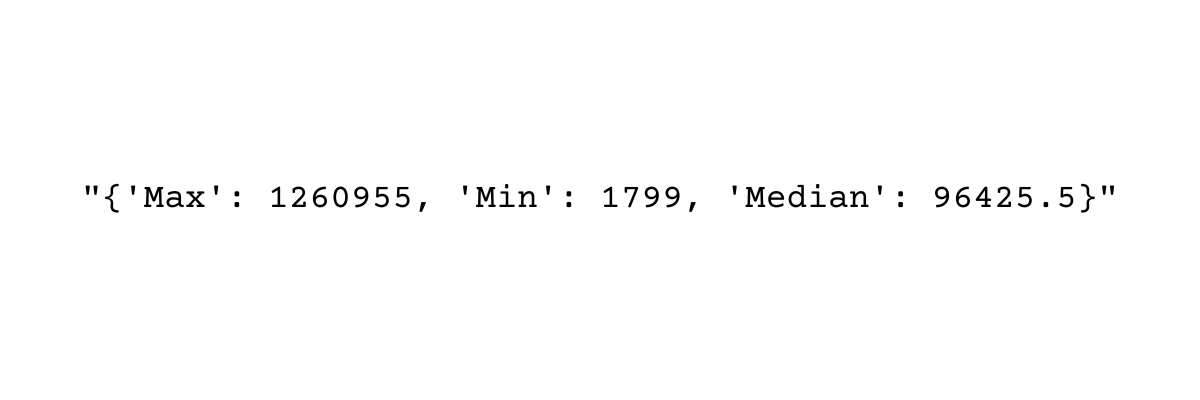
Note: We subtract 1 from each of the positions since Python is zero-indexed
Quartiles
Calculating the percentiles is a bit tricky. There are multiple options to choose from. We will be using the nearest rank method to calculate the percentiles. The location of the pth percentile value in an ordered dataset is given by
Where the below represents the ceiling function.
In simple terms, it rounds up a decimal to the least integer greater than or equal to x. To find the ceiling in Python, we can use the built-in function associated with all floating point values __ceil__()
The function can now be modified to incorporate the two quartiles.
def summ_stats(source_data, variable):
    # Get the variable data
    out_list = []
    for k,v in source_data.items():
        out_list.append(v[variable])
    out_list.sort()
    max_value = max(out_list)
    min_value = min(out_list)
    num_items = len(out_list)
    # Median Value
    if num_items //2 == num_items / 2:
        mid_value1 = num_items //2 - 1
        mid_value2 = num_items //2
        median_value = (out_list[mid_value1] + out_list[mid_value2]) / 2
    else:
        mid_value = (num_items + 1) // 2 - 1
        median_value = out_list[mid_value]

    # Quartiles, using the nearest rank method
    q1_rank = (num_items * 0.25).__ceil__() - 1
    q3_rank = (num_items * 0.75).__ceil__() - 1

    q1 = out_list[q1_rank]
    q3 = out_list[q3_rank]

    out_dict = {
        'N': num_items
        , 'Max': max_value
        , 'Min': min_value
        , 'Median' : median_value
        , 'q1' : q1
        , 'q3' : q3
    }

    return out_dict

summ_stats(merged_dict, 'Electorate')
We can find the summary statistics for the other variables as well.
summ_stats(merged_dict, 'Votes_Cast')
summ_stats(merged_dict, 'Valid_Votes')
summ_stats(merged_dict, 'Remain')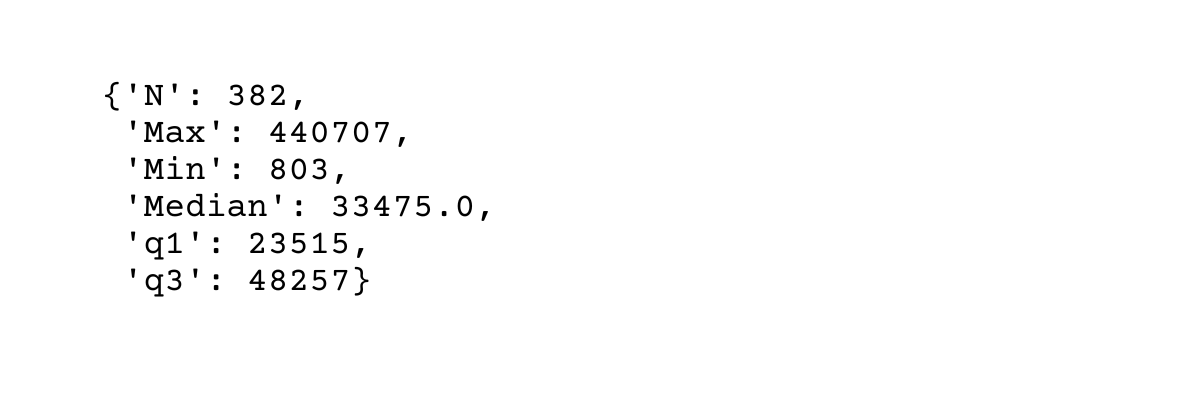
summ_stats(merged_dict, 'Leave')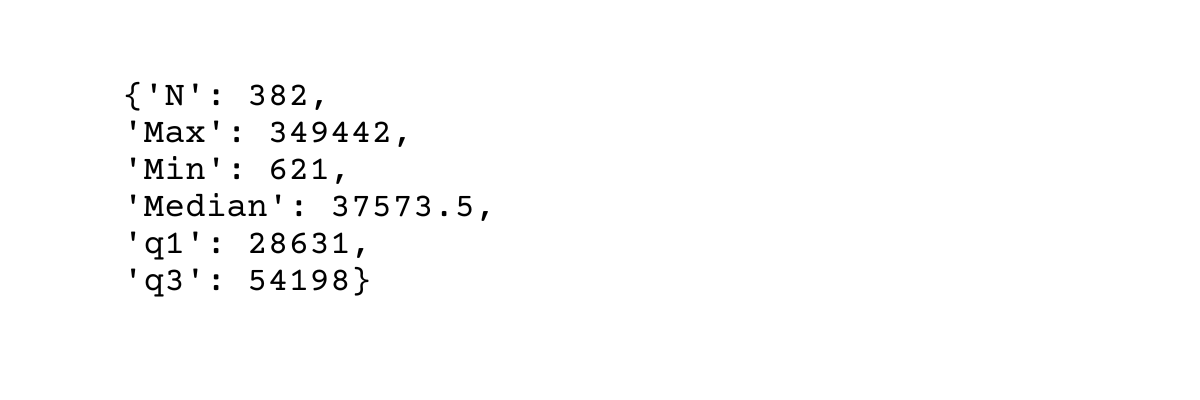
summ_stats(merged_dict, 'Rejected_Ballots')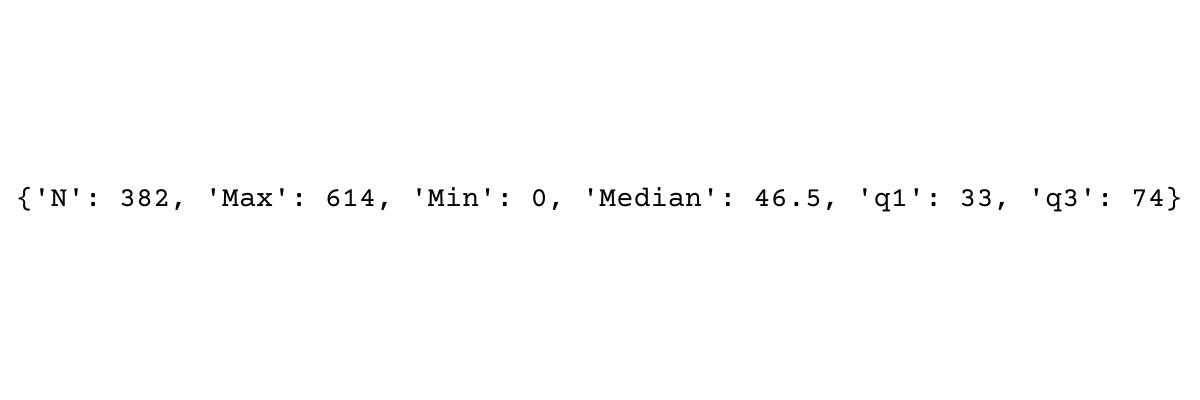
Find the Area with the highest and lowest electorates
The next is this Python cheat sheet is to find the area with the highest and lowest electorates, we will use the object properties for sorting. Let us use a simple example to illustrate the process. Suppose we have the following list.
sample_list = ['Alpha', 'Gamma', 'Beta', 'Zeta', 'Delta', 'Epsilon', 'Nu', 'Mu']
sample_list
We can sort the list in alphabetical order
sorted(sample_list)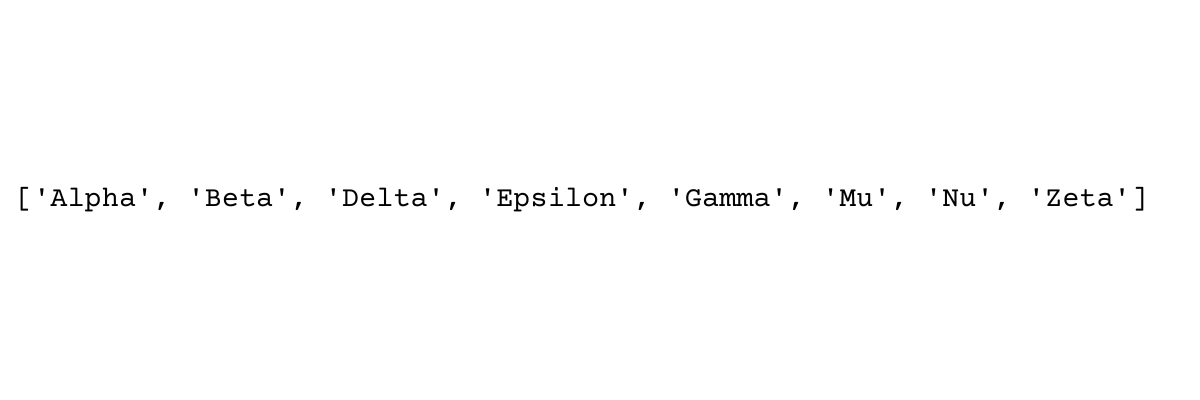
Or reverse alphabetical order
sorted(sample_list, reverse = True)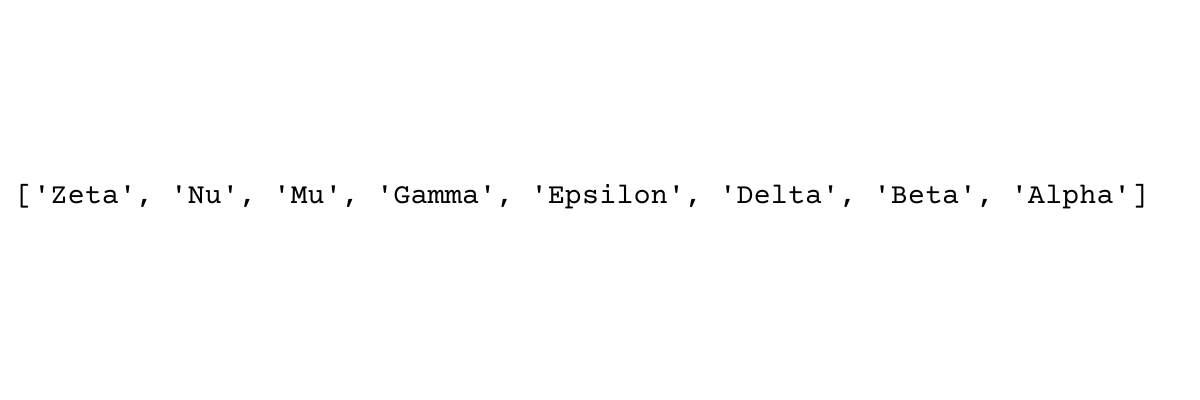
Suppose we want to sort by the properties of the list elements, let’s say we want to sort by the length of the string. We can use the key parameter and define a lambda function.
sorted(sample_list, key = lambda x: len(x))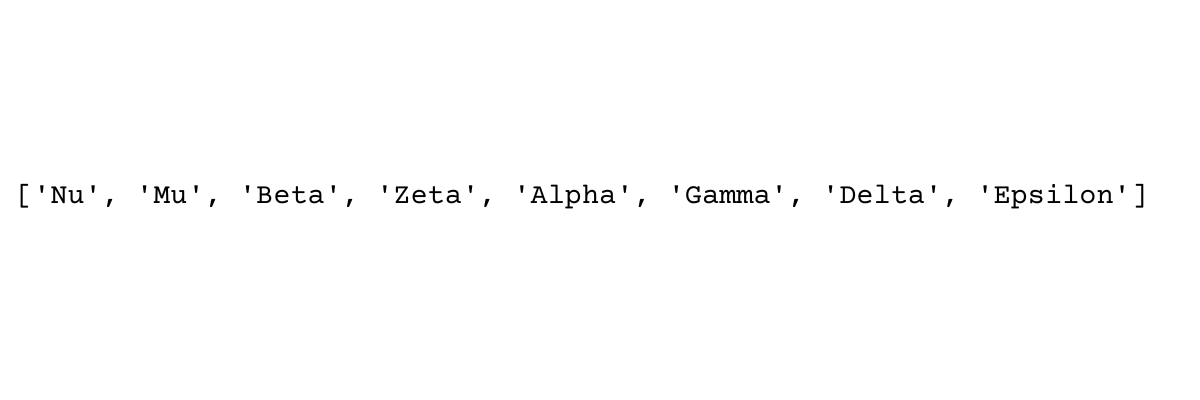
We can also sort by multiple levels. The following will sort based on the length of the string and then by alphabetical order.
sorted(sample_list, key = lambda x: (len(x), x))
We will now implement this on the merged list we had created earlier.
sorted(merged_list, key = lambda x:x['Electorate'])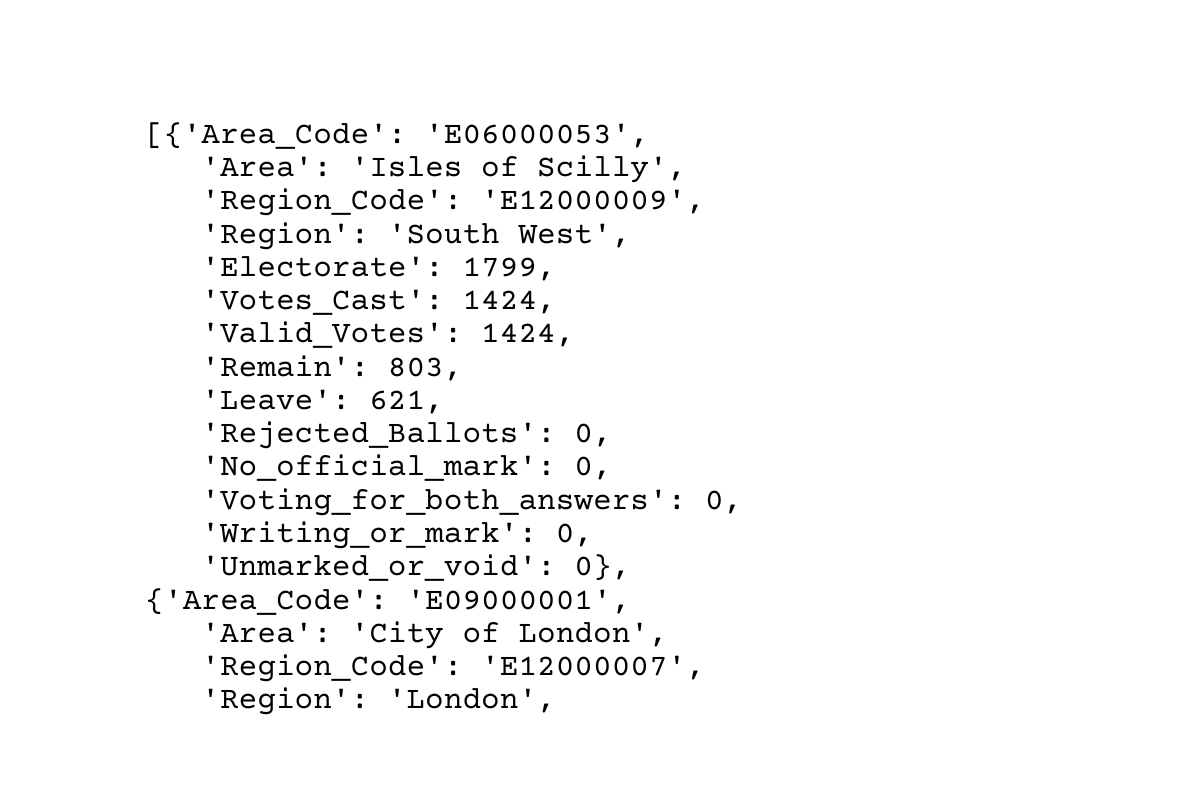
Since we need the one with the lowest electorate, we take the first element
sorted(merged_list, key = lambda x:x['Electorate'])[0]
From this we output the Area.
sorted(merged_list, key = lambda x:x['Electorate'])[0]['Area']
To get the Area with the highest electorate, we simply take the last element in the sorted list.
sorted(merged_list, key = lambda x:x['Electorate'])[-1]['Area']
Aggregation

Find the Region wise totals
We start off by getting all the regions. We do this by using a Python set.
regions = set([area['Region'] for area in merged_list])
regions
Now we iterate over the entire list and add totals region wise.
region_dict = {}
for region in regions:
    reg_sum = sum([area['Electorate'] for area in merged_list if area['Region'] == region])
    region_dict.update({region: reg_sum})

region_dict
Contribution of each region to the total
To calculate the contribution of each region, we first find the total. We can do this by adding up the region_dict values.
total = sum(region_dict.values())
total
We now calculate the contribution of the region’s electorate as a percentage of the total.
cont_dict = {}
for k,v in region_dict.items():
    cont_dict.update({k: v/total * 100})
cont_dict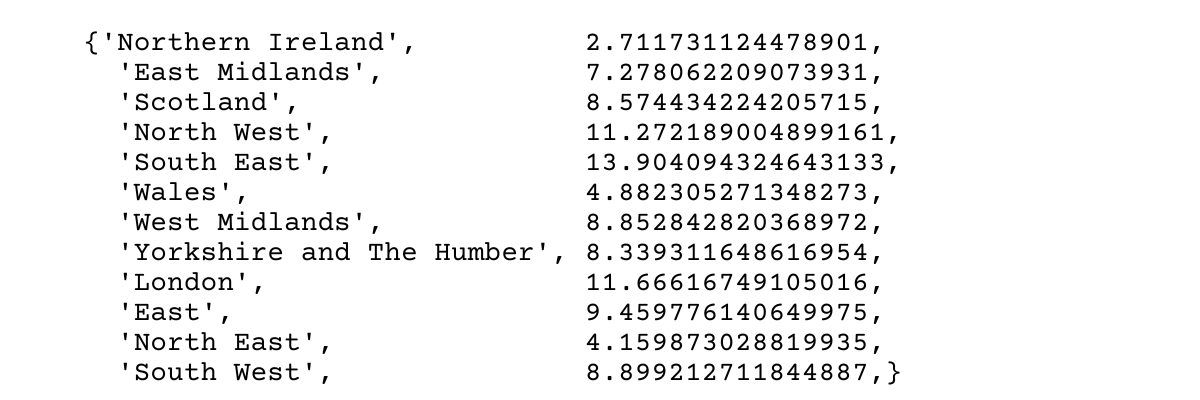
There we have it. We have performed the most common dataframe operations in Pandas without using the Pandas library. You can find the entire solved notebook here. Let us perform these operations using the Pandas library.
Pandas

The next is Pandas in this Python cheat sheet. The Pandas library provides us with numerous functions to manipulate structured data. It is the go-to library for data science operations and is also very useful for transitioning to Python if one comes from the spreadsheet or SQL world. We start off by importing pandas as pd in Python.
import pandas as pdLoad the datasets
We can use the built-in read_json function to read the input datasets directly into a pandas dataframe.
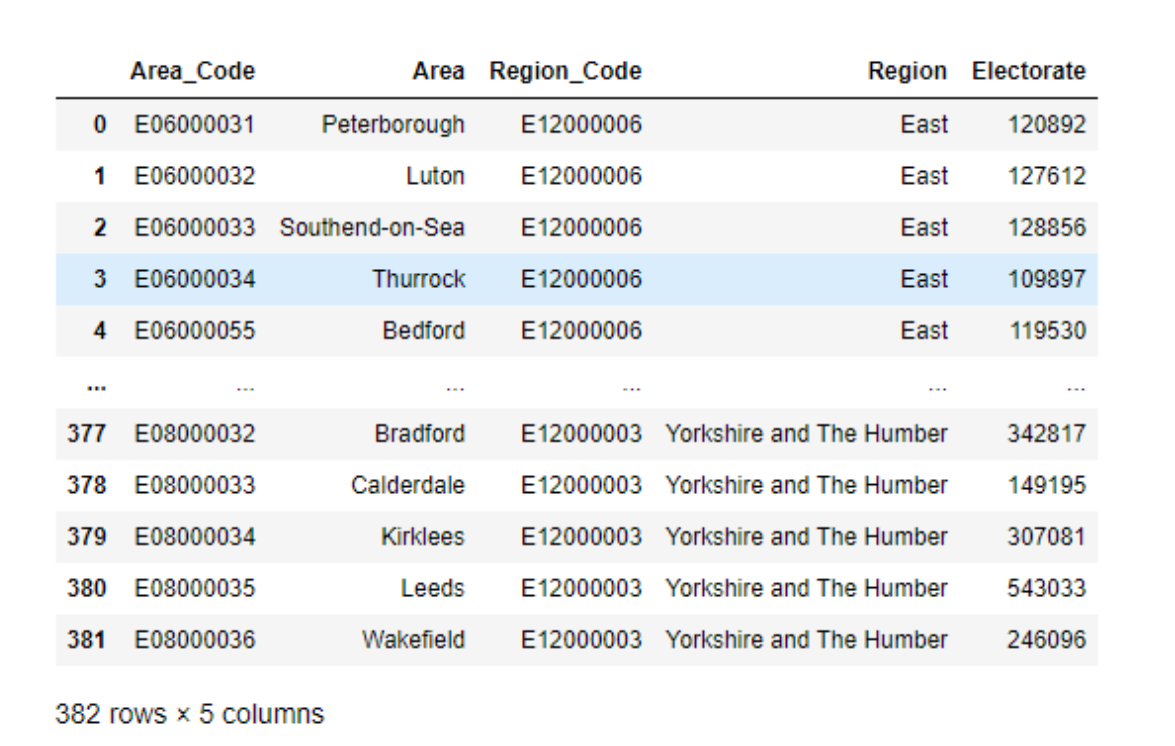
demo_df = pd.read_json(r"https://raw.githubusercontent.com/viveknest/statascratch-solutions/main/UK%20Referendum%20Data/uk_demo.json")
demo_df
We can do the same for the other datasets as well.
results_df = pd.read_json(r"https://raw.githubusercontent.com/viveknest/statascratch-solutions/main/UK%20Referendum%20Data/uk_results.json")
rejected_df = pd.read_json(r"https://github.com/viveknest/statascratch-solutions/raw/main/UK%20Referendum%20Data/uk_rejected_ballots.json")
Join the datasets
Pandas provides multiple methods to work with multiple datasets. We can use the merge method to perform an SQL-style join.
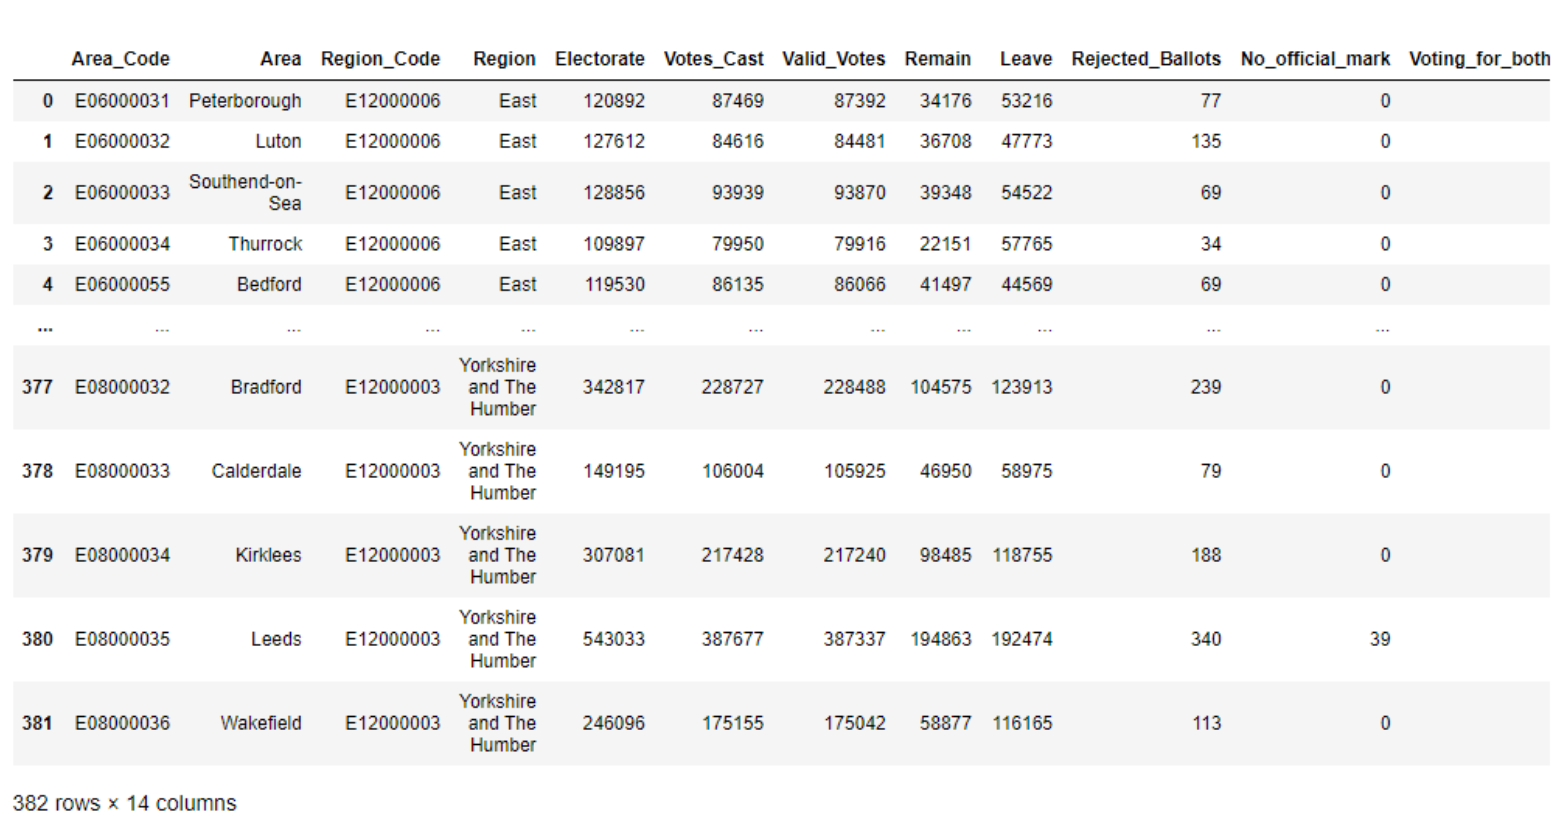
merged_df = pd.merge(left = demo_df, right = results_df, on = 'Area_Code').merge(rejected_df, on = 'Area_Code')
merged_df
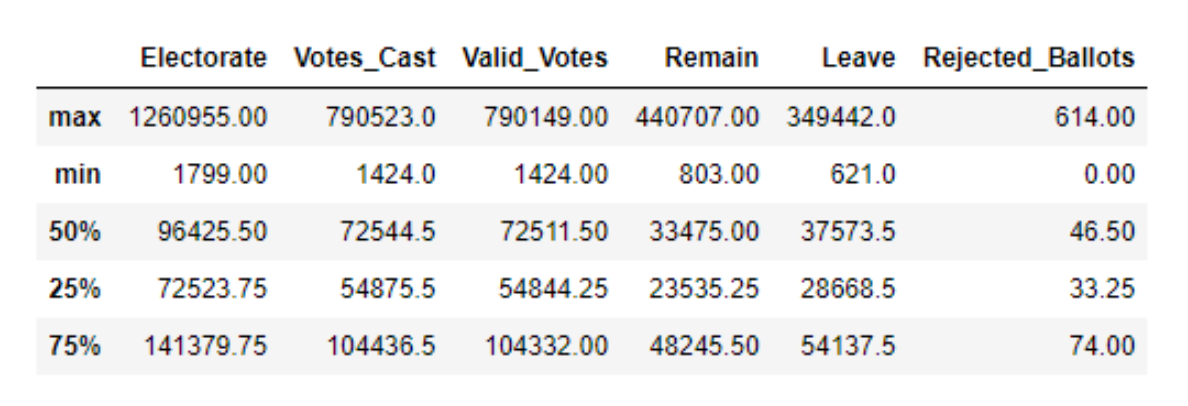
Summary Statistics
Pandas comes with a built-in function to generate summary statistics quickly. We can actually generate all the summary statistics in one go using the describe method.
merged_df.describe()

Since we need only limited statistics and only for a subset of the columns, we use the .loc method to retrieve the relevant fields.
merged_df.describe().loc[['max', 'min', '50%','25%', '75%']][['Electorate', 'Votes_Cast', 'Valid_Votes', 'Remain', 'Leave', 'Rejected_Ballots' ]]
Find the Area with the highest and lowest electorates
There are multiple ways of doing this. In out Python cheat sheet, let us try a couple of methods.
Sorting
As we did in the non-Pandas method above in this Python cheat sheet, we can sort the values in ascending or descending order and output the first or the last row to get the lowest and highest values.
merged_df.sort_values(by = 'Electorate').iloc[0]['Area']Using the idxmax() and idxmin() functions.
The idxmax() function returns the dataframe index of the highest value. We can pass this index back to the main dataframe to find the row containing the highest value and subset the relevant column.
merged_df['Electorate'].idxmax()
merged_df.loc[merged_df['Electorate'].idxmax()]['Area']The idxmin() function will give the index of the lowest value.
merged_df.loc[merged_df['Electorate'].idxmin()]['Area']Find the Region wise totals
Again there are numerous ways in Pandas to aggregate data. Let us use the two most common ways.
Using groupby
Those from the SQL world can use the groupby method to achieve aggregation.
merged_df.groupby(by = 'Region').agg({'Electorate': sum})

Pivot Table
Those from the spreadsheet world can use the pivot table function which works exactly as the name suggests.
merged_df.pivot_table(index = ['Region'], aggfunc = {'Electorate': sum})
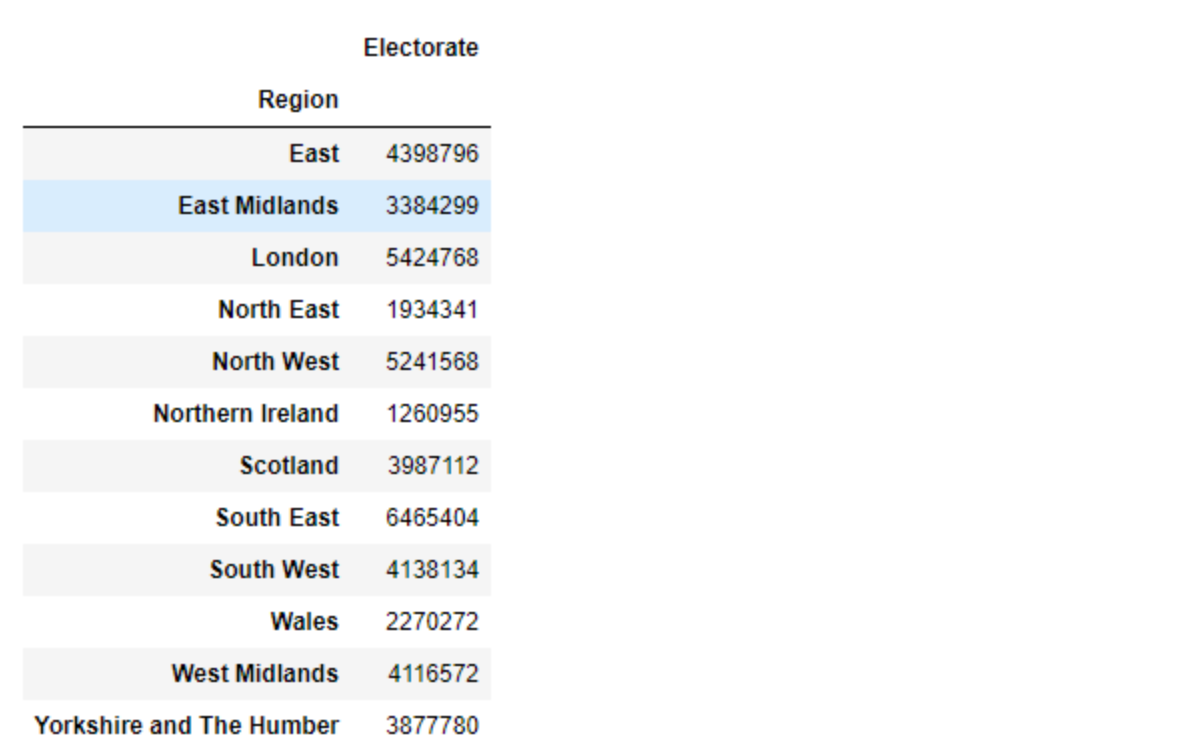
This gives an identical solution as the previous step.
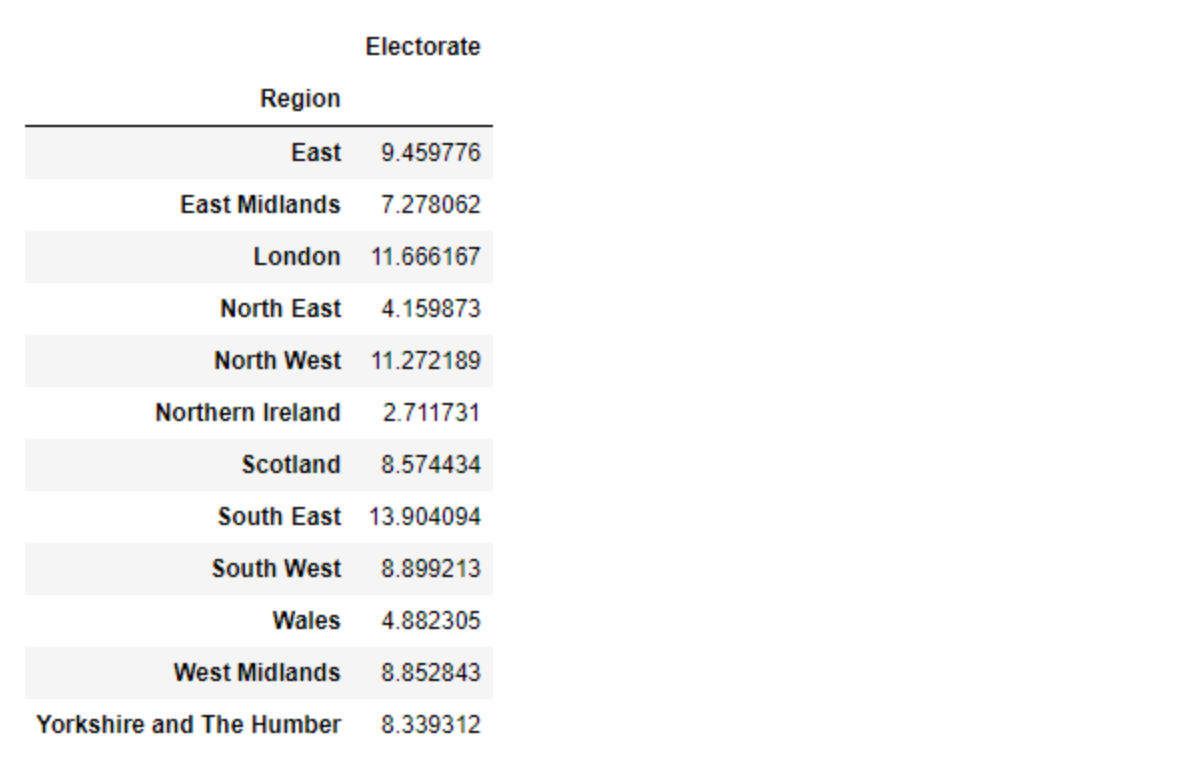
Contribution of each region to the total
To find the contribution of each region, we simply divide the aggregate values from above with the sum of the column values.
merged_df.groupby(by = 'Region').agg({'Electorate': sum}) / merged_df['Electorate'].sum() * 100
You can find the entire solved solutions using Pandas here. Also, check out this Pandas cheat sheet that explains the functions any data scientist should know and includes interview questions from Forbes, Meta, Google, and Amazon.
Conclusion
In this Python Cheat Sheet, we solved data wrangling problems in Python with and without the Pandas library. If you want to succeed in Data Science, you need to be versatile with your skills. Depending on the resources available, one must be able to get a solution. Luckily, Python is one of the easiest languages to learn. If you have a good understanding of SQL or spreadsheets, Pandas - one of the most popular Python libraries for Data Science, is very easy to learn. Also, have a look at our Python vs R article. On the StrataScratch platform, you will find more than 500 questions from Data Science interviews from top companies like Netflix, Amazon, Microsoft, Google, et al. Sign up on StrataScratch and join a community of over 20,000 aspirants and mentors helping make your dream of getting top data science jobs a reality.
Share