Technical Skills Needed as a Data Analyst with 1-2 Years of Experience

Categories:
 Written by:
Vivek Sankaran
An overview of the top must-have technical skills a data analyst needs to stay competitive in the job market.
Data Science jobs are not coding competitions. As with most things in life, there is a gap between hype, expectations, and reality. Data Analyst jobs are your key to entering the larger world of Data Science. In this article we delve into the finer aspects of Data Analyst jobs, things that separate the good from the average and the best from the good.
We discuss the following aspects from a SQL standpoint -
- Flavors of SQL
- Working with messy data
- Joins
- Window Functions
- Subqueries, CTEs, and Temporary Tables
- Converting from long to wide format (pivoting)
Technical Skills needed as a Data Analyst
While real-world problems are not the ones that you encountered in the interview process, you still need to have a few technical skills to excel as a Data Analyst. I am focussing on SQL-specific techniques, similar functions exist in Python and R languages as well. I will use Postgres to solve this problem as that is the flavor I am most comfortable with. MySQL too will have similar features. You can refer to the article “Postgres vs MySQL: Which is Better for Analytics” to understand the differences between Postgres and MySQL.
Data Analyst Technical Skill #1: Using JOINS

Most modern database systems store data in a highly normalized form. However, to create reports, we need to aggregate data from the individual tables. To accomplish this we need to use JOINs which is one of the most important data analyst technical skills. Understanding the type of join to be used is the bare minimum to clear any Data Science or Data Analyst interview. A Data Analyst will be using JOINS on a regular basis. Let us review the type of joins using a simple problem. This one is from an Amazon Interview.
Total Cost Of Orders
Last Updated: July 2020
Find the total cost of each customer's orders. Output customer's id, first name, and the total order cost. Order records by customer's first name alphabetically.
You can solve the problem on the platform here. https://platform.stratascratch.com/coding/10183-total-cost-of-orders
This problem uses two datasets: customers
| id | int |
| first_name | varchar |
| last_name | varchar |
| city | varchar |
| address | varchar |
| phone_number | varchar |
The data in the customers dataset looks like this.
and orders
| id | int |
| cust_id | int |
| order_date | datetime |
| order_details | varchar |
| total_order_cost | int |
that contains the following data.
Solution
Here we assume that we need to report only those customers who had made a purchase. This is a simple problem. However, we can use this to explore the effects of different kinds of joins. We can solve this by simply joining the two tables based, aggregating the total_order_cost field from the orders dataset. The key to solving this problem is to identify the kind of join we need. We can solve the problem with any of the three joins.
Using an INNER JOIN
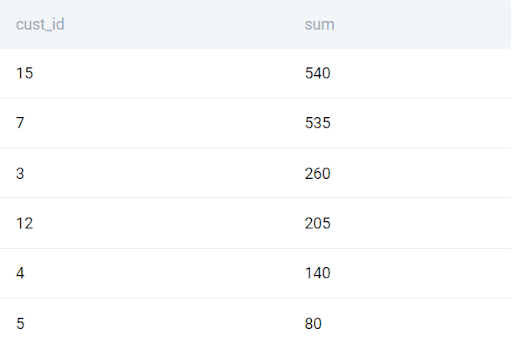
We start by aggregating the order value for each customer from the orders table.
SELECT
orders.cust_id
, sum(orders.total_order_cost)
FROM orders
GROUP BY 1
ORDER BY 2 DESC
;
This gives the following output.
We can then use an INNER JOIN to add the customer information from the customers table.
SELECT
orders.cust_id
, customers.first_name
, sum(orders.total_order_cost)
FROM orders
INNER JOIN customers
    ON orders.cust_id = customers.id
GROUP BY 1,2
ORDER BY 3 DESC
;Using a LEFT JOIN
If we consider the orders table as the left table, we can replace the INNER JOIN in the above condition with a LEFT JOIN and get the same results.
SELECT
orders.cust_id
, customers.first_name
, sum(orders.total_order_cost)
FROM orders
LEFT JOIN customers
    ON orders.cust_id = customers.id
GROUP BY 1,2
ORDER BY 3 DESC
;
Using a RIGHT JOIN
Assuming that we need to keep the order of the datasets in the query - first use the customers table and then the orders table. This scenario will be common when you are reusing existing code and adding additional fields from the right table to the base table in each join. You can learn more about joining multiple tables in SQL here. In this case, we need to use a RIGHT JOIN as we need to keep the data that is present in the RIGHT table only.
SELECT
orders.cust_id
, customers.first_name
, sum(orders.total_order_cost)
FROM customers
RIGHT JOIN orders
    ON orders.cust_id = customers.id
GROUP BY 1,2
ORDER BY 3 DESC
;
* Note: nothing will get the goat of SQL programmers more than a new analyst using a RIGHT JOIN. Even though it is a perfectly valid solution, you might end up triggering intense debates on why this is blasphemy as can be seen here. However, all is not lost. If you must pacify these religious types, you can still use an INNER JOIN or even better use a LEFT JOIN like this.
SELECT
orders.cust_id
, customers.first_name
, sum(orders.total_order_cost)
FROM customers
LEFT JOIN orders
    ON orders.cust_id = customers.id
WHERE orders.cust_id IS NOT NULL
GROUP BY 1,2
ORDER BY 3 DESC
;
What the above does is remove any rows in the final output that does not have a matching value from the right table (essentially a convoluted INNER JOIN)
Check out our post "SQL JOIN Interview Questions" to practice such more questions.
Data Analyst Technical Skill #2: Subqueries, CTEs, and TEMP Tables

As queries become more and more complex, it is not always possible to solve the problem with a single SQL statement. We need to store the result set so as to reuse that again as if it were a separate table. We can use a subquery, a CTE (Common Table Expression), or a TEMP (Temporary) table for this. As with other SQL practices, this is another raging discussion point among SQL geeks. If you are writing large queries, especially for creating a data pipeline, my personal preference is to use a TEMP TABLE since we can iteratively test our code without having to run the entire query every single time. However, sometimes the choice is forced upon us. For example, if you are using an SQL query in a visualization tool, chances are that you may not be allowed to create a TEMP table. Organizations also prevent the creation of TEMP TABLES to prevent table bloat as the TEMP tables are not removed till the user session is ended and this can result in large TEMP tables eating up fixed resources for others.
Between a CTE and a subquery, I prefer to use a CTE most of the time as it makes it easier to debug and read unless it is a one-liner subquery. Let us try to solve a question using each of the three approaches. This one is from a Google Data Science Interview.
Email Details Based On Sends
Find all records from days when the number of distinct users receiving emails was greater than the number of distinct users sending emails
You can solve this problem on the platform here - https://platform.stratascratch.com/coding/10086-email-details-based-on-sends
The problem uses the google_gmail_emails dataset with the following fields.
| id | int |
| from_user | varchar |
| to_user | varchar |
| day | int |
The data in the table looks like this.
Solution
This is not a difficult question to solve. However, we will use this to describe how to use each of Subquery, CTE, and a TEMP table. The approach to the problem is very straightforward -
- Firstly, we need to count the DISTINCT number of sending users (from_user) and the DISTINCT number of receiving users (to_user) and select only those days where the number of receiving users is more than the number of sending users.
- Then for these days, we need to output all the records from the base table google_gmail_emails
Since we cannot accomplish these in a single SQL statement, we have to use a subquery, CTE, or TEMP table.
The basic query to find the days where the number of receiving users is more than the number of sending users is
SELECT
day
, COUNT(DISTINCT from_user) AS NUM_SENDERS
, COUNT(DISTINCT to_user) AS NUM_RECEIVERS
FROM google_gmail_emails
GROUP BY 1
HAVING COUNT(DISTINCT from_user) < COUNT(DISTINCT to_user)
Let us use this in different ways
Subquery
SELECT * FROM
google_gmail_emails
WHERE day in
    (
        SELECT day from
            (
                SELECT
                day
                , COUNT(DISTINCT from_user) AS NUM_SENDERS
                , COUNT(DISTINCT to_user) AS NUM_RECEIVERS
                FROM google_gmail_emails
                GROUP BY 1
                HAVING COUNT(DISTINCT from_user) < COUNT(DISTINCT to_user)
        ) AS subquery
)CTE
WITH cte_table AS
    (
        SELECT
        day
        , COUNT(DISTINCT from_user) AS NUM_SENDERS
        , COUNT(DISTINCT to_user) AS NUM_RECEIVERS
        FROM google_gmail_emails
        GROUP BY 1
        HAVING COUNT(DISTINCT from_user) < COUNT(DISTINCT to_user)
    )
SELECT * FROM
google_gmail_emails
WHERE day in (SELECT day from cte_table)
TEMP Tables
DROP TABLE IF EXISTS tmp;
CREATE TEMP TABLE tmp AS
    SELECT
    day
    , COUNT(DISTINCT from_user) AS NUM_SENDERS
    , COUNT(DISTINCT to_user) AS NUM_RECEIVERS
    FROM google_gmail_emails
    GROUP BY 1
    HAVING COUNT(DISTINCT from_user) < COUNT(DISTINCT to_user)
;
SELECT * FROM
google_gmail_emails
WHERE day in (SELECT day from tmp)
;
Note the above code will not work on the StrataScratch platform as TEMP tables are disabled.
Data Analyst Technical Skill #3: Transforming from Long to Wide Format (Pivot tables)

One of the key reasons why people, including yours truly love spreadsheets is the ability to create cross-tabulations or pivot tables easily. To give you a simple example. Let us consider this dataset of customers of different genders and age groups.
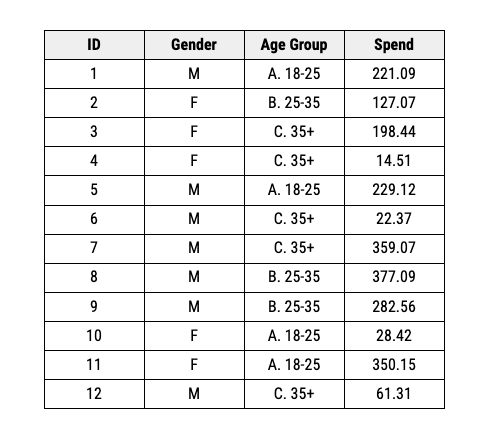
Suppose we want to see how the distribution varies across gender and age categories. With spreadsheet software, we can simply use a pivot table to convert from rows to columns easily.
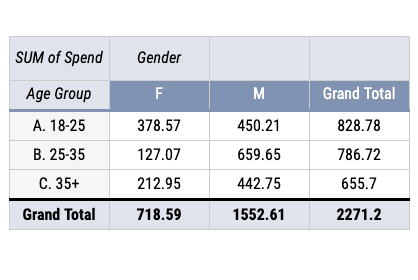
While some implementations of SQL like BigQuery and Microsoft SQL Server have their implementation of PIVOT functions. The functions are not as versatile as that in a spreadsheet program. We can overcome this by using the CASE WHEN expression. Let us illustrate this using an example. This one is from an ESPN Data Science Interview.
Olympic Medals By Chinese Athletes
Find the number of medals earned in each category by Chinese athletes from the 2000 to 2016 summer Olympics. For each medal category, calculate the number of medals for each olympic games along with the total number of medals across all years. Sort records by total medals in descending order.
You can solve this question here https://platform.stratascratch.com/coding/9959-olympic-medals-by-chinese-athletes
The problem uses the olympic_atheletes_events dataset.
| id | int |
| name | varchar |
| sex | varchar |
| age | float |
| height | float |
| weight | datetime |
| team | varchar |
| noc | varchar |
| games | varchar |
| year | int |
| season | varchar |
| city | varchar |
| sport | varchar |
| event | varchar |
| medal | varchar |
The data is presented in the following manner.
Solution
- In order to solve this problem, we need to tag the year separately creating new variables for each of the years 2000 to 2016.
- Then we can aggregate these new variables by the medal and output in the descending order of the total medals.
To create a new variable for each year, we use the CASE WHEN expression.
SELECT *
, CASE WHEN YEAR = 2000 THEN 1 ELSE 0 END AS MEDALS_2000
, CASE WHEN YEAR = 2004 THEN 1 ELSE 0 END AS MEDALS_2004
, CASE WHEN YEAR = 2008 THEN 1 ELSE 0 END AS MEDALS_2008
, CASE WHEN YEAR = 2012 THEN 1 ELSE 0 END AS MEDALS_2012
, CASE WHEN YEAR = 2016 THEN 1 ELSE 0 END AS MEDALS_2016
, CASE WHEN YEAR>= 2000 AND YEAR <= 2016 THEN 1 END AS TOTAL_MEDALS
FROM olympics_athletes_events
WHERE
YEAR>= 2000 AND YEAR <= 2016
AND UPPER(TEAM) = 'CHINA'
We get an output like this.
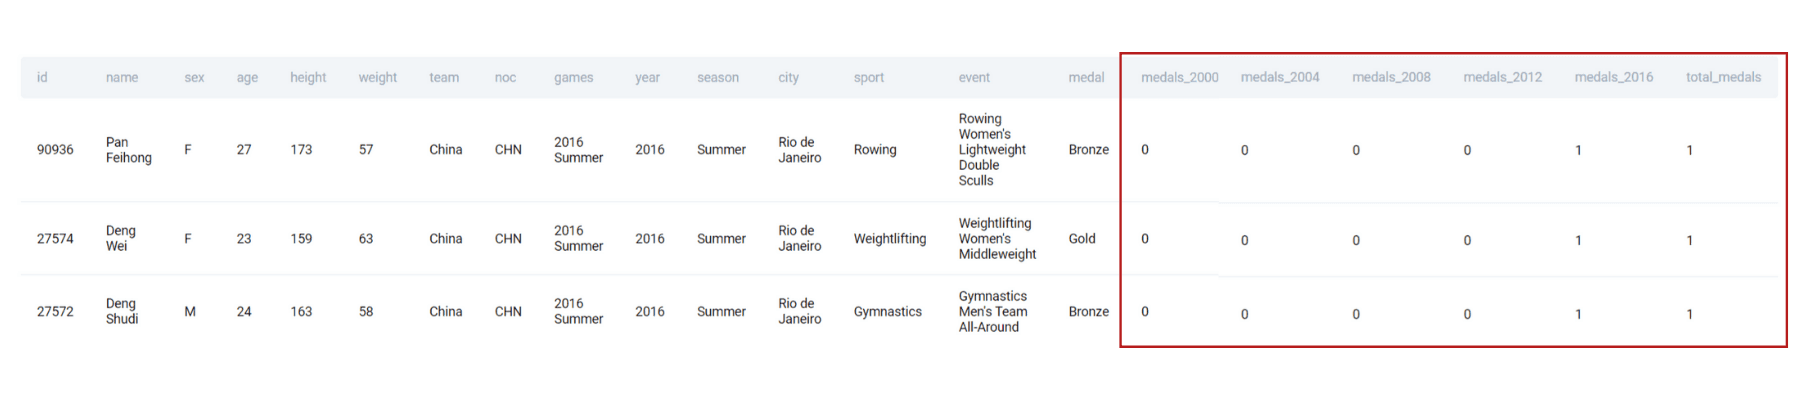
As you can see, there are additional columns being created representing the year that the medal was won and the total. Note we can also calculate the total separately.
Now we simply aggregate this table and get the required output.
WITH CAT_MEDALS AS (
    SELECT *
    , CASE WHEN YEAR = 2000 THEN 1 ELSE 0 END AS MEDALS_2000
    , CASE WHEN YEAR = 2004 THEN 1 ELSE 0 END AS MEDALS_2004
    , CASE WHEN YEAR = 2008 THEN 1 ELSE 0 END AS MEDALS_2008
    , CASE WHEN YEAR = 2012 THEN 1 ELSE 0 END AS MEDALS_2012
    , CASE WHEN YEAR = 2016 THEN 1 ELSE 0 END AS MEDALS_2016
    , CASE WHEN YEAR>= 2000 AND YEAR <= 2016 THEN 1 END AS TOTAL_MEDALS
    FROM olympics_athletes_events
    WHERE
    YEAR>= 2000 AND YEAR <= 2016
    AND UPPER(TEAM) = 'CHINA'
)
SELECT
    MEDAL
    , SUM(MEDALS_2000) AS MEDALS_2000
    , SUM(MEDALS_2004) AS MEDALS_2004
    , SUM(MEDALS_2008) AS MEDALS_2008
    , SUM(MEDALS_2012) AS MEDALS_2012
    , SUM(MEDALS_2016) AS MEDALS_2016
    , SUM(TOTAL_MEDALS) AS TOTAL_MEDALS
FROM CAT_MEDALS
GROUP BY 1
ORDER BY 7 DESC
;CASE WHEN statement is very helpful to simulate pivot table-like outputs and can be used every time one needs to move from long to wide format data.
Data Analyst Technical Skill #4: Window Functions

As the name suggests a window function differs from the usual SQL operations that work on the entire table. This is one of the must-know data analyst technical skills. These functions work on a part of the table (a window). With SQL window functions, we can avoid aggregation and merge sequence by simply creating a window and then having the function perform these operation on this window. If you want to save time by performing some aggregations
The window functions available in Postgres are
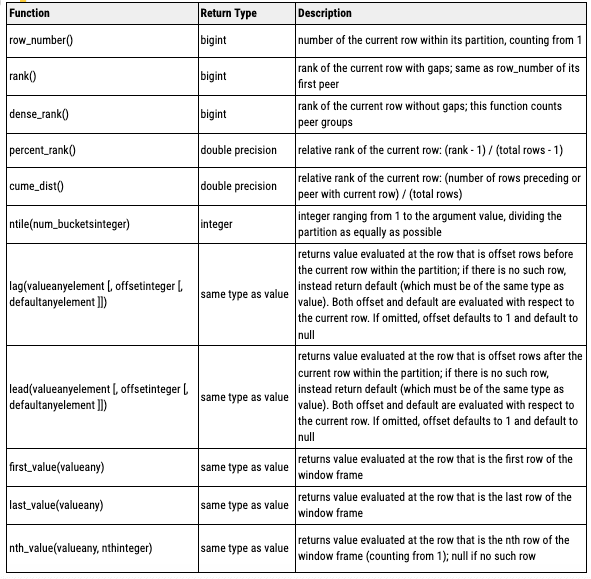
To understand how these window functions work, let us take this example. This one appeared in a DoorDash Data Science Interview.
Lowest Revenue Generated Restaurants
Last Updated: May 2021
Write a query that returns a list of the bottom 2% revenue generating restaurants. Return a list of restaurant IDs and their total revenue from when customers placed orders in May 2020.
You can calculate the total revenue by summing the order_total column. And you should calculate the bottom 2% by partitioning the total revenue into evenly distributed buckets.
You can solve this problem here https://platform.stratascratch.com/coding/2036-lowest-revenue-generated-restaurants
This problem uses the doordash_delivery dataset that has the following fields.
| customer_placed_order_datetime | datetime |
| placed_order_with_restaurant_datetime | datetime |
| driver_at_restaurant_datetime | datetime |
| delivered_to_consumer_datetime | datetime |
| driver_id | int |
| restaurant_id | int |
| consumer_id | int |
| is_new | bool |
| delivery_region | varchar |
| is_asap | bool |
| order_total | float |
| discount_amount | int |
| tip_amount | float |
| refunded_amount | float |
The data is arranged in the following manner.
Solution
To solve this problem,
- We need to aggregate the order_total for the month of May 2020 for each restaurant
- Calculate the percentile based on the order_total aggregate
- Output those restaurant and their sales whose ranks are in the bottom 2%
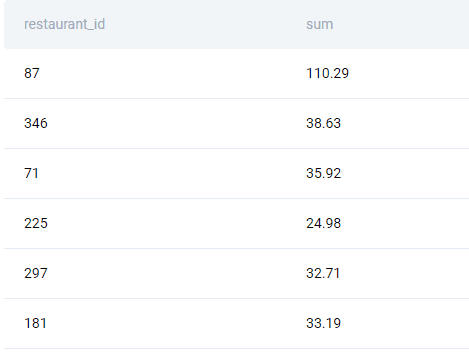
We start off by aggregating the totals for the month of May 2020.
SELECT
restaurant_id
, sum(order_total)
FROM doordash_delivery
WHERE delivered_to_consumer_datetime BETWEEN '2020-05-01' AND '2020-05-31'
GROUP BY 1
;
Note: We have used the full date range to get the May 2020 data. Later in this article, we will explore some of the most common Date and Time functions in SQL that a Data Analyst should know.
We get an output like this.
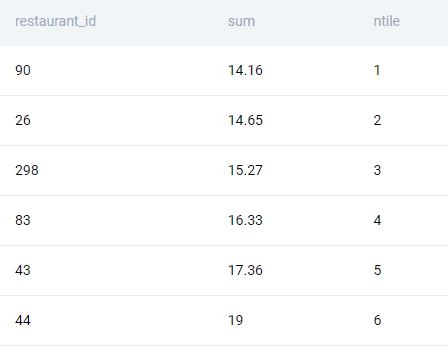
Now we need to assign them percentiles. To do this we invoke the built in ntile() window function.
SELECT
restaurant_id
, sum(order_total)
, NTILE(100) OVER
(
ORDER BY sum(order_total)
) AS ntile
FROM doordash_delivery
WHERE delivered_to_consumer_datetime BETWEEN '2020-05-01' AND '2020-05-31'
GROUP BY 1
;
We get an output like this.
Now we can simply subset this dataset with the ntile value <= 2. Note we cannot use the WHERE or the HAVING clause since a window function is executed after the WHERE and HAVING statements. We, therefore, use a CTE.
WITH PCTILES AS (
SELECT
restaurant_id
, sum(order_total) AS total_order
, NTILE(100) OVER
(
ORDER BY sum(order_total)
) AS ntile
FROM doordash_delivery
WHERE delivered_to_consumer_datetime BETWEEN '2020-05-01' AND '2020-05-31'
GROUP BY 1
)
SELECT
restaurant_id
, total_order
FROM PCTILES
WHERE ntile <= 2
;
This is the power of a window function, you can work with aggregations in the same query thus saving on computational time as well as providing an elegant solution.
Data Analyst Technical Skill #5: Date and Time Manipulation

One of the key requirements for most businesses is to understand the evolution of key metrics over time. Time-series-based analyses are therefore quite commonplace. This makes DateTime manipulation one of the important data analyst technical skills. As a Data Analyst one should be comfortable working with Date and Time fields. Thankfully most modern flavors of SQL (SQLite excepting) support a range of date and time functions. Let us solve a few questions using date-time functionalities. We start off by solving the previous question with built-in datetime functions. We need to find out percentile values for the month of May 2020. We can simply use the DATE_TRUNC function. As the name suggests, the DATE_TRUNC function truncates the date-time field. We can specify the truncation period. In our case, we want only records for the month of May 2020. So we use just truncate it at the monthly level. DATE_TRUNC will truncate each datetime value to the first of each month. We can then simply subset for that date only.
WITH PCTILES AS (
SELECT
restaurant_id
, sum(order_total) AS total_order
, NTILE(100) OVER
(
ORDER BY sum(order_total)
) AS ntile
FROM doordash_delivery
WHERE DATE_TRUNC('MONTH', delivered_to_consumer_datetime) = '2020-05-01'::DATE
GROUP BY 1
)
SELECT
restaurant_id
, total_order
FROM PCTILES
WHERE ntile <= 2
;
We will get the exact result as our solution using the BETWEEN operator.
Let us try another problem on datetime functions. This one is from an Amazon Data Science Interview.
Finding User Purchases
Last Updated: December 2020
Identify returning active users by finding users who made a second purchase within 1 to 7 days after their first purchase. Ignore same-day purchases. Output a list of these user_ids.
You can solve the problem here: https://platform.stratascratch.com/coding/10322-finding-user-purchases
The problem uses the amazon_transactions dataset with the following fields.
| id | int |
| user_id | int |
| item | varchar |
| created_at | datetime |
| revenue | int |
The data looks like this -
Solution
The key to solving the problem is to tag those transactions that happened within 7 days of the previous transaction for the same user. To do this
- We compare every transaction for a given user with the immediately previous transaction
- If the time period is within 7 days, then we tag the transaction as within7days
- Finally we output all the users with one or more within7days tag.
To do a comparison, we create a window. Unlike the previous windows, we will use a window for a particular user only. To do this, we use the PARTITION BY clause. We can then order by the timestamp (created_at) and use the LAG() function. The LAG() function gives the nth previous value in the window for a given n.
SELECT
    user_id
    , created_at
    , LAG(created_at, 1) OVER (
    PARTITION BY user_id
    ORDER BY user_id, created_at
    )
FROM amazon_transactions
;We get this output.
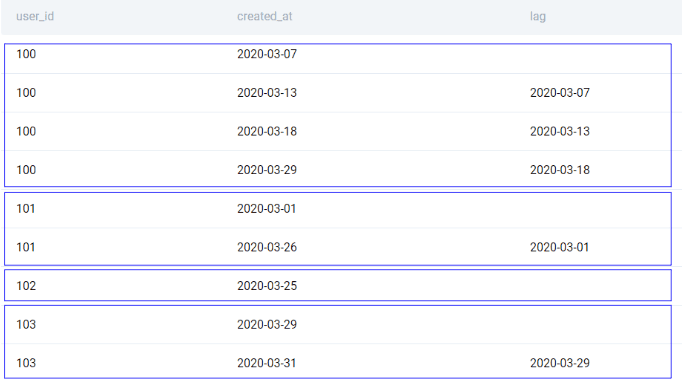
As you can see, the PARTITION BY clause splits the window on the basis of user_id. The LAG function is then applied only on this partition. Therefore we are not comparing the timestamps of different users.
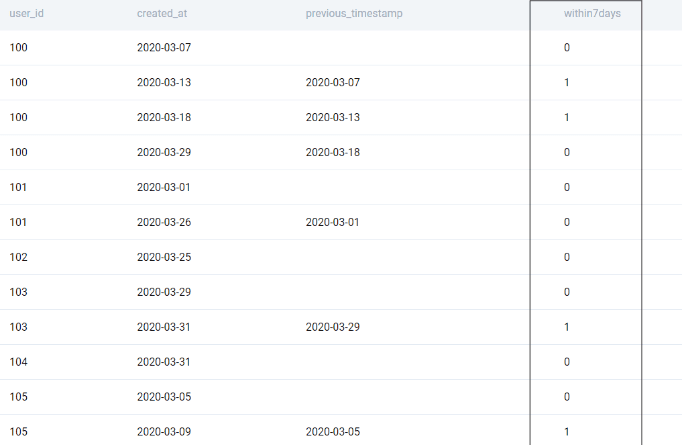
Once this is done, the rest of the problem is pretty straightforward. We compare this lag timestamp with the current timestamp and check if it is within 7 days. To do this we use the INTERVAL operator.
SELECT
    user_id
    , created_at
    , LAG(created_at, 1) OVER (
    PARTITION BY user_id
    ORDER BY user_id, created_at
    ) AS previous_timestamp
    , CASE
    WHEN created_at <= LAG(created_at, 1) OVER (
    PARTITION BY user_id
    ORDER BY user_id, created_at
    ) + INTERVAL '7 DAYS'
    THEN 1 ELSE 0 END as within7days
FROM amazon_transactions
;
We get this output. We have successfully tagged if a transaction happened within 7 days of the previous transaction.
We can now simply put this into a CTE and use SELECT DISTINCT to get the relevant user_ids
WITH time_lag AS (
SELECT
    user_id
    , created_at
    , LAG(created_at, 1) OVER (
    PARTITION BY user_id
    ORDER BY user_id, created_at
    ) AS previous_timestamp
    , CASE
    WHEN created_at <= LAG(created_at, 1) OVER (
    PARTITION BY user_id
    ORDER BY user_id, created_at
    ) + INTERVAL '7 DAYS'
    THEN 1 ELSE 0 END as within7days
FROM amazon_transactions
)
SELECT DISTINCT user_id
FROM time_lag
WHERE within7days = 1
;
We have a detailed article on date-time functionalities in SQL here “SQL Scenario Based Interview Questions and Answers”.
Data Analyst Technical Skill #6: Text Manipulation

Another important data analyst skill is the ability to handle text-based fields. Free text fields can cause a lot of problems because without validation, we can have typos, grammatical errors, inconsistent values, et al. One way of manipulating text is to use regex. But we will save that for another day. Even without using regex, there are quite a few text functions that we can employ. Let’s look at an example. This came up in a Postmates Data Science Interview.
Pizza Partners
Last Updated: January 2021
Which partners have ‘pizza’ in their name and are located in Boston? And what is the average order amount? Output the partner name and the average order amount.
You can solve the problem here: https://platform.stratascratch.com/coding/2016-pizza-partners
The problem uses three datasets.
postmates_orders
| id | int |
| customer_id | int |
| courier_id | int |
| seller_id | int |
| order_timestamp_utc | datetime |
| amount | float |
| city_id | int |
With the following data.
postmates_markets
| id | int |
| name | varchar |
| timezone | varchar |
With the following data
and postmates_partners
| id | int |
| name | varchar |
| category | varchar |
With the following data
Solution
The datasets are reasonably small. However, let us use a solution that will scale with larger datasets as well. To solve this problem we will need to -
- Find the average order value by partner
- Keep only those partners that have the word ‘pizza’ in their name and are located in Boston.
We start off by aggregating the postmates_orders dataset and joining it with the postmates_partners dataset to get the partner’s name.
We also join the postmates_partners. You’ll see why in the next step.
SELECT
pp.name
, AVG(amount)
FROM postmates_orders AS po
LEFT JOIN postmates_markets as pm
    ON PO.city_id = PM.id
LEFT JOIN postmates_partners as pp
    ON po.seller_id = pp.id
GROUP BY 1
;
We get the following output.

Then we subset the cities for Boston and business names for pizza. There are multiple ways to go about it. We can convert all strings to lowercase (or uppercase) and then use the LIKE function. Alternatively, with Postgres, we have the ILIKE function that is case-insensitive LIKE. We use both of them to demonstrate how it works.
SELECT
pp.name
, AVG(amount)
FROM postmates_orders AS po
LEFT JOIN postmates_markets as pm
    ON PO.city_id = PM.id
LEFT JOIN postmates_partners as pp
    ON po.seller_id = pp.id
WHERE
pm.name ILIKE 'boSTon'
AND LOWER(pp.name) LIKE '%pizza%'
GROUP BY 1
;
You can learn more about SQL text and array manipulation functions here.
Data Analyst Technical Skill #7: Dealing with Messy Data

Till now we have dealt with relatively clean datasets. However, as mentioned earlier - real-life datasets are not so spick and span. Dealing with messy data is also one of the important data analyst technical skills. SQL comes with a variety of functions to clean the data. Let us look at a couple of cases that are very common.
Missing Data
Missing value imputation is one of the most common problems facing a Data Analyst. Missing data points can wreak havoc with the calculations and might result in a lot of funny-looking trends. One way to impute missing data points is the COALESCE function. The COALESCE function uses the first non-null value from a given set of values. Let us use this in practice with a problem that came up in an Asana Data Science Interview.
Completed Tasks
Last Updated: March 2022
Find the number of actions that ClassPass workers did for tasks completed in January 2022. The completed tasks are these rows in the asana_actions table with 'action_name' equal to CompleteTask. Note that each row in the dataset indicates how many actions of a certain type one user has performed in one day and the number of actions is stored in the 'num_actions' column. Output the ID of the user and a total number of actions they performed for tasks they completed. If a user from this company did not complete any tasks in the given period of time, you should still output their ID and the number 0 in the second column.
You can solve this problem here: https://platform.stratascratch.com/coding/2096-completed-tasks
The problem uses two datasets. asana_users that has the following fields.
| user_id | int |
| name | varchar |
| surname | varchar |
| company | varchar |
The data contained in asana_users looks like this.
And the asana_actions dataset with the following fields
| user_id | int |
| date | datetime |
| num_actions | int |
| action_name | datetime |
The data in the asana_actions dataset looks like this -
Solution
The problem is not too difficult. We just need to ensure that we output it in the manner specified. We start off by subsetting only those users that begin work in the ClassPass company.
SELECT
au.user_id
FROM asana_users AS au
WHERE au.company = 'ClassPass'
;
We then add the actions from asana_actions dataset. Note we need to keep only the CompleteTask actions for the month of Jan 2022. So we subset the data in the JOIN condition itself so that only the relevant fields are passed in the merge. If we tried to subset in the main WHERE clause, we will remove all those users who either did not have a CompleteTask type action or did not have the action in Jan 2022 or both.
SELECT
au.user_id
, aa.num_actions
FROM asana_users AS au
LEFT JOIN asana_actions AS AA
    ON AU.user_id = AA.user_id
    AND AA.action_name = 'CompleteTask'
    AND DATE_TRUNC('MONTH', AA.date) = '2022-01-01'::DATE
WHERE au.company = 'ClassPass'
;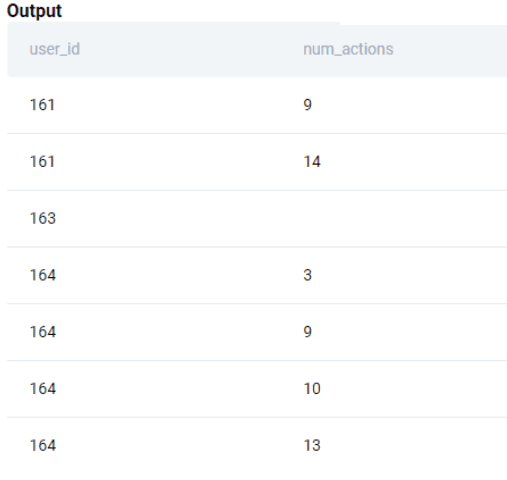
Now we can simply aggregate by the user_id. For those users who did not have any actions in Jan 2022, we need to show 0 as the output. Therefore, we use the COALESCE() function.
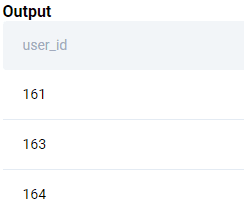
SELECT
au.user_id
, COALESCE(SUM(aa.num_actions),0)
FROM asana_users AS au
LEFT JOIN asana_actions AS AA
    ON AU.user_id = AA.user_id
    AND AA.action_name = 'CompleteTask'
    AND DATE_TRUNC('MONTH', AA.date) = '2022-01-01'::DATE
WHERE au.company = 'ClassPass'
GROUP BY 1
ORDER BY 1
;Duplicates
Another challenge that a Data Analyst should be ready to face on a day-to-day basis is working with duplicates. Sometimes repeated values are legitimate - for example, purchases of a user on an app. However, there are some cases where we expect unique values, but end up getting multiple values. If one is not careful with the presence of duplicates while merging the table values can inflate very quickly. These days most companies have their data in cloud-based storage and limited query space that is shared among multiple users. You do not want to be tagged in an email with over a hundred users by the Database Engineer to kill the query that has used up the entire workspace. In reality, one learns by making mistakes. And some duplicates are pretty hard to find. Let us take an example that yours truly messed up. This one is from a Microsoft Data Science Interview.
Find the number of employees who received the bonus and who didn't
Find the number of employees who received the bonus and who didn't. Bonus values in employee table are corrupted so you should use values from the bonus table. Be aware of the fact that employee can receive more than one bonus. Output value inside has_bonus column (1 if they had bonus, 0 if not) along with the corresponding number of employees for each.
You can solve this problem here: https://platform.stratascratch.com/coding/10081-find-the-number-of-employees-who-received-the-bonus-and-who-didnt
The problem uses two datasets. The employee dataset with the following fields.
| id | int |
| first_name | varchar |
| last_name | varchar |
| age | int |
| sex | varchar |
| employee_title | varchar |
| department | varchar |
| salary | int |
| target | int |
| bonus | int |
| varchar | |
| city | varchar |
| address | varchar |
| manager_id | int |
The data looks like this.
And the bonus dataset with the following fields
| worker_ref_id | int |
| bonus_amount | int |
| bonus_date | datetime |
This is how the data looks like in the bonus dataset
Solution
This is a pretty straightforward question. We need to tag the employees who received a bonus (1) and those who did not (0) and then aggregate the numbers based on this tagged field. Ideally we should have been able to do this and get the solution.
SELECT
CASE WHEN bonus.worker_ref_id IS NULL THEN 0 ELSE 1 END AS RECEIVED_BONUS
, COUNT(ID)
FROM employee E
LEFT JOIN BONUS
ON E.ID = BONUS.worker_ref_id
GROUP BY 1
ORDER BY 1
;However, there is a twist. There are duplicates in the bonus dataset. It took me about an hour to figure that out. The solution is pretty straightforward.
SELECT
CASE WHEN bonus.worker_ref_id IS NULL THEN 0 ELSE 1 END AS RECEIVED_BONUS
, COUNT(DISTINCT ID)
FROM employee E
LEFT JOIN BONUS
ON E.ID = BONUS.worker_ref_id
GROUP BY 1
ORDER BY 1
;As mentioned earlier, some duplicates are not easy to find or obvious in the first place. It is especially important to ensure that one keeps checking the size of the table when merging multiple tables. This is arguably one of the reasons RIGHT JOINs are fretted upon. We start with a base table and keep adding additional fields from the other tables, always using a LEFT JOIN. It then becomes easier to figure out if the number of rows is increasing or not.
Flavor of SQL
One last piece of advice for those venturing into the world of SQL. Which one should you learn first? MySQL or Postgres? We have a great article here “Postgres vs MySQL” comparing the two most popular open-source versions of SQL. I have worked on Postgres, BigQuery, Snowflake, SQLite, and MySQL. From my experience in dealing with these flavors of SQL, I found both of them and others to be very similar to each other. Yes, there are some functions that are not available in MySQL. But it is not that we cannot Google the requirements. Just to focus on the task, one cannot remember each and every function that is available in a particular variant. Nor should one. That is what documentation is for. One of the most successful Data Engineers that I know who uses SQL cannot function without the documentation and uses Google and Stackoverflow generously. The reason is quite simple - versions change, and new functions get added, but the basic understanding of how to manipulate data remains the same. If you know any one flavor of SQL reasonably well, it will not take you long to transition to another.
Conclusion
In this article, we looked at how a Data Analyst job is different from the interview questions asked. We looked at the different data analyst skills that one needs to build. What are the areas that one should fret over, and which ones you can safely ignore. We also looked at a case study that highlighted a way in which real-life data sets need to be handled. They might appear difficult at first, but the key to improvement is patience, persistence, and practice. All these examples and many more are available on the StrataScratch platform. Join StrataScratch today and join an active community of aspiring Data Science professionals to make your dream of working in companies like Google, Microsoft, Amazon, Apple, etc a reality.
Share