Top 30 Python Interview Questions and Answers

Categories:
 Written by:
Vivek Sankaran
A comprehensive overview of the types of Python interview questions asked in Data Science Interviews at top companies like Amazon, Google, Microsoft, etc.
Python has been consistently rated as the top programming language. Besides being widely used in a range of applications from web and mobile development, API management, process automation, etc, Python rules the Data Science world. Python is free, open-source and is backed by a vast collection of well-documented and continuously updated Python libraries. Unlike other languages with finicky syntaxes, Python is very easy to pick up and even people without CS backgrounds can learn it easily.
Technical concepts used in Python Interview Questions
The most common test areas in Python Data Science Interviews include
- Using the Python standard library.
- Specifically built-in data types and data structures like strings, Booleans, lists, dictionaries, etc.
- Manipulating datetime objects.
- Working with Tabular data
- Specifically using Pandas and NumPy libraries, and increasingly Polars for faster processing on larger datasets
- Knowledge of tabular libraries should include:
- Indexing and slicing
- Aggregation and rollups
- Data joining and filtering
- Filtering and conditional logic
- Vectorized operations
- (For Polars specifically) Lazy evaluation, expressions, and performance-aware syntax
Python Interview Questions
For this article, we will focus specifically on Python interview questions for the Data Scientist position. The problems involving Python for Data Scientist roles can broadly be grouped into the following categories.

- Math, Stats and Probability questions.
- Data Cleaning and Wrangling
- Datetime Operations
- Business Metrics and KPIs
- Text Manipulation
- Product Specific Problems
Let us look at each of these types of problems in detail.
Math and Probability Questions for Python Data Science Interviews
These python interview questions require the use of mathematical functions and (or) formulae. Some of the problems can be solved using high math, however, some might need a greater knowledge of probability and combinatorics. Let us look at a couple of them. The first one is from Credit Karma and requires the use of simple high school math.
1. Share of Loan Balance
Group each submission’s total balance based on rate_type and report the rate_type, loan_id and balance of each loan type. Also calculate the percentage of the submission’s total balance each loan constitutes.
Share of Loan Balance
Last Updated: February 2021
Write a query that returns the rate_type, loan_id, loan balance , and a column that shows with what percentage the loan's balance contributes to the total balance among the loans of the same rate type. Sort the final output by rate_type and loan_id.
Link to the question: https://platform.stratascratch.com/coding/2001-share-of-loan-balance
This is the data that we will be working with.
Approach (Pandas)
This is a relatively straightforward set.
- We first need to get the totals across all rate types (fixed or variable)
- Then we proceed to merge this information to the full dataset by rate_type
- Now the loan share can be calculated relatively easily.
Solution (Pandas)
# Import your libraries
import pandas as pd

# Get sum loan balances by loan type
loan_summ = submissions[['rate_type', 'balance']].groupby(['rate_type'],
as_index = False).sum().rename(columns = ({'balance': 'total_balance'}))

# Merge with the full dataset
output_df = pd.merge(submissions, loan_summ, on = 'rate_type', how = 'left')

# Calculate the share
output_df['loan_share'] = output_df['balance'] / output_df['total_balance']*100

# Keep relevant columns
output_df = output_df[['loan_id', 'rate_type', 'balance', 'loan_share']]

# Submit
output_df
Approach (Polars)
- We first calculate the total loan balances per rate_type using `.group_by()` and `.agg()` with `pl.col("balance").sum()`.
- Then we join this aggregated result back to the original dataset on `rate_type` using a left join.
- Now that each row has access to the total balance per type, we calculate the loan share using a vectorised expression: `balance / total_balance * 100`.
Solution (Polars)
import polars as pl

result = (
    submissions.lazy()
    .join(
        submissions.lazy()
        .group_by("rate_type")
        .agg(
            pl.col("balance").sum().alias("total_balance")
        ),
        on="rate_type",
        how="left"
    )
    .with_columns(
        (pl.col("balance") / pl.col("total_balance") * 100).alias("balance_share")
    )
    .select(["loan_id", "rate_type", "balance", "balance_share"])
    .collect()
)
- The dataset has already been loaded as a pandas.DataFrame.
- print() functions and the last line of code will be displayed in the output.
- In order for your solution to be accepted, your solution should be located on the last line of the editor and match the expected output data type listed in the question.
The next one is similar. This involves understanding of probability but is not too difficult. This one is from a Lyft Data Science Interview.
2. Find the probability of ordering a ride based on the weather and the hour
Find the probability of ordering a ride based on the weather and the hour and display the weather, hour and the corresponding probability sorted by the weather and the hour in ascending order.
Find the fraction of rides for each weather and the hour
Last Updated: February 2020
Find the fraction (percentage divided by 100) of rides each weather-hour combination constitutes among all weather-hour combinations. Output the weather, hour along with the corresponding fraction.
You can solve this Python interview question here: https://platform.stratascratch.com/coding/10019-find-the-probability-of-ordering-a-ride-based-on-the-weather-and-the-hour
This is the dataset that we will be working with.
Approach
- Here we are required to find out the probability of the rides for each combination of weather and hour.
- Therefore, we start off by aggregating the data by weather and hour. Since we need to count the number of events, we take up the gasoline_cost variable and count the values. This gives the number of occurrences by each required combination.
- We then find the probability by dividing these counts by the total number of occurrences (which is the number of rows in the dataset).
- Finally, we sort the results in the required order and output only the relevant columns.
Solution
# Import your libraries
import pandas as pd

# Find the number of rides by weather and hour
out_df = lyft_rides[['weather', 'hour', 'gasoline_cost']].groupby(by =
['weather', 'hour'], as_index = False).count().rename(columns =
{'gasoline_cost': 'count'})

# Calculate probability
out_df['probability'] = out_df['count'] / len(lyft_rides)

# Output the relevant columns and sort
out_df = out_df[['weather', 'hour', 'probability']].sort_values(by =
['weather', 'hour'])

# Submit
out_df- The dataset has already been loaded as a pandas.DataFrame.
- print() functions and the last line of code will be displayed in the output.
- In order for your solution to be accepted, your solution should be located on the last line of the editor and match the expected output data type listed in the question.
You can refer to this article for more such questions on using Python for solving Math, Probability and Stats questions for Data Science Interviews.
Statistics Questions for Python Data Science Interviews

Statistics based Data Science Interview questions may not always involve coding. You might be asked problems that involve use of statistics and machine learning algorithms.
In this article, we will concentrate on problems that involve coding in Python. Most of these python interview questions will test your understanding of statistical measures like mean, median, mode, percentiles, variance, standard deviation, et al. Let us look at a question that appeared in Python Data Science Interviews. This involves calculating percentiles and median.
3. Find students with a median writing score
Find Students At Median Writing
Identify the IDs of students who scored exactly at the median for the SAT writing section.
The question is available here: https://platform.stratascratch.com/coding/9610-find-students-with-a-median-writing-score
This is the dataset that we are working with
Approach
Median is the middle value when the data is sorted in ascending or descending order. Median is also the 50th percentile. To solve this python interview question, we can call the rank method on the writing score column and then get the 50th percentile score. Then subset the data to get only those values that have a percentile rank of 50.
Solution
import pandas as pd
import numpy as np

sat_scores['writing_percentile'] = sat_scores['sat_writing'].rank(axis = 0 , pct = True)
sat_scores['writing_percentile'] = (sat_scores['writing_percentile']*100).apply(np.floor)
result = sat_scores[sat_scores['writing_percentile'] == 50][['student_id']]
- The dataset has already been loaded as a pandas.DataFrame.
- print() functions and the last line of code will be displayed in the output.
- In order for your solution to be accepted, your solution should be located on the last line of the editor and match the expected output data type listed in the question.
Data Cleaning and Wrangling: Working with duplicates
Data Science is not only about Math and Statistics. One also needs to have a good handle on how to manipulate data to find the right output. A very common problem in Data Science Interviews is dealing with duplicates and finding out unique values. It is very important to know if the values in a particular column are unique, especially when you are merging additional datasets. Let us take a couple of examples that involve these concepts.
The first one is from a Virgin Group Data Science Interview.
4. Count the unique origin airports
Find how many different origin airports exist.
Count the unique origin airports
Find how many different origin airports exist?
This Python interview question can be solved on the Stratascratch platform here: https://platform.stratascratch.com/coding/9672-count-the-unique-origin-airports
These are fields in the dataset.
Approach
There are quite a few fields in this dataset, but the one that is of interest to us is the origin. We need to count the distinct number of airports. We can simply do this by passing the values to a set. A set is a standard Python data type that contains only distinct values. If you know about sets, we can solve this python interview question in a single line of code!!
Solution
# Import your libraries
import pandas as pd

# Convert the column values to a set and find its length
len(set(us_flights['origin']))- The dataset has already been loaded as a pandas.DataFrame.
- print() functions and the last line of code will be displayed in the output.
- In order for your solution to be accepted, your solution should be located on the last line of the editor and match the expected output data type listed in the question.
Let us try another one. This one is from a SalesForce Data Science Interview.
5. Duplicate Emails
Find all emails with duplicates.
Duplicate Emails
Last Updated: April 2019
Find all emails with duplicates.
You can solve this Python interview question here: https://platform.stratascratch.com/coding/9895-duplicate-emails
The fields in the data set are:
Approach
- The dataset again has a lot of fields, but the one we are interested in is email.
- To solve this problem, we can use the groupby method in Pandas and calculate the count.
- We then subset the resulting dataframe selecting only those emails with a count greater than 1. In other words, we select only those email ids that appear more than once.
Solution
# Import your libraries
import pandas as pd

# Find the count of all email ids
count_df = employee[['email', 'id']].groupby(by = 'email',
as_index = False).count()
# Subset only repeated values.
count_df[count_df['id'] > 1]['email']- The dataset has already been loaded as a pandas.DataFrame.
- print() functions and the last line of code will be displayed in the output.
- In order for your solution to be accepted, your solution should be located on the last line of the editor and match the expected output data type listed in the question.
Data Cleaning and Wrangling: Datetime manipulation
Another popular genre of python interview questions is one that involves manipulating date and time values. These questions are a perennial favorite of interviewers as you can create a range of questions with very simple looking datasets. We have looked at manipulating date time values with SQL in this SQL scenario based interview questions article. Let us see how to do something similar in Python.
The first one is from an Airbnb Data Science Interview.
6. Find the average difference between booking and check-in dates
Find out the average number of days between the booking and check-in dates for AirBnB hosts. Report the results based on the average number of days ordered in descending order.
Find the average difference between booking and check-in dates
Find the average number of days between the booking and check-in dates for AirBnB hosts. Order the results based on the average number of days in descending order. avg_days_between_booking_and_checkin DESC
You can solve this problem here: https://platform.stratascratch.com/coding/9614-find-the-average-difference-between-booking-and-check-in-dates
The dataset contains the following fields
Approach
- The relevant fields here are id_host to identify the host, ts_booking_at : the booking timestamp and the ds_checkin the check-in time.
- We start off by converting the values timestamps to dates. To do this, we use the dt.date method for pandas timestamp.
- We then take the difference between the check-in date and the booking date. The resulting value will be a timedelta object. This represents the difference between the two timestamps. We convert this timedelta value to days. This can be achieved by using the dt.days method in Pandas. The rest of the solution is pretty simple now.
- We take the average of the timestamps, grouped by the host_id.
- Then we sort the averages in descending order and remove any null values.
- Note: There might be null values because the guest might have initiated a conversation but might not have proceeded to book a stay.
Solution
# Import your libraries
import pandas as pd

# Extract only the days from the timestamp, calculate the difference and convert the difference to days.
airbnb_contacts['date_diff'] = (airbnb_contacts['ds_checkin'].dt.date -
airbnb_contacts['ts_booking_at'].dt.date).dt.days
# Calculate the average of the date_diff, sorting the result in descending order and dropping and null values.
avg_df = airbnb_contacts[['id_host', 'date_diff']].groupby(by = ['id_host'],
as_index = False).mean().sort_values(by = ['date_diff'],
ascending = False).dropna()- The dataset has already been loaded as a pandas.DataFrame.
- print() functions and the last line of code will be displayed in the output.
- In order for your solution to be accepted, your solution should be located on the last line of the editor and match the expected output data type listed in the question.
Let us crank up the difficulty level for the next one. This one is from a SalesForce Data Science Interview.
7. Consecutive Days
Find all the users who were active for 3 consecutive days or more.
Consecutive Days
Last Updated: July 2021
Find all the users who were active for 3 consecutive days or more.
You can solve this Python interview question here: https://platform.stratascratch.com/coding/2054-consecutive-days
The dataset contains the following fields
Approach
- The dataset is straightforward. However, the solution is a little complex as one needs to identify three or more consecutive days of login.
- We begin by extracting only the date parts from the timestamps. To do this we use the dt.date method.
- There might be multiple logins on the same day. Hence, we remove duplicate dates for the same user and sort the dataframe by user id and login dates.
- We then find the next login date and the next-to-next login date. To ensure that we do this for the same user only, we use the groupby.shift() method. This is akin to a window function in SQL.
- We finally subset only those values where the difference between the first and the second login and between the second and third login is one. To ensure that we do not double count values when a streak of more than 3 days is present, we drop any duplicates that might be present.
Solution
# Import your libraries
import pandas as pd

# Convert to datetime if not already
sf_events['record_date'] = pd.to_datetime(sf_events['record_date'])

# Extract date part from the timestamps
sf_events['date_stamp'] = sf_events['record_date'].dt.date

# Drop duplicate dates for the same user and sort login dates for each user
sf_events = sf_events.drop_duplicates(subset=['user_id', 'date_stamp']).sort_values(by=['user_id', 'date_stamp'])

# Extract the next login date for the same user
sf_events['d+1'] = sf_events.groupby('user_id')['date_stamp'].shift(-1)

# Extract the third login date for the same user
sf_events['d+2'] = sf_events.groupby('user_id')['date_stamp'].shift(-2)

# Filter users who logged in 3 consecutive days
result = sf_events[
    ((pd.to_datetime(sf_events['d+1']) - pd.to_datetime(sf_events['date_stamp'])).dt.days == 1) &
    ((pd.to_datetime(sf_events['d+2']) - pd.to_datetime(sf_events['d+1'])).dt.days == 1)
]['user_id'].drop_duplicates()
- The dataset has already been loaded as a pandas.DataFrame.
- print() functions and the last line of code will be displayed in the output.
- In order for your solution to be accepted, your solution should be located on the last line of the editor and match the expected output data type listed in the question.
Business Metrics and KPIs

Reporting KPIs and monitoring various model results is a key aspect of any Data Scientist’s day-to-day work. A lot of Python Data Science Interviews, especially at entry levels test the ability of a candidate to calculate metrics and develop business reports. These python interview questions test a combination of a candidate’s business understanding, a sense of how the data should be organized and coding skills. Here, we illustrate some of the commonly used metrics that are widely used by most businesses and how to create them.
Business Metrics and KPIs: Ranking
Positions or Ranks are one of the most reported numbers in most KPIs. There can be multiple use cases for ranks – top selling products, most cost-effective channels, best performing ads, et al. Let us look at a couple of problems from Python Data Science interviews that required the candidate to use ranking concepts.
The first one is from the City of San Francisco.
8. Find the top 5 highest paid and top 5 least paid employees in 2012
Find the top 5 highest paid and top 5 least paid employees in 2012. Output the employee’s name along with the corresponding total pay with benefits. Sort records based on the total payment with benefits in ascending order.
Find the top 5 highest paid and top 5 least paid employees in 2012
Find the top 5 highest paid and top 5 least paid employees in 2012. Output the employee name along with the corresponding total pay with benefits. Sort records based on the total payment with benefits in ascending order.
You can solve this problem here: https://platform.stratascratch.com/coding/9979-find-the-top-5-highest-paid-and-top-5-least-paid-employees-in-2012
The dataset has the following fields.
Approach
- This is a relatively straightforward problem.
- We start off by subsetting the data for 2012.
- We then sort it in ascending order by the column totalpaybenefits.
- Finally, we take the first five and the last five rows and out the relevant fields.
Solution
# Import your libraries
import pandas as pd

# take the 2012 data and sort
yr_2012 = sf_public_salaries[sf_public_salaries['year'] == 2012].sort_values(by =
['totalpaybenefits'])

# take the first 5 and the bottom 5 rows.
yr_2012[:5].append(yr_2012[-5:], ignore_index = True)[
['employeename', 'totalpaybenefits']]- The dataset has already been loaded as a pandas.DataFrame.
- print() functions and the last line of code will be displayed in the output.
- In order for your solution to be accepted, your solution should be located on the last line of the editor and match the expected output data type listed in the question.
Let us try a more difficult one. This is from an Airbnb Data Science Interview.
9. Ranking Hosts By Beds
Rank the AirBnB hosts based on the number of beds they have listed. The host with the most beds should be ranked highest and one with the least number of beds should be ranked last. Hosts with the same number of beds should have the same rank. A host may own multiple properties. Report the host ID, number of beds, and rank from highest rank to lowest.
Ranking Hosts By Beds
Last Updated: July 2020
Rank each host based on the number of beds they have listed. The host with the most beds should be ranked 1 and the host with the least number of beds should be ranked last. Hosts that have the same number of beds should have the same rank but there should be no gaps between ranking values. A host can also own multiple properties. Output the host ID, number of beds, and rank from highest rank to lowest.
You can solve the problem here: https://platform.stratascratch.com/coding/10161-ranking-hosts-by-beds
The dataset has the following fields.
Approach (Pandas)
- As mentioned in the problem, hosts may have multiple properties listed on the platform. Therefore, before we start ranking, we need to sum up the total number of beds that a host has.
- We then rank these hosts based on the total number beds listed.
- Finally, we sort the hosts by their ranks and output the results.
Solution (Pandas)
# Import your libraries
import pandas as pd

# roll up the number of beds for a host
hosts_summ = airbnb_apartments.groupby(by = ['host_id'],
as_index = False).sum()[['host_id','n_beds']]

# Rank the hosts by the number of beds, with the highest getting the best rank
hosts_summ['rank'] = hosts_summ['n_beds'].rank(method = 'dense',
ascending = False)

# sort the output by rank in ascending order
hosts_summ.sort_values(by = ['rank'])
Approach (Polars)
The Polars approach is overall the same as in pandas. However, the Polars version performs all steps – aggregation, ranking, and sorting – in a single chained expression, using column expressions and functional-style transformations that avoid modifying intermediate DataFrames.
Solution (Polars)
import polars as pl

result = (
    airbnb_apartments.group_by("host_id")
    .agg(pl.col("n_beds").sum().alias("number_of_beds"))
    .with_columns(
        rank=pl.col("number_of_beds").rank(method="dense", descending=True)
    )
    .sort("rank")
)
- The dataset has already been loaded as a pandas.DataFrame.
- print() functions and the last line of code will be displayed in the output.
- In order for your solution to be accepted, your solution should be located on the last line of the editor and match the expected output data type listed in the question.
Business Metrics and KPIs: Aggregations
Aggregations are bread and butter for most Data Scientists. It is not possible to inspect each data point, therefore aggregations are used to examine trends, outliers, and possible relationships. For Data Analyst positions, these are even more important. Let us look at some examples that use aggregation functions.
The first one is from Whole Foods Market Data Science Interview.
10. Products Report Summary
Find the number of transactions and total sales for each of the product categories in 2017. Output the product categories, number of transactions, and total sales in descending order. The sales column represents the total cost the customer paid for the product so no additional calculations need to be done on the column. Only include product categories that have products sold.
Products Report Summary
Last Updated: June 2021
Find the number of unique transactions and total sales for each of the product categories in 2017. Output the product categories, number of transactions, and total sales in descending order. The sales column represents the total cost the customer paid for the product so no additional calculations need to be done on the column. Only include product categories that have products sold.
You can solve the full problem here: https://platform.stratascratch.com/coding/2039-products-report-summary
The problem uses two datasets. The dataset wfm_transactions has the following fields
The second dataset is named wfm_products and contains the following fields.
Approach
- We start off by merging the two datasets using the product_id key. Since we need only the products that have at least one transaction, we perform a left join.
- Next, we need to subset only the transactions that were made in the year 2017. We invoke the year method on the transaction_dt timestamp object for this.
- Finally, we aggregate the sales and the number of transactions by the product_category field, and report the results after sorting them in the descending order of the sales.
Solution
import pandas as pd

result = pd.merge(wfm_transactions, wfm_products, how='inner', on='product_id')[['product_category', 'transaction_id', 'sales', 'transaction_date']]
result = result[result['transaction_date'].dt.year == 2017].groupby('product_category').agg({'transaction_id':['nunique'],'sales':['sum']})
result.columns = result.columns.droplevel(0)
result = result.reset_index().rename(columns={'count':'transactions', 'sum':'sales'})
result.sort_values('sales', ascending=False)
- The dataset has already been loaded as a pandas.DataFrame.
- print() functions and the last line of code will be displayed in the output.
- In order for your solution to be accepted, your solution should be located on the last line of the editor and match the expected output data type listed in the question.
The second one is from a Noom Data Science Interview.
11. Signups By Billing Cycle
Write a query that returns a table containing the number of signups for each weekday and for each billing cycle frequency. The week standard is from Sunday as 0 to Saturday as 6. Report the signups with the weekday number (e.g., 1, 2, 3) as rows in your table and the billing cycle frequency (e.g., annual, monthly, quarterly) as columns.
The NULLs should be replaced with zeroes.
Signups By Billing Cycle
Last Updated: April 2021
Write a query that returns a table containing the number of signups for each weekday and for each billing cycle frequency. The day of the week standard we expect is from Sunday as 0 to Saturday as 6.
Output the weekday number (e.g., 1, 2, 3) as rows in your table and the billing cycle frequency (e.g., annual, monthly, quarterly) as columns. If there are NULLs in the output replace them with zeroes.
You can solve the full problem here: https://platform.stratascratch.com/coding/2032-signups-by-billing-cycle
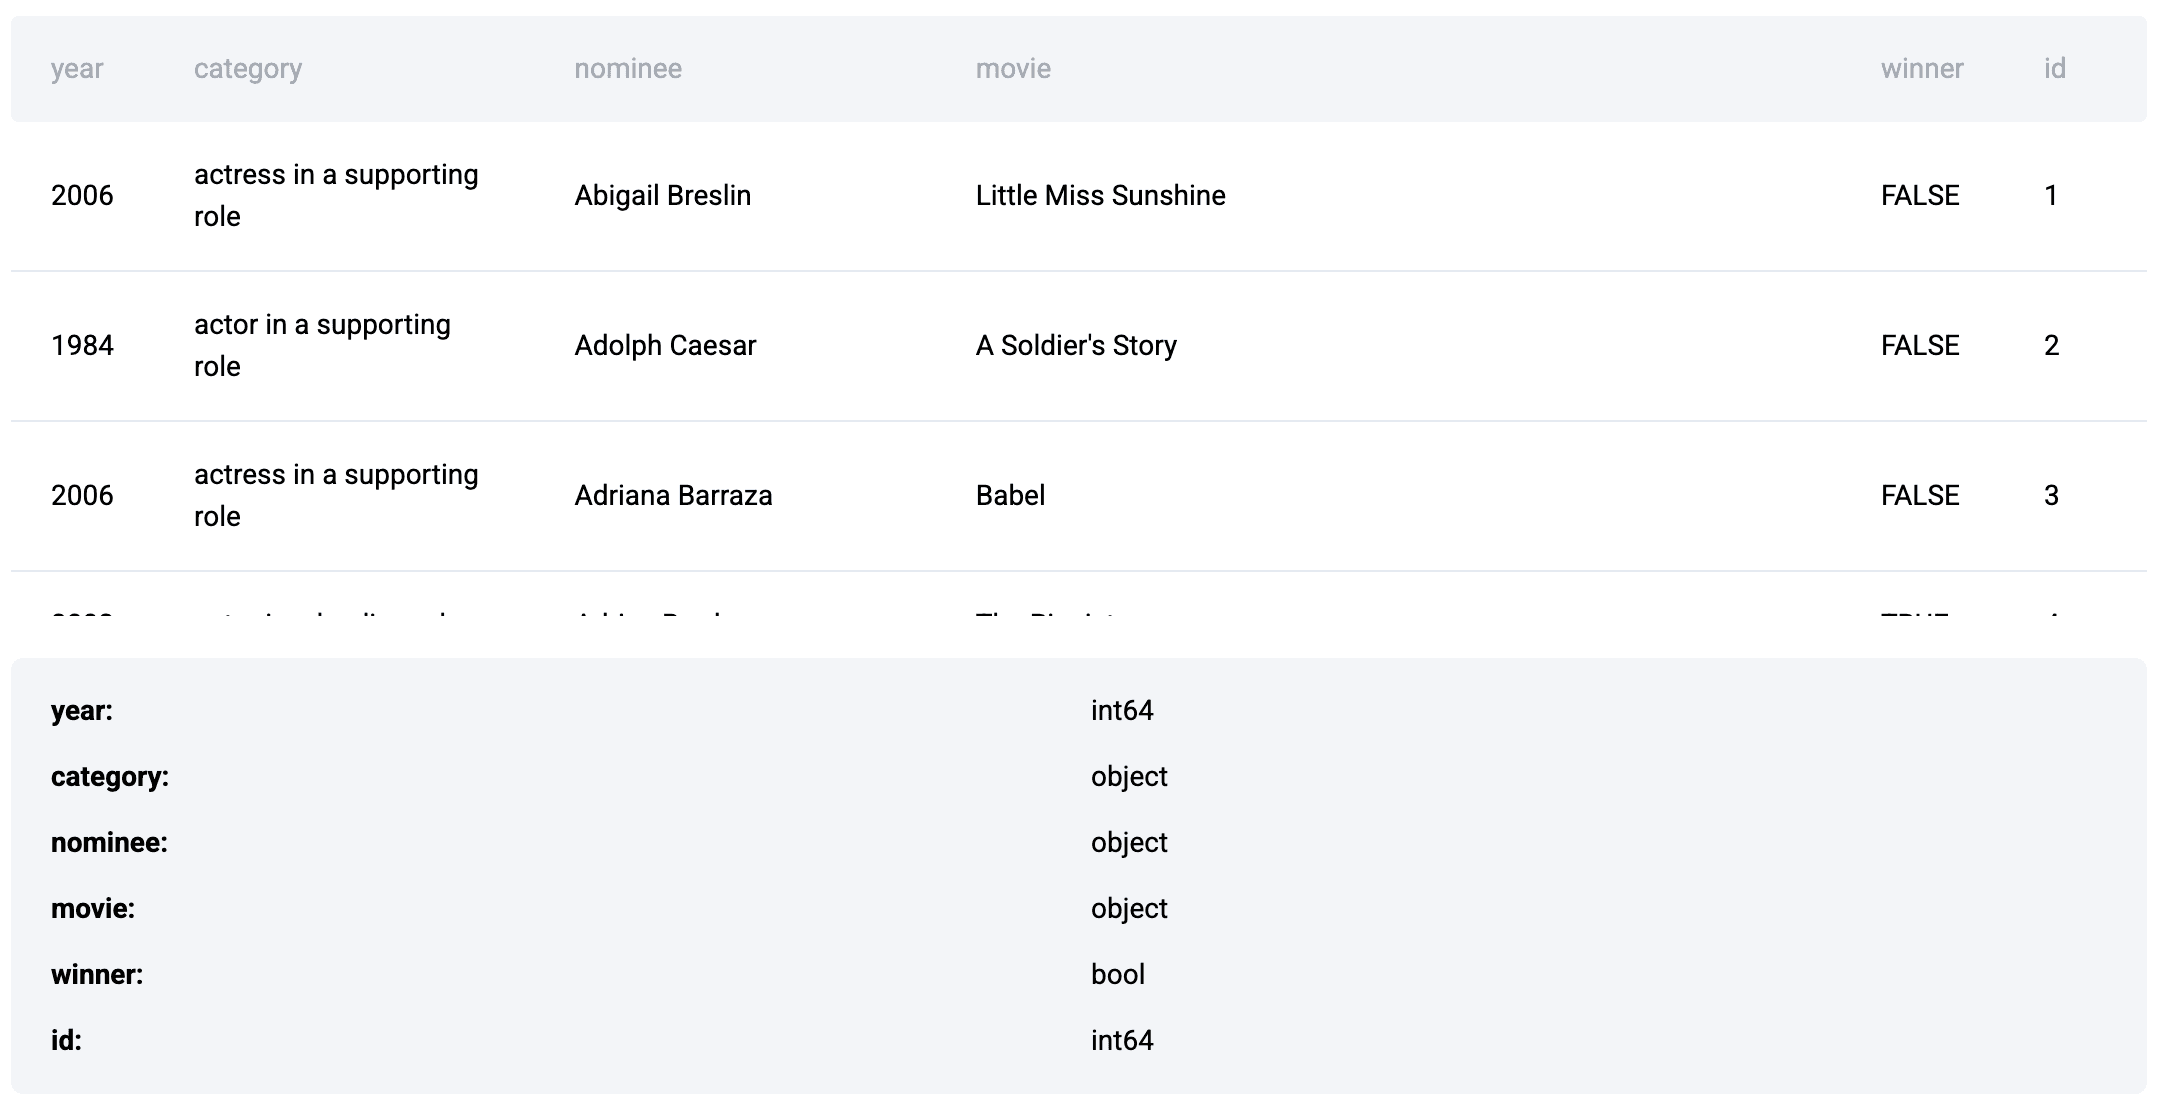
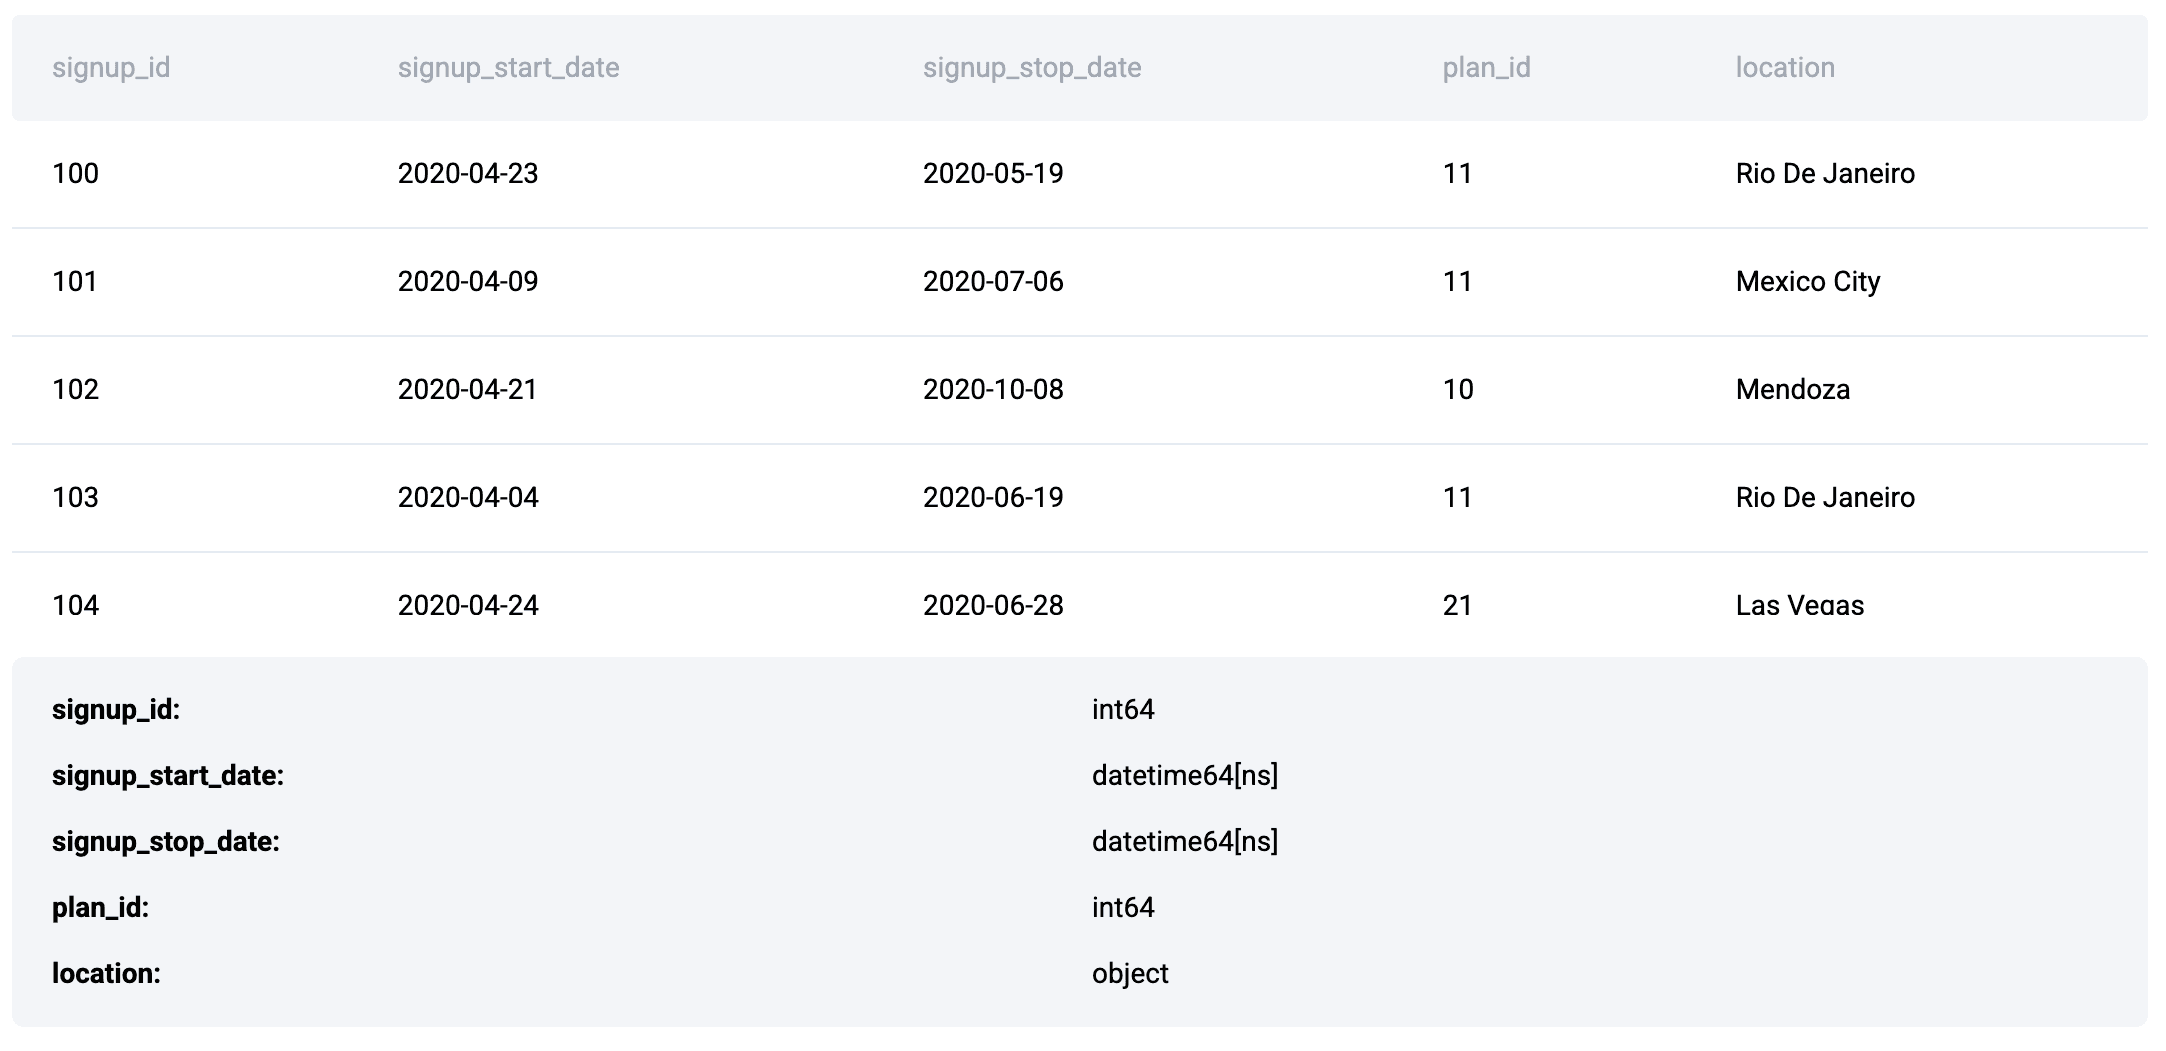
This Python interview question uses two datasets. The signups dataset contains the following fields
The plans table contains these fields
Approach
- Since we need the billing cycle from the second table, let us merge the two tables. The join keys will be the signup_id field in the signups table and the id field in the plans table.
- Then we need to create a field for identifying the day of the week. We can use the weekday method for a datetime object for this. In addition, we need to shift days forward by one position so Monday becomes 1 and Sunday becomes 7 (the default is Monday as 0, Sunday as 6), and wrap Sunday (now 7) back to 0 using the modulo operation.
- Finally we can generate the report on one line using the pivot table method. We use the weekday for rows, billing cycle for columns and count method for aggregation.
Solution
import pandas as pd

# merge the datasets
merged_df = pd.merge(signups, plans, left_on = 'plan_id', right_on = 'id',
how = 'left')

# Get the weekday
merged_df['weekday'] = (merged_df['signup_start_date'].dt.weekday + 1) % 7

# Create the report
pd.pivot_table(data = merged_df, values = 'avg_revenue',
columns = 'billing_cycle',
aggfunc = 'count', index = 'weekday').fillna(0).reset_index()
- The dataset has already been loaded as a pandas.DataFrame.
- print() functions and the last line of code will be displayed in the output.
- In order for your solution to be accepted, your solution should be located on the last line of the editor and match the expected output data type listed in the question.
Business Metrics and KPIs: Profit and Profitability
Another group of business metrics that are very widely used and requested are those involving profits and profitability. These metrics usually require you to drill down the overall numbers into subcategories like location, product, segment, et al. Familiarity with aggregation methods is critical to solving these problems in Python. These problems might also require you to calculate the metric in a very specific manner, so read the python interview questions very carefully when solving these problems. Here look at a problem that was asked in a Noom Data Science Interview.
12. Find The Most Profitable Location
Calculate the average signup duration and average revenue for each location. Compare these two measures by taking the ratio of the average revenue and average duration for each location. Report the location, average duration, average revenue, and ratio. Sort your results from highest ratio to lowest.
Find The Most Profitable Location
Last Updated: April 2021
Find the most profitable location. Write a query that calculates the average signup duration in days and the average transaction amount for each location. Then, calculate the ratio of average transaction amount to average duration.
Your output should include the location, average signup duration (in days), average transaction amount, and the ratio. Sort the results by ratio in descending order.
You can solve the problem here: https://platform.stratascratch.com/coding/2033-find-the-most-profitable-location
The problem involves two datasets. signups and transactions.
The transactions dataset contains the following fields
Approach
- This problem looks straightforward but can lead to wrong results if one is not careful.
- The problem lies in the way the data is arranged. There might be multiple transactions with the same signup id. If we merge the datasets together and then calculate the duration, it will lead to duplicated values of duration and therefore the wrong mean.
- To overcome this problem, we calculate the two averages separately and then merge the dataset.
- We first calculate the duration from the signups dataset and summarize it by taking the average value for a location.
- To get the average transaction value for each location, we pull the location from the signups dataset into the transactions dataset. Then we calculate the average transaction amounts for each location.
- Then, we merge the two summary datasets together and calculate the ratio as defined in the problem.
- Finally, we report the numbers sorted in descending order of the calculated ratio.
Solution
# Import your libraries
import pandas as pd

# Calculate the duration of signups
signups['duration'] = (signups['signup_stop_date'] - signups
['signup_start_date']).dt.days
# Get the average duration
avg_dur_df = signups.groupby(by = ['location'], as_index = False).mean()

# Get the location_id from the signups dataset
merged_df = pd.merge(left = transactions, right = signups
[['signup_id', 'location']],
on = 'signup_id', how = 'left')
# Summarize by location
trans_df = merged_df.groupby(by = ['location'], as_index = False).mean()

# Merge the dataframes keeping only the relevant columns
final_merged_df = pd.merge(avg_dur_df[['location', 'duration']], trans_df[
    ['location', 'amt']], on = 'location', how = 'inner')

# Calculate ratio, sort and submit.
final_merged_df['ratio'] = final_merged_df['amt'] / final_merged_df['duration']
final_merged_df.sort_values(by = ['ratio'], ascending = False)
- The dataset has already been loaded as a pandas.DataFrame.
- print() functions and the last line of code will be displayed in the output.
- In order for your solution to be accepted, your solution should be located on the last line of the editor and match the expected output data type listed in the question.
Business Metrics and KPIs: Churn and Retention
Account Retention and Churn (number of accounts leaving the platform) is a critical metric for all businesses. It is easier to transact with existing accounts versus trying to add more accounts to the platform. All businesses track churn and retention numbers closely and a lot of Data Science Interviews will involve these metrics in one form or the other. Here, we look at a couple of problems that involve churn, retention rates and associated measures.
The first one is from Lyft Data Science Interview.
13. Year Over Year Churn
Determine whether the churn rate of drivers increased or decreased in each year compared to the previous one. Report the year the drivers left Lyft along with the corresponding number of churns in that year, the number of churns in the previous year, and an indication on whether the number has been increased (output the value 'increase') or decreased (output the value 'decrease'). Sort the records by the year in ascending order.
You can solve the problem here: https://platform.stratascratch.com/coding/10017-year-over-year-churn
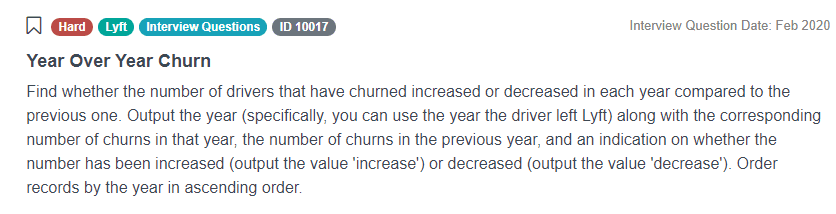
The problem uses lyft_drivers dataset that contains the following fields
Approach
- We start off by converting end_date field to DateTime type.
- Then we create a new column, churn, which gets a value of 1 if the driver has an 'end_date' (i.e., the driver has left the platform) and 0 otherwise.
- After that, we extract the year from the end_date column and store it in a new column named year_left.
- The next step is to aggregate the data by year_left and sum up the churn for each year.
- We create a new column named prev_year_churn which shifts the total_churn column down by one row, essentially representing the churn from the previous year for each given year.
- Since there's no previous year's data for the first row, its prev_year_churn value is set to 0.
- The column inc/dec is created, which compares the total_churn of a year with its previous year's churn. If the current year's churn is greater, it gets the value 'increase'. If less, it gets 'decrease'. If equal, it gets 'no change'.
Solution
import pandas as pd
import numpy as np

lyft_drivers['end_date'] = lyft_drivers['end_date'].apply(pd.to_datetime)
lyft_drivers['churn'] = (lyft_drivers['end_date'].notnull()).astype(int)
lyft_drivers['year_left'] = lyft_drivers['end_date'].dt.year
result = lyft_drivers.groupby(['year_left'])['churn'].sum().to_frame('total_churn').reset_index()
result['prev_year_churn'] = result['total_churn'].shift(1)
result['prev_year_churn'][0] = 0
result['inc/dec'] = np.select([result.total_churn > result.prev_year_churn,result.total_churn < result.prev_year_churn,result.total_churn == result.prev_year_churn],['increase','decrease','no change'])
result
- The dataset has already been loaded as a pandas.DataFrame.
- print() functions and the last line of code will be displayed in the output.
- In order for your solution to be accepted, your solution should be located on the last line of the editor and match the expected output data type listed in the question.
Let us try a more difficult one. This one is from a Salesforce Data Science Interview.
14. Retention Rate
Compare the retention rates in Jan 2021 over that of Dec 2020. Retention rate is defined as the percentage of users a business retains over a given period of time. Assume that the user is retained if he stays with the app in any future months. Your output should have account_id and the Jan 2021 retention rate divided by Dec 2020 retention rate.
Retention Rate
Last Updated: July 2021
You are given a dataset that tracks user activity. The dataset includes information about the date of user activity, the account_id associated with the activity, and the user_id of the user performing the activity. Each row in the dataset represents a user’s activity on a specific date for a particular account_id.
Your task is to calculate the monthly retention rate for users for each account_id for December 2020 and January 2021. The retention rate is defined as the percentage of users active in a given month who have activity in any future month.
For instance, a user is considered retained for December 2020 if they have activity in December 2020 and any subsequent month (e.g., January 2021 or later). Similarly, a user is retained for January 2021 if they have activity in January 2021 and any later month (e.g., February 2021 or later).
The final output should include the account_id and the ratio of the retention rate in January 2021 to the retention rate in December 2020 for each account_id. If there are no users retained in December 2020, the retention rate ratio should be set to 0.
You can solve the full problem here: https://platform.stratascratch.com/coding/2053-retention-rate
The problem uses the sf_events dataset that has the following fields.
Approach
- We can split the problem into two parts.
- Finding retention rates for each month
- Let us begin by finding the retention rate for December 2020.
- We need to get the base numbers for December 2020. To get this, we need to get all those users who logged into the app in December 2020. We remove duplicates to ensure that a user is counted only once.
- Then we get all those users that logged onto the app after December 2020.
- We merge these two datasets keeping only the users that logged in December 2020.
- We can now summarize by account_id and calculate the retention rate for December 2020.
- We can repeat the process for January 2021 to get those numbers.
- Comparing the retention rate for the two months
- Once we have the retention rate datasets for December 2020 and January 2021, we can simply merge the two datasets and calculate the retention ratio. We will again use a left join (with the December dataset being the left table) as we need to compare December values with January ones.
Solution
# Import your libraries
import pandas as pd

# Get accounts active in December 2020
dec2020 = sf_events[
    (sf_events['record_date'].dt.year == 2020) &
    (sf_events['record_date'].dt.month == 12)
].drop_duplicates(subset=['account_id', 'user_id'])
dec2020['in_dec'] = 1

# Get accounts active after December 2020
aft_dec2020 = sf_events[
    sf_events['record_date'].dt.date > pd.to_datetime('2020-12-31')
].drop_duplicates(subset=['account_id', 'user_id'])
aft_dec2020['aft_dec'] = 1

# Merge to calculate December retention
dec_merged = pd.merge(dec2020, aft_dec2020, on=['account_id', 'user_id'], how='left')
dec_summ = dec_merged.groupby('account_id', as_index=False).sum(numeric_only=True)
dec_summ['dec_retention'] = dec_summ['aft_dec'] / dec_summ['in_dec']

# Get accounts active in January 2021
jan2021 = sf_events[
    (sf_events['record_date'].dt.year == 2021) &
    (sf_events['record_date'].dt.month == 1)
].drop_duplicates(subset=['account_id', 'user_id'])
jan2021['in_jan'] = 1

# Get accounts active after January 2021
aft_jan2021 = sf_events[
    sf_events['record_date'].dt.date > pd.to_datetime('2021-01-31')
].drop_duplicates(subset=['account_id', 'user_id'])
aft_jan2021['aft_jan'] = 1

# Merge to calculate January retention
jan_merged = pd.merge(jan2021, aft_jan2021, on=['account_id', 'user_id'], how='left')
jan_summ = jan_merged.groupby('account_id', as_index=False).sum(numeric_only=True)
jan_summ['jan_retention'] = jan_summ['aft_jan'] / jan_summ['in_jan']

# Final merge and relative retention calculation
final_merge = pd.merge(dec_summ, jan_summ, on='account_id', how='left')
final_merge['retention'] = final_merge['jan_retention'] / final_merge['dec_retention']

# Output only the relevant columns
final_merge[['account_id', 'retention']]
- The dataset has already been loaded as a pandas.DataFrame.
- print() functions and the last line of code will be displayed in the output.
- In order for your solution to be accepted, your solution should be located on the last line of the editor and match the expected output data type listed in the question.
Business Metrics and KPIs: Loss Prevention
Loss prevention and fraud detection is a critical aspect of every business. Businesses must be at the top of their game to understand loss making portfolios and manage frauds. Here we look at some loss prevention problems that have appeared in Data Science interviews.
The first one is a relatively simple one from a Netflix Data Science Interview.
15. Top Percentile Fraud
The claims are assigned a fraud score. You need to find the top 5 percentile of claims with the highest fraud scores in each state, because they are considered potentially fraudulent.
Top Percentile Fraud
Last Updated: November 2020
We want to identify the most suspicious claims in each state. We'll consider the top 5% of claims (those at or above the 95th percentile of fraud scores) in each state as potentially fraudulent.
Your output should include the policy number, state, claim cost, and fraud score.
You can solve the full problem here: https://platform.stratascratch.com/coding/10303-top-percentile-fraud
The problem uses the fraud_score dataset with the following fields.
Approach
- This is a relatively straightforward problem that can be solved using the rank method. We use the rank method with the pct = True option to get percentile values.
- To rank (and calculate percentiles) for each state, we use the groupby method.
- Finally, we subset the top 5% of the frauds (equal to and above the 95th percentile) and report the values.
Solution
# Import your libraries
import pandas as pd

# Calculate Percentile Rank
fraud_score['pctile'] = fraud_score.groupby(by =
['state'])['fraud_score'].rank(pct = True)

# Keep only the top 5%
fraud_score[fraud_score['pctile'] >= 0.95].drop(columns = 'pctile')
- The dataset has already been loaded as a pandas.DataFrame.
- print() functions and the last line of code will be displayed in the output.
- In order for your solution to be accepted, your solution should be located on the last line of the editor and match the expected output data type listed in the question.
Let us try a more difficult problem. This one is from an Uber Data Science Interview.
16. Percentage Of Revenue Loss
Calculate the percentage of incomplete orders along with the revenue loss percentage for each service category. Output the name of the service, percentage of incomplete orders, and revenue loss from the incomplete orders.
Percentage Of Revenue Loss
Last Updated: June 2021
For each service, calculate the percentage of incomplete orders along with the percentage of revenue loss from incomplete orders relative to total revenue.
Your output should include:
• The name of the service • The percentage of incomplete orders • The percentage of revenue loss from incomplete orders
You can solve this problem here: https://platform.stratascratch.com/coding/2048-percentage-of-revenue-loss
The problem uses the uber_orders dataset that contains the following fields.
Approach (Pandas)
- This python interview question requires us to summarize the dataset twice. Once for the entire range of values and then for incomplete orders. We create two summary datasets aggregated by the service_name field.
- We then merge the two datasets and calculate the percentage loss numbers for transactions and monetary value and output the relevant fields.
Solution (Pandas)
# Import your libraries
import pandas as pd

# Get the overall numbers
overall_df = uber_orders.groupby(by = ['service_name'], as_index = False).sum()

# Summarize incomplete orders
loss_df = uber_orders[uber_orders['status_of_order'] != 'Completed'].groupby(by = ['service_name'], as_index = False).sum()

# Merge the datasets
summ_df = pd.merge(overall_df, loss_df, on = 'service_name', how = 'left',
suffixes = ['_total', '_loss'])

# Calculate loss metrics and output the relevant columns
summ_df['loss_order_pct'] = summ_df['number_of_orders_loss'] / summ_df['number_of_orders_total'] * 100
summ_df['loss_value_pct'] = summ_df['monetary_value_loss'] / summ_df['monetary_value_total'] * 100
summ_df[['service_name', 'loss_order_pct', 'loss_value_pct']]
Approach (Polars)
- This Python interview question requires us to summarise the data twice – first for all orders, then specifically for incomplete ones. We use `.group_by()` and `.agg()` to compute the total number of orders and potential profit per service.
- Next, we repeat the process but filter the dataset to only include incomplete orders (i.e., status not equal to "Completed"), summing up their lost value and order count.
- We then join the two summaries by service_name and calculate the percentage of lost orders and lost profit.
- Finally, we select the relevant output columns to show the loss metrics for each service.
Solution (Polars)
import polars as pl

final_result = (
    uber_orders.lazy()
    # Step 1: Create total revenue and total orders
    .group_by('service_name')
    .agg([
        pl.col('monetary_value').sum().alias('possible_profit'),
        pl.col('number_of_orders').sum().alias('total_orders')
    ])
    # Step 2: Join with incomplete orders' losses
    .join(
        uber_orders.lazy()
        .filter(pl.col('status_of_order') != 'Completed')
        .group_by('service_name')
        .agg([
            pl.col('monetary_value').sum().alias('lost_profit'),
            pl.col('number_of_orders').sum().alias('lost_orders_number')
        ]),
        on='service_name',
        how='inner'
    )
    # Step 3: Calculate loss percentages
    .with_columns([
        (pl.col('lost_orders_number') / pl.col('total_orders') * 100).alias('orders_loss_percent'),
        (pl.col('lost_profit') / pl.col('possible_profit') * 100).alias('profit_loss_percent')
    ])
    # Step 4: Select final columns
    .select([
        'service_name',
        'orders_loss_percent',
        'profit_loss_percent'
    ])
    .collect()
)

final_result
- The dataset has already been loaded as a pandas.DataFrame.
- print() functions and the last line of code will be displayed in the output.
- In order for your solution to be accepted, your solution should be located on the last line of the editor and match the expected output data type listed in the question.
Business Metrics and KPIs: Forecasting
Forecasting is a critical part of any business to ensure that one does not suffer from stock outs or over supply of inventory. This is a slightly complex business problem that appeared in Uber Data Science Interviews.
17. Naive Forecasting
Develop a naive forecast for a new metric called "distance per dollar" defined as the (distance_to_travel/monetary_cost) in our dataset and measure its accuracy. A naive forecast is simply the value of the previous observation. Distance to travel is defined as the ratio of the “distance to travel” and “monetary cost” fields. The forecast number is the monthly aggregate across all trips for the previous month.
To check the accuracy of the forecast, we use the Root Mean Squared Error (RMSE) Metric. RMSE is defined as sqrt(mean(square(actual - forecast)).
Output the RMSE rounded to the 2nd decimal spot as the result.
Naive Forecasting
Last Updated: December 2020
Some forecasting methods are extremely simple and surprisingly effective. Naïve forecast is one of them; we simply set all forecasts to be the value of the last observation. Our goal is to develop a naïve forecast for a new metric called "distance per dollar" defined as the (distance_to_travel/monetary_cost) in our dataset and measure its accuracy.
Our dataset includes both successful and failed requests. For this task, include all rows regardless of request status when aggregating values.
To develop this forecast, sum "distance to travel" and "monetary cost" values at a monthly level before calculating "distance per dollar". This value becomes your actual value for the current month. The next step is to populate the forecasted value for each month. This can be achieved simply by getting the previous month's value in a separate column. Now, we have actual and forecasted values. This is your naïve forecast. Let’s evaluate our model by calculating an error matrix called root mean squared error (RMSE). RMSE is defined as sqrt(mean(square(actual - forecast)). Report out the RMSE rounded to the 2nd decimal spot.
You can solve the problem here: https://platform.stratascratch.com/coding/10313-naive-forecasting
The problem uses the following dataset
Approach
- There are two major challenges to solve this set.
- We first need to extract the month from the timestamp. To do this, we construct a string using the date methods.
- Then we summarize the dataset based on this month.
- Remember, we need to calculate the monthly value of the distance_to_travel and monetary_cost.
- For this, we sum the two columns across months and then take a ratio. If we take the average of individual distance_to_travel to monetary_cost ratios, it will give the wrong answer.
- We then use the shift method to get the previous month’s value as the naïve forecast for the next month.
- Finally, we calculate the RMSE as per the formula given in the problem, round off the result to two decimal places and out the result.
Solution
# Import your libraries
import pandas as pd
import numpy as np

# Create the month field from the date
uber_request_logs['month'] = pd.to_datetime(uber_request_logs
['request_date'].apply
(lambda x : str(x.year) + str(x.month).zfill(2) + '01')).dt.date

# Summarize the dataset by month
uber_summ = uber_request_logs.groupby(by = ['month'], as_index = False).sum().sort_values(by = ['month'])

# Calculate the distance per dollar metric
uber_summ['dist_per_dollar'] = uber_summ['distance_to_travel'] / uber_summ['monetary_cost']

# Pull the Naive Forecast
uber_summ['forecast'] = uber_summ['dist_per_dollar'].shift(1)

# Calculate RMSE and round to two decimal places
round(np.sqrt(((uber_summ['dist_per_dollar'] - uber_summ
['forecast']) **2).mean()),2)
- The dataset has already been loaded as a pandas.DataFrame.
- print() functions and the last line of code will be displayed in the output.
- In order for your solution to be accepted, your solution should be located on the last line of the editor and match the expected output data type listed in the question.
Text Manipulation

While traditionally a lot of data storage systems contain tabular data, over the last decade, there has been an explosion of unstructured data usually stored in JSON and text format. Working with these data types presents a different challenge compared to working with traditional databases. Here we look at a few text wrangling problems that have appeared in Python Data Science Interviews.
We start off with an easy one. This appeared in a Yelp Data Science Interview.
18. Reviews of Categories
Find the total number of reviews for each category. Output the total number of reviews and the category ordered by the number of reviews with the category having the highest number of reviews coming first and the one with lowest last.
Reviews of Categories
Last Updated: March 2020
Calculate number of reviews for every business category. Output the category along with the total number of reviews. Order by total reviews in descending order.
You can solve the problem here: https://platform.stratascratch.com/coding/10049-reviews-of-categories
The problem uses the yelp_business dataset that has the following fields.
Approach
- The fields that are of interest to us are review_count and categories.
- As one can see, a restaurant can belong to multiple categories. Therefore, we need to split the categories string and count the reviews in each of the resultant categories.
- To do this quickly, we first convert the string into a list of categories. We then invoke the string method split(), using a semicolon (;) as the delimiter.
- Once we get the list, we can call the explode method on the column to get each individual category as a separate row with the rest of the data duplicated.
- Finally, we can summarize by the individual categories, sort in descending order of the reviews and output the result.
Solution
# Import your libraries
import pandas as pd

# convert categories into a list
yelp_business['category_list'] = yelp_business['categories'].str.split(';')

# Explode the category list, summarize by the resultant categories, sort and submit
yelp_business.explode('category_list').groupby(by = ['category_list'],
as_index = False).agg({'review_count' : 'sum'}).sort_values(by = 'review_count', ascending = False)
- The dataset has already been loaded as a pandas.DataFrame.
- print() functions and the last line of code will be displayed in the output.
- In order for your solution to be accepted, your solution should be located on the last line of the editor and match the expected output data type listed in the question.
Let us try a slightly more difficult problem. This one came up in a Google Data Science Interview.
19. Find the number of times each word appears in drafts
Output the number of times each word appears in drafts. Report the word and the corresponding number of occurrences.
Count Occurrences Of Words In Drafts
Find the number of times each word appears in the contents column across all rows in the google_file_store dataset. Output two columns: word and occurrences.
You can solve this problem here: https://platform.stratascratch.com/coding/9817-find-the-number-of-times-each-word-appears-in-drafts
The problem uses the following dataset
Approach
- We start with the full dataset and split each document's content into a list of words, then explode them so each word becomes a separate row.
- We clean the words by removing punctuation and converting them to lowercase for consistent counting.
- Finally, we group by each word and count its occurrences, returning the result sorted by frequency.
Solution
import pandas as pd

df = google_file_store  # your existing DataFrame with columns ['filename', 'contents']

df_exploded = df.assign(words=df["contents"].str.split()).explode("words")

# Remove punctuation from each splitted token
df_exploded["words"] = (
df_exploded["words"]
.str.replace(r"[^\w\s]", "", regex=True)
.str.lower())

result_df = (
df_exploded.groupby("words")
.size()
.reset_index(name="occurrences")
.rename(columns={"words": "word"})
.sort_values("occurrences", ascending=False))
- The dataset has already been loaded as a pandas.DataFrame.
- print() functions and the last line of code will be displayed in the output.
- In order for your solution to be accepted, your solution should be located on the last line of the editor and match the expected output data type listed in the question.
Let us finish text manipulation with a problem involving string matching. This came up in a City of San Francisco Data Science Interview.
20. Classify Business Type
Classify each business as per the following criteria.
- If the word ‘restaurant’ appears in the business name, classify it as a restaurant.
- If the words ‘café’, ‘coffee’, or 'café' appear in the business name, then it should be classified as a cafe.
- If the word ‘school’ appears in the business name, then classify it as a school.
- All other businesses not satisfying any of the above conditions should be classified under other.
Classify Business Type
Last Updated: May 2018
Classify each business as either a restaurant, cafe, school, or other.
• A restaurant should have the word 'restaurant' in the business name. This includes common international or accented variants, such as “restaurante”, “restauranté”, etc. • A cafe should have either 'cafe', 'café', or 'coffee' in the business name. • A school should have the word 'school' in the business name. • All other businesses should be classified as 'other'. • Ensure each business name appears only once in the final output. If multiple records exist for the same business, retain only one unique instance.
The final output should include only the distinct business names and their corresponding classifications.
You can solve the problem here: https://platform.stratascratch.com/coding/9726-classify-business-type
The problem uses the following dataset
Approach
- The only field of interest here is the business_name.
- We use multiple if conditions inside a lambda function.
- We check the business names as per each of the classification rules and assign a category
- Finally, we output the business names with their categories
Solution
# Import your libraries
import pandas as pd

# Classify as per the rules
sf_restaurant_health_violations['category'] = sf_restaurant_health_violations['business_name'].apply(lambda x: \
'school' if x.lower().find('school') >= 0 \
else 'restaurant' if x.lower().find('restaurant') >= 0 \
else 'cafe' if (x.lower().find('cafe') >= 0 or x.lower().find('café') >= 0 \
or  x.lower().find('coffee') >= 0) \
else 'other'
    )


# Output relevant fields
sf_restaurant_health_violations[['business_name', 'category']].drop_duplicates()
- The dataset has already been loaded as a pandas.DataFrame.
- print() functions and the last line of code will be displayed in the output.
- In order for your solution to be accepted, your solution should be located on the last line of the editor and match the expected output data type listed in the question.
Product Specific Python Interview Questions
Besides these types, there are some problems that are very peculiar to the company and its products. Here we list ten such problems that will give you a very good understanding of the type of problems that you can expect. The idea behind these problems is to relate the concepts known to you with the products and services that a company offers and try to visualize the data setup, metrics that might be used and prepare for their Data Science Interview. You will also find a lot of concepts already covered thus far.
21. Airbnb Python Interview Question
Airbnb is an online marketplace for vacation stays, homestays and lodging. You can expect problems with cases presented in this setting.
City With Most Amenities
Given a dataset of searches for properties on Airbnb, find the city with the most amenities across all their host's properties. Assume that each search result (i.e., each row) represents a unique host. Output the name of the city as your solution.
City With Most Amenities
Last Updated: February 2018
You're given a dataset of searches for properties on Airbnb. For simplicity, let's say that each search result (i.e., each row) represents a unique host. Find the city with the most amenities across all their host's properties. Output the name of the city.
You can try the full problem here: https://platform.stratascratch.com/coding/9633-city-with-most-amenities
The problem uses the following dataset
Approach
- While there are a lot of fields in the dataset, there solution just needs two: amenities and city
- We need to aggregate the number of amenities across all listings in a city. We start off by finding the number of amenities in a particular listing. To do this, we find the length of the amenities set.
- We then aggregate the amenities for each city and finally output the city with the highest number of amenities.
Solution
# Import your libraries
import pandas as pd

# get the number of number of amenities
airbnb_search_details['num_amenities'] = airbnb_search_details['amenities'].apply(lambda x : len(x))

# Summarize by city and output the city with the most amenities
airbnb_search_details.groupby(by = ['city'], as_index = False).agg({'num_amenities' : 'sum'}).sort_values(by = ['num_amenities'],
ascending = False)['city'].iloc[0]
- The dataset has already been loaded as a pandas.DataFrame.
- print() functions and the last line of code will be displayed in the output.
- In order for your solution to be accepted, your solution should be located on the last line of the editor and match the expected output data type listed in the question.
22. Amazon Python Interview Question
Amazon is one of the largest companies in the world. It operates across multiple product and service categories across the world. It is mostly known for its eponymous website.
Revenue Over Time
Given a table with users, their purchase amount, and date purchased, determine the three-month rolling average of the total revenues generated from purchases. Output the result sorted by the month from earliest to latest month.
Note: Exclude the returns which are represented by negative purchase values. For the first two months, calculate the average only up to that month.
Revenue Over Time
Last Updated: December 2020
Find the 3-month rolling average of total revenue from purchases given a table with users, their purchase amount, and date purchased. Do not include returns which are represented by negative purchase values. Output the year-month (YYYY-MM) and 3-month rolling average of revenue, sorted from earliest month to latest month.
A 3-month rolling average is defined by calculating the average total revenue from all user purchases for the current month and previous two months. The first two months will not be a true 3-month rolling average since we are not given data from last year. Assume each month has at least one purchase.
You can solve the problem here: https://platform.stratascratch.com/coding/10314-revenue-over-time
The problem uses the amazon_purchases dataset that has the following fields.
Approach
- We start off by excluding the return transactions. To do this, we keep only those transactions where the purchase_amt is positive.
- Then we extract the month from the date field.
- We then aggregate the purchases for each month. This results in a dataset with total monthly purchases.
- To calculate the rolling average, we call the rolling() method on the purchases column.
- To ensure that the values are calculated even for the first two months even though we do not have three months of data, we set min_periods to 1.
- Finally we subset the relevant fields and output the result.
Solution
# Import your libraries
import pandas as pd

# Remove refund transactions
pos_df = amazon_purchases[amazon_purchases['purchase_amt'] > 0]
# Create Month indicator
pos_df['month'] = pos_df['created_at'].apply(lambda x : str(x.year) + "-" +
str(x.month).zfill(2))

# Aggregate the purchases by month
summ_df = pos_df.groupby(by = ['month'], as_index = False).sum()[['month', 'purchase_amt']].sort_values(by = ['month'])

# Calculate the rolling average, ensure that the value is calculated even for the first two months
summ_df['roll_avg'] = summ_df['purchase_amt'].rolling(3, min_periods = 1).mean()

# Output relevant fields
summ_df[['month', 'roll_avg']]
- The dataset has already been loaded as a pandas.DataFrame.
- print() functions and the last line of code will be displayed in the output.
- In order for your solution to be accepted, your solution should be located on the last line of the editor and match the expected output data type listed in the question.
23. DoorDash Python Interview Question
Doordash is an online food delivery and ordering platform and is the largest such platform in the US. It also provides convenience store delivery services.
Avg Order Cost During Rush Hours
Find the average order cost during rush hours (3PM to 6PM) in San Jose. Order the results by hour.
Avg Order Cost During Rush Hours
Last Updated: May 2021
The company you work for has asked you to look into the average order value per hour during rush hours in the San Jose area. Rush hour is from 15H - 17H59 inclusive.
You have also been told that the column order_total represents the gross order total for each order. Therefore, you'll need to calculate the net order total.
The gross order total is the total of the order before adding the tip and deducting the discount and refund.
Use the column customer_placed_order_datetime for your calculations.
You can solve the full problem here: https://platform.stratascratch.com/coding/2035-avg-order-cost-during-rush-hours
The problem uses the following dataset
Approach
- We start by calculating the final order value for each delivery by adding the order_total and the tip_amount, then subtracting the sum of the discount_amount and the refunded_amount.
- Then we extract the hour from the order's DateTime using the lambda function.
- Finally, we filter the data, group by hour, and calculate the average.
Solution
import pandas as pd

delivery_details["final_order_value"] = (
    delivery_details["order_total"]
    + delivery_details["tip_amount"]
    - (delivery_details["discount_amount"] + delivery_details["refunded_amount"])
)
delivery_details["hour"] = delivery_details[
    "customer_placed_order_datetime"
].apply(lambda x: x.hour)
result = (
    delivery_details[
        (delivery_details["delivery_region"] == "San Jose")
        & (delivery_details["hour"].between(15, 17))
    ]
    .groupby(["hour"])["final_order_value"]
    .mean()
    .reset_index()
)
- The dataset has already been loaded as a pandas.DataFrame.
- print() functions and the last line of code will be displayed in the output.
- In order for your solution to be accepted, your solution should be located on the last line of the editor and match the expected output data type listed in the question.
24. Google Python Interview Question
Google is synonymous with search. One of the most valuable companies in the world Google operates in multiple domains.
Activity Rank
Email activity rank is calculated on the total number of emails sent, with the user with the highest number of emails sent given the top rank. Calculate the email activity rank for each user. If two users have sent the same number of emails, then the users are ranked in the alphabetical order of their IDs. Report the user id, number of emails sent and the rank. Output should be sorted by rank.
Activity Rank
Last Updated: July 2021
Find the email activity rank for each user. Email activity rank is defined by the total number of emails sent. The user with the highest number of emails sent will have a rank of 1, and so on. Output the user, total emails, and their activity rank.
• Order records first by the total emails in descending order. • Then, sort users with the same number of emails in alphabetical order by their username. • In your rankings, return a unique value (i.e., a unique rank) even if multiple users have the same number of emails.
You can try this problem here: https://platform.stratascratch.com/coding/10351-activity-rank
The problem uses the google_gmail_emails dataset that contains the following fields.
Approach
- The sender’s user id is the from_user column. Therefore, we summarize the dataset by the from_user field aggregating the number of emails sent.
- We sort the resultant dataset by descending order of number of emails sent. To break the ties, we use the alphabetical order of the user id as a secondary sort field.
- Finally, we create a rank field and output the relevant fields
Solution
# Import your libraries
import pandas as pd

# Get the number of mails sent by each user, sort by the results
summ_df = google_gmail_emails.groupby(by = ['from_user'], as_index = False).count().sort_values(by = ['id', 'from_user'], ascending = [False, True])

# Add a Rank field and output relevant fields
summ_df['rank'] = [i+1 for i in range(len(summ_df))]
summ_df[['from_user', 'id', 'rank']]
- The dataset has already been loaded as a pandas.DataFrame.
- print() functions and the last line of code will be displayed in the output.
- In order for your solution to be accepted, your solution should be located on the last line of the editor and match the expected output data type listed in the question.
25. Microsoft Python Interview Questions
Microsoft is one of the oldest tech companies and recently crossed a market value of $1 trillion. Microsoft operates across multiple business segments: Operating Systems, Productivity Software, Tablet PCs, Cloud Infrastructure among others.
Users Exclusive Per Client
Write a query that returns the number of users who are exclusive to only one client. Output the client_id and number of exclusive users.
Users Exclusive Per Client
Last Updated: March 2021
Considering a dataset that tracks user interactions with different clients, identify which clients have users who are exclusively loyal to them (i.e., they don't interact with any other clients).
For each of these clients, calculate the number of such exclusive users. The output should include the client_id and the corresponding count of exclusive users.
You can solve the problem here: https://platform.stratascratch.com/coding/2025-users-exclusive-per-client
The problem uses the fact_events dataset which has the following fields.
Approach
- Since we need to only find the number of clients used by the a particular user, we remove all duplicate combinations of user_id and client_id
- We then count the number of client_ids used by each user.
- Finally, we subset only those users where the number of clients used is equal to one and output the relevant fields.
Solution
# Import your libraries
import pandas as pd

# Find the number of clients used by a user.
user_df = fact_events.drop_duplicates(subset = ['user_id', 'client_id'])[['user_id', 'client_id']].groupby(by = ['user_id'], as_index = False).count()

# Subset those users who use only one client and output relevant fields
out_df = fact_events[fact_events['user_id'].isin(user_df[user_df['client_id']
== 1]['user_id']
    )][['user_id', 'client_id']].drop_duplicates().groupby(by = ['client_id'],
as_index =False).count()
out_df
- The dataset has already been loaded as a pandas.DataFrame.
- print() functions and the last line of code will be displayed in the output.
- In order for your solution to be accepted, your solution should be located on the last line of the editor and match the expected output data type listed in the question.
26. Netflix Python Interview Question
Netflix is the largest media organization in the world by market capitalization and is widely known for its OTT media platform and original programming. You can solve more Netflix python interview questions on the StrataScratch platform.
Win-to-Nomination Ratio
For each nominee, calculate the win-to-nomination ratio. Report each nominee and their win-to-nomination ratio such that the nominee with the highest ratio is on top while the one with the lowest ratio is bottom.

You can solve the problem here: https://platform.stratascratch.com/coding/9752-win-to-nomination-ratio
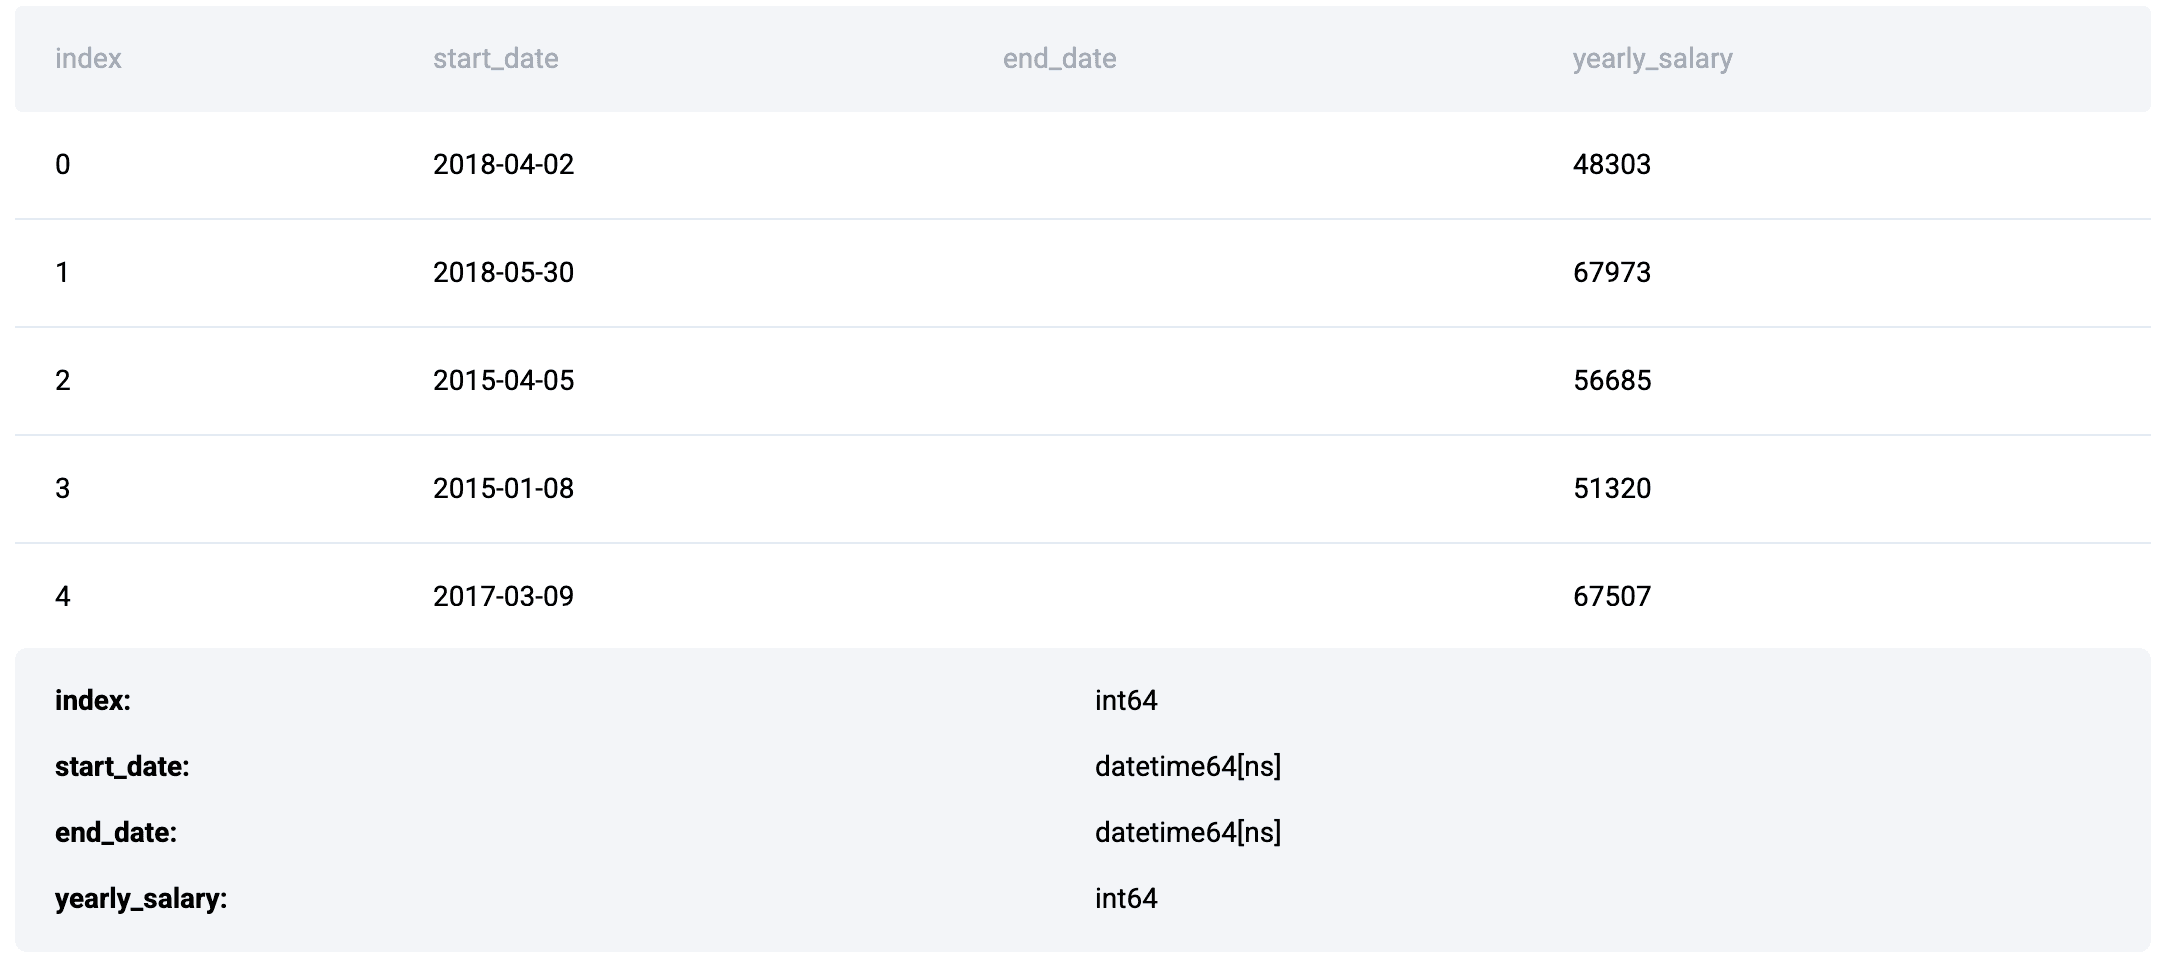
The problem uses the following dataset
Approach
- Given the nature of the dataset, we can easily get the required metrics by using the pivot_table function.
- We aggregate the number of nominations counting the number of wins separately for each nominee
- Now we can calculate the win-to-nomination ratio easily.
- Finally, we sort the summarized dataset in descending order of the ratio and output the relevant fields.
Solution
# Import your libraries
import pandas as pd

# Aggregate the number of nominations for each nominee, reporting wins separately
summ_df = pd.pivot_table(data = oscar_nominees, index = 'nominee', columns =
'winner', values = 'category', aggfunc = 'count').reset_index().fillna(0)

# Calculate the win to nomination ratio
summ_df['ratio'] = summ_df[True] / (summ_df[True] + summ_df[False])

# Sort in descending order of ratio and output relevant fields
summ_df[['nominee', 'ratio']].sort_values(by = ['ratio'], ascending = False)- The dataset has already been loaded as a pandas.DataFrame.
- print() functions and the last line of code will be displayed in the output.
- In order for your solution to be accepted, your solution should be located on the last line of the editor and match the expected output data type listed in the question.
27. Noom Python Interview Question
Noom operates a subscription-based app that tracks a person’s food intake and exercise habits.
Signup By Day
Create a query that returns an array of signup ids by day. Order the output by the number of signups with the day on with the date with the most number of signups appearing first.

You can solve the problem here: https://platform.stratascratch.com/coding/2030-signup-by-day
The problem uses the signups dataset that contains the following fields.
Approach
- We first take the date value from the signup_start_date field.
- Since we need to create a list of signups, we group all signup_ids by date and create a list using the apply method.
- We now get the number of signups for each day by taking the length of the created list.
- Finally, we sort the summarized dataset by the number of signups and output the relevant fields.
Solution
# Import your libraries
import pandas as pd

# Extract date value
signups['date'] = pd.to_datetime(signups['signup_start_date'].dt.date)

# Groupby date and create a list of signup_id
summ_df = signups[['date', 'signup_id']].groupby(by = ['date'])['signup_id'].apply(list).reset_index()

# Calculate the number of signups for each day
summ_df['num_signups'] = summ_df['signup_id'].apply(lambda x : len(x))

# Order by the number of signups and output the relevant fields
summ_df.sort_values(by = ['num_signups', 'date'], ascending =
[False, True]).drop(columns = ['num_signups'])
28. Salesforce Python Interview Question
Salesforce is a cloud-based SaaS company that provides CRM and associated enterprise solutions focused on marketing automation, customer service, application development, et al.
Total Sales In Different Currencies
You are provided the sales amount for a multinational company in different currencies. You are also provided the currency exchange rates against US dollars (USD) on different dates. Report the total sales, per quarter, for the first 2 quarters in 2020, and the sales in USD currency.
Total Sales In Different Currencies
Last Updated: June 2021
You work for a multinational company that wants to calculate total sales across all their countries they do business in. You have 2 tables, one is a record of sales for all countries and currencies the company deals with, and the other holds currency exchange rate information. Calculate the total sales, per quarter, for the first 2 quarters in 2020, and report the sales in USD currency.
You can try the problem here: https://platform.stratascratch.com/coding/2041-total-sales-in-different-currencies
The problem uses two datasets.
The second dataset is called sf_sales_amount containing the following fields.
Approach
- The sales data is present in the sf_sales_amount dataset. However, it is reported in different currencies. To get the USD sales value, we need to get the exchange rate on the date of the transaction.
- We start off by merging the two datasets matching the combination of sales_date and currency from the sf_sales_amount dataset with the combination of date and source_currency fields from the sf_exchange_rate dataset. Keeping all the transactions in the sf_sales_amount dataset.
- We then extract the reporting quarter from the sales_date field. To do this we use the built-in quarter method for datetime objects.
- Finally we calculate the USD amount by multiplying the sales amount with the exchange rate and summarize by quarter.
Solution
# Import your libraries
import pandas as pd

# Merge the two datasets, by currency and date
merged_df = pd.merge(sf_sales_amount, sf_exchange_rate, how = 'left', left_on =
['sales_date', 'currency'], right_on = ['date', 'source_currency'])

# Calculate the USD value of  sales
merged_df['usd_value'] = merged_df['sales_amount'] * merged_df['exchange_rate']

# Create a quarter field from the date
merged_df['quarter'] = merged_df['sales_date'].dt.quarter

# Summarize the usd sales value by quarter
summ_df = merged_df.groupby(by = ['quarter'], as_index = False).sum()

# Keep only the first two quarter data and output relevant fields
summ_df[summ_df['quarter'].isin([1,2])][['quarter', 'usd_value']]- The dataset has already been loaded as a pandas.DataFrame.
- print() functions and the last line of code will be displayed in the output.
- In order for your solution to be accepted, your solution should be located on the last line of the editor and match the expected output data type listed in the question.
29. Twitch Python Interview Question
Twitch is a subsidiary of Amazon and is a live-streaming service focusing primarily on broadcasts of esports competitions and video game live streams.
Viewers Turned Streamers
Find out how many streaming sessions are conducted by users who started out as viewers (users whose first session on the platform was as a viewer). Output the user id and number of sessions. Sort in descending order of the number of streaming sessions conducted. If two users have the same number of sessions, then the order in the ascending order of their user ids.
Streamer Sessions by Initial Viewers
Last Updated: January 2021
Return the number of streamer sessions for each user whose very first session was as a viewer.
Include the user ID and count of streamer sessions for users whose earliest session (by session_start) was a 'viewer' session, regardless of whether they ever had a streamer session later. Sort the results by streamer session count in descending order, then by user ID in ascending order.
You can solve the full problem here: https://platform.stratascratch.com/coding/2012-viewers-turned-streamers
The problem uses the twitch_session dataset that contains the following fields.
Approach
- We start by taking the information about the very first session for a user.
- To find the streaming sessions, we count the number of sessions for each user where the session_type is ‘streamer’
- We merge the two datasets keeping only those users whose first session was as a ‘viewer’.
- Finally, we sort the dataset in descending order of the number of streaming sessions. To break the ties, we sort in the ascending order of the user ids.
Solution
# Import your libraries
import pandas as pd

# Get the very first session details for each user
first_session = twitch_sessions.sort_values(by = ['user_id', 'session_start']).drop_duplicates(subset = ['user_id'])

# Summarize streaming information
streamer_sessions = twitch_sessions[twitch_sessions['session_type'] == 'streamer'].groupby(by = ['user_id']).agg({'session_id' : 'count'})

# merge the two datasets, subset relevant rows and output relevant fields
merged_df = pd.merge(first_session[first_session['session_type'] == 'viewer']
[['user_id']], streamer_sessions, on = 'user_id', how = 'left').sort_values(by = ['session_id', 'user_id'], ascending = [False, True]).fillna(0)
- The dataset has already been loaded as a pandas.DataFrame.
- print() functions and the last line of code will be displayed in the output.
- In order for your solution to be accepted, your solution should be located on the last line of the editor and match the expected output data type listed in the question.
30. Uber Python Interview Question
Uber is the largest ride-sharing company in the US. Besides ride-sharing, Uber also has package delivery, freight transportation, food delivery and courier operations.
Highest Total Miles
Given a table of Uber rides that contains the mileage and the purpose for the business expense, find out the business purposes that generate the most miles driven. Report the top 3 business purpose categories by total mileage.
Highest Total Miles
Last Updated: July 2020
You’re given a table of Uber rides that contains the mileage and the purpose for the business expense. You’re asked to find business purposes that generate the most miles driven for passengers that use Uber for their business transportation. Find the top 3 business purpose categories by total mileage.
You can solve the problem here: https://platform.stratascratch.com/coding/10169-highest-total-miles
The problem uses the following dataset
Approach
- To solve this problem, we aggregate the number of miles by purpose.
- Then we rank the grouped data.
- Finally, we show only data with a ranking less than or equal to 3.
Solution
import pandas as pd

df_grouped = my_uber_drives[my_uber_drives['category']=="Business"].groupby('purpose')['miles'].sum().reset_index()

df_grouped['rank'] = df_grouped['miles'].rank(method='min', ascending=False)
result = df_grouped[df_grouped['rank'] <= 3][['purpose', 'miles']]
- The dataset has already been loaded as a pandas.DataFrame.
- print() functions and the last line of code will be displayed in the output.
- In order for your solution to be accepted, your solution should be located on the last line of the editor and match the expected output data type listed in the question.
Also, check out our posts "Python Coding Questions" and "Advanced Python Questions" where we show how to approach and solve the challenging Python interview questions.
Conclusion
This guide presents a well-rounded set of Python interview questions that frequently appear in data science interviews at leading tech companies like Amazon, Google, and Microsoft. You’ve seen how Python empowers a range of skills from data manipulation and statistical analysis to time-series forecasting, text processing, and domain-specific problem-solving.
The takeaway is clear: mastering Python for data science interviews requires not only understanding syntax and libraries but also applying them to real-world scenarios. The key ingredients to success? Practice, persistence, and patience. Keep challenging yourself with problems that span different topics and difficulty levels.
Share