Advanced Python Interview Questions


In this article, we’ll walk you through one of the advanced Python interview questions focusing on the Python join features.
What is advanced Python?
Python is one of the highly sought-after programming languages in today’s world. While basic know-how of the Python language can get you an entry-level job with a decent salary package, having advanced Python programming knowledge can help you ace the advanced Python interview questions that are thrown your way.
Following along with the StrataScratch advanced Python interview question videos and practicing on the platform gives you insight and the exercise that you require to grasp advanced Python concepts in-depth.
These advanced python interview questions are targeted at mid-level developers that are aiming to understand advanced topics in Python.
What are the advanced topics in Python?
Understanding advanced Python topics requires you to comprehend how the programming language works instead of just the features and their syntax. Some coding questions really push you to hone in on your advanced Python concepts. Certain topics that you could work on to advance your Python programming skills are listed below, some of which we will use in this advanced python interview question later.
- Join List in Python - Join lists using the merge() or join() method
- Datetime Manipulation - date, time, datetime, timedelta, tzinfo, timezone
- Scopes in Python - local, nonlocal/enclosed, global, built-in
- IterTools - obtaining memory efficiency and faster performance
- Python collections modules - OrderedDict, Counter, Deque, NamedTuple
- Classmethod in Python - A method to pass a class in the function as a parameter using the ‘cls’ keyword
- Assert in Python - Debugging statements that help with sanity testing of the code.
- Virtualenvs - lightweight virtual environment creating capability in a standalone directory.
How to become advanced in Python?

Like any programming language, becoming an advanced Python programmer requires practice, practice, and practice! This would be the core exercise that you will need to do to better your Python programming skills. Apart from the obvious, learning advanced concepts in Python, such as object-oriented Python, database programming, GUI, threading, and more, can make you a cut above the rest.
Know that becoming proficient in Python does not simply depend on whether you know every feature of the programming language or the complex concepts. A skilled programmer is a good problem solver. It takes a good deal of analytical thinking to come up with efficient solutions to problems you are faced with.
Work on multiple projects with Python, which can give you a wholesome perspective on various topics and usages. Use frameworks like Django, Flask, or CherryPy to build a website, fetch data from open-source libraries that are available online, and maybe even create games. Taking on various small projects like these will help deepen your grasp of the language and push you to explore advanced concepts.
One of the quickest ways to advance your skillset is to practice problems that are posed in real-world situations and questions that are asked in interviews that target diverse advanced topics in a single question. These types of questions will tease your brain to think and solve problems effectively. Check out this article where you can find Python Interview Questions that are often asked in interviews.
Advanced Python Interview Questions
Let’s take a look at one such advanced programming example from the plethora of Python coding interview questions available to practice and learn from the StrataScratch platform.
Sales Growth per Territory
The following interview question is from Amazon, and it is a ‘hard’ level problem.
Interview Question Date: May 2022
Write a query to return Territory and corresponding Sales Growth. Compare growth between periods Q4-2021 vs Q3-2021. If Territory (say T123) has Sales worth $100 in Q3-2021 and Sales worth $110 in Q4-2021, then the Sales Growth will be 10% [ i.e. = ((110 - 100)/100) * 100 ] Output the ID of the Territory and the Sales Growth. Only output these territories that had any sales in both quarters.
Link to the question: https://platform.stratascratch.com/coding/2111-sales-growth-per-territory
The objective of the question is to determine the sales growth of each territory in Q4 2021. The formula provided in the question for sales growth highlights the sales increase from Q3 to Q4 2021 as a proportion of Q3 sales in percentage terms. The expected output must display only the territories that have had sales in both quarters.
Sales growth is a metric that high-level management is typically interested in as it is one of the indications of the overall health of a business and reveals trends in the industry or location. It is also used to compare businesses of different scales, giving insight into future potential so that decision-makers can allocate resources better, whether this is in the form of finances, manpower, or time.
Solution approach framework to solve this advanced python interview question

Here at StrataScratch, we follow a 3-step framework that helps us solve any coding problem and simplify it into a few steps. This framework can be applied to any coding question.
The 3-step framework consists of -
- Exploring the dataset
- Writing out the approach
- Coding the solution
Let’s begin solving the question using the framework.
1. Exploring the dataset
According to the question, we are required to calculate the sales growth per territory for Q3 and Q4 of 2021. In order to calculate the same, we need two parameters:
- Territories and their Q3 2021 sales total; and
- Territories and their Q4 2021 sales total
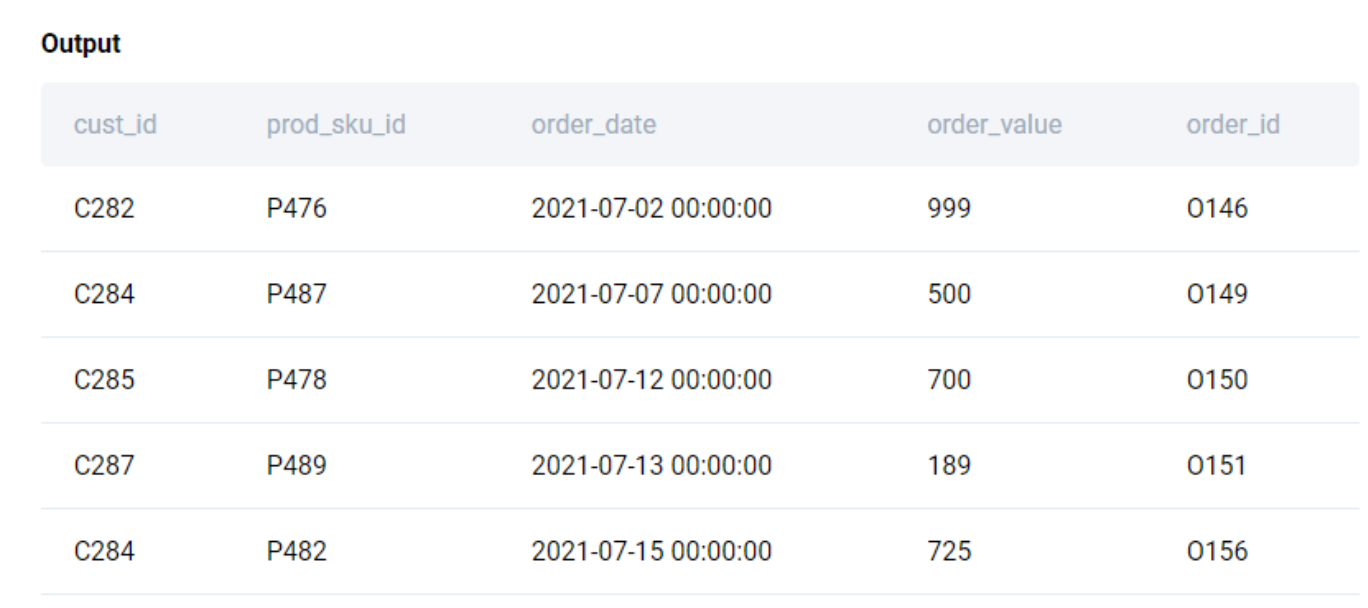
Firstly, locate the information in the tables provided. The first table provided is fct_customer_sales which has the following schema:
| cust_id | prod_sku_id | order_date | order_value | order_id |
|---|---|---|---|---|
| C274 | P474 | 2021-06-28 | 1500 | O110 |
| C285 | P472 | 2021-06-28 | 899 | O118 |
| C282 | P487 | 2021-06-30 | 500 | O125 |
| C282 | P476 | 2021-07-02 | 999 | O146 |
| C284 | P487 | 2021-07-07 | 500 | O149 |
From the preview of the table, we can observe that this is a list of Amazon orders, and the columns we need from this table are the order_value as well as the order_date.
Going back to the parameters we require, the second information we need is the territory of the sale. Let’s take a look at the second table provided, which is the map_customer_territory table. Following are the schema and a preview of the table:
| cust_id | territory_id |
|---|---|
| C273 | T3 |
| C274 | T3 |
| C275 | T1 |
| C276 | T1 |
| C277 | T1 |
If we hadn’t been provided this schema, we would be confused about whether the location of the sale refers to the customer-related location or the seller’s location. With this insight, we can assume that this analysis will reveal which areas have the strongest customer sales and is indicative of successful marketing efforts or strong consumer demand.
An edge case to anticipate in this advanced python interview question is that some locations may not have had a sale at all for either of the quarters (Q3, Q4) of 2021.
There are a couple of reasons for this, new store openings or temporary closures. You could also consider a case where there may be missing locations. Handling such edge cases in the database can be a little tricky. It can either be entered in the database as zero, blank, or no entry for the territory. Given how the fct_customer_sales table is structured, it will most likely be the latter option.
2. Writing out the approach
It’s time to lay out the approach you will be using to solve the problem.
Firstly, when it comes to Python, we always start with importing the necessary libraries. This is crucial because it gives you access to the various packages and functions that are needed to manipulate the data. After we’re done importing the libraries, we can begin preparing our data for analysis.
Secondly, keeping in mind the required information for the solution, we need the territories and their sales value for Q3 and Q4 of 2021. We will achieve this in two steps which can be performed interchangeably.
- Filter for rows showing Q3 and Q4 sales of 2021; and
- Identify the territory of sale by merging the two tables.
Thirdly, we need to analyze the sales quarterly, as opposed to at a transactional level. So, we will aggregate the sales by summing this for each territory-quarter pair, viz., T1-Q3, T1-Q4, T2-Q3, and so on…
The expected table after these steps are performed will contain the territory ID, quarter, and their respective sum of sales.
It is good practice to think ahead about the format that you need your data to be in to make your operations easier. It is best to have the table in the form of Territory ID | Q3 Sales | Q4 Sales. This step is to allow us to quickly calculate the ratio using the Q3 and Q4 sales columns.
Let’s merge Q3 sales with Q4 sales in an inner join, relating them using the territory_id. This step is necessary to transform our data into the structure we mentioned above. An inner join is what we’re going for here as we only want the territories with both Q3 and Q4 sales. This way, we exclude the territories which have a sale only in Q3 or Q4, which includes newly opened stores and stores with temporary closures.
Now, we can calculate the sales growth ratio using the formula provided in the question.
Finally, select only the territory_id and sales_growth columns from the table. So, to summarize, the approach to solving the question can be seen written as:
Step 1: Import libraries
Step 2: Filter for rows showing Q3 and Q4 sales
Step 3: Identify the territory of sales by merging the two tables
Step 4: Output table: Territory ID | Quarter | Sum of sales
Step 5: Territory ID | Q3 Sales | Q4 Sales
Step 6: Merge Q3 sales with Q4 sales in an inner join, relating them by territory_id
Step 7: Calculate the Sales Growth Ratio using the following formula: (Q4 Sales - Q3 Sales) / Q3 Sales * 100
Step 8: Show the territory and the sales growth ratio
3. Coding the solution
Now, let’s begin coding the solution. Let’s follow our written approach.
1). Import pandas and datetime libraries first
import pandas as pd
import datetime as dt
2). Filter for rows showing Q3 and Q4 sales
Prepare the data by selecting only the sales for Q3 and Q4 across all the territories in 2021. For this, we will use the datetime package, which allows us to identify the year and quarter information from the order_date column.
fct_customer_sales_21 = fct_customer_sales[
    (fct_customer_sales.order_date.dt.quarter.isin([3,4])) &
    (fct_customer_sales.order_date.dt.year==2021)

3). Identify the territory of sales by merging the two tables
The table above does not include the territory information that we require, so we will need to merge it with the map_customer_territory table using the common column cust_id.
sales = fct_customer_sales_21.merge(map_customer_territory, on='cust_id', how='inner')


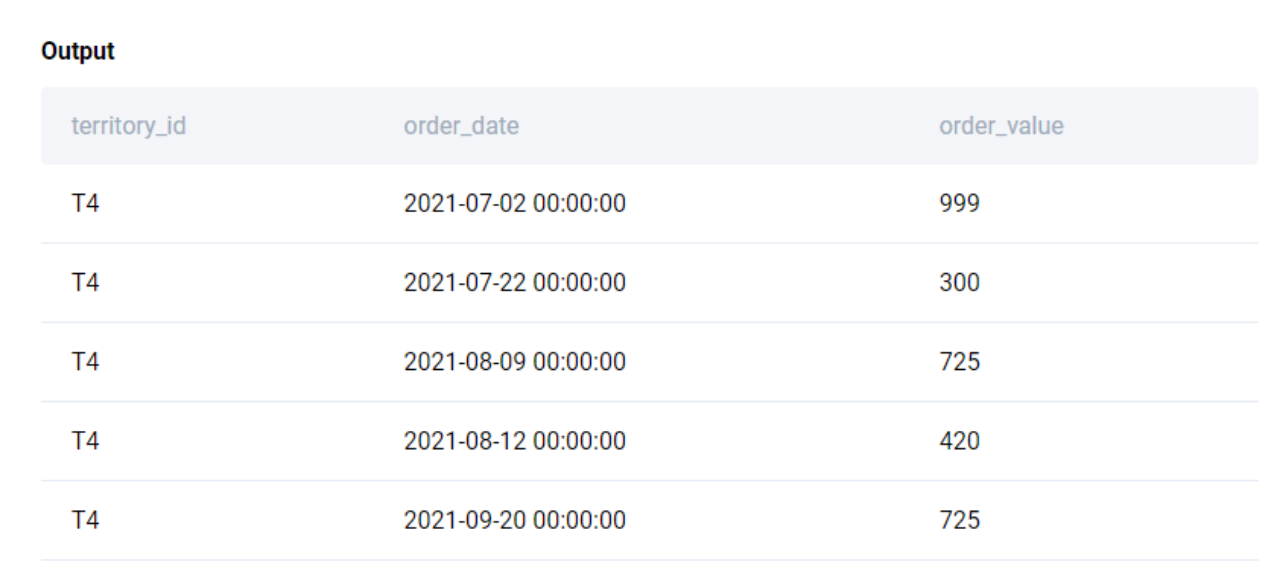
From this table, let us filter only the territories of the customer, order_date, and order_value.
sales = fct_customer_sales_21.merge(map_customer_territory, on='cust_id', how='inner')[['territory_id', 'order_date', 'order_value']]

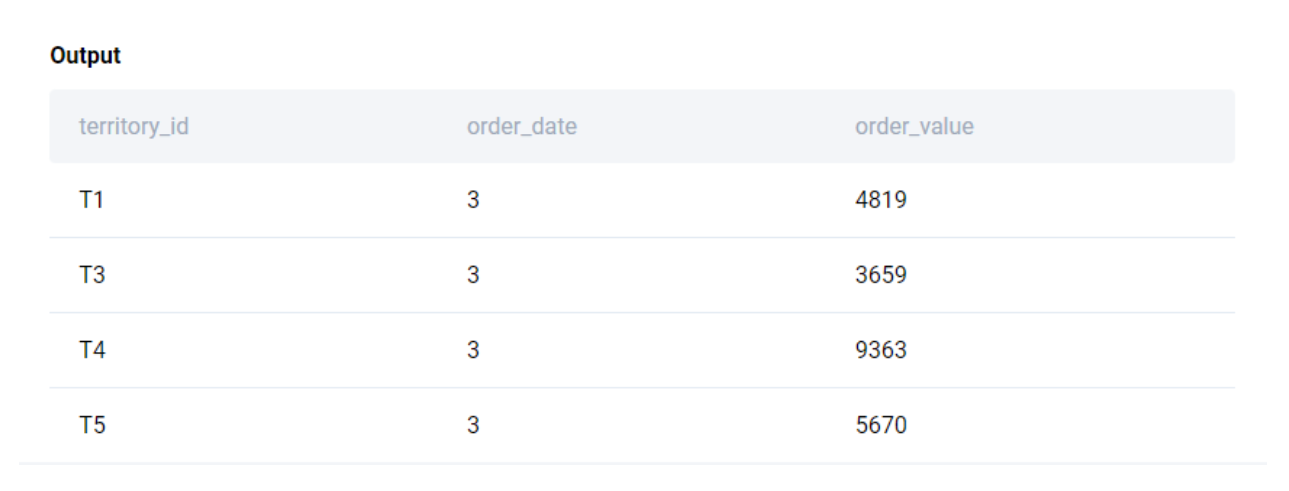
4). Output Table: Territory ID | Q3 Sales | Q4 Sales
Next, let us summarize the sales information by territory and by quarter. The first step to achieve that is to create groups based on unique territory_id and quarter combinations using the groupby() function and then aggregate this by summing up the fields.
sales = sales.groupby([sales.territory_id, sales.order_date.dt.quarter]).sum()
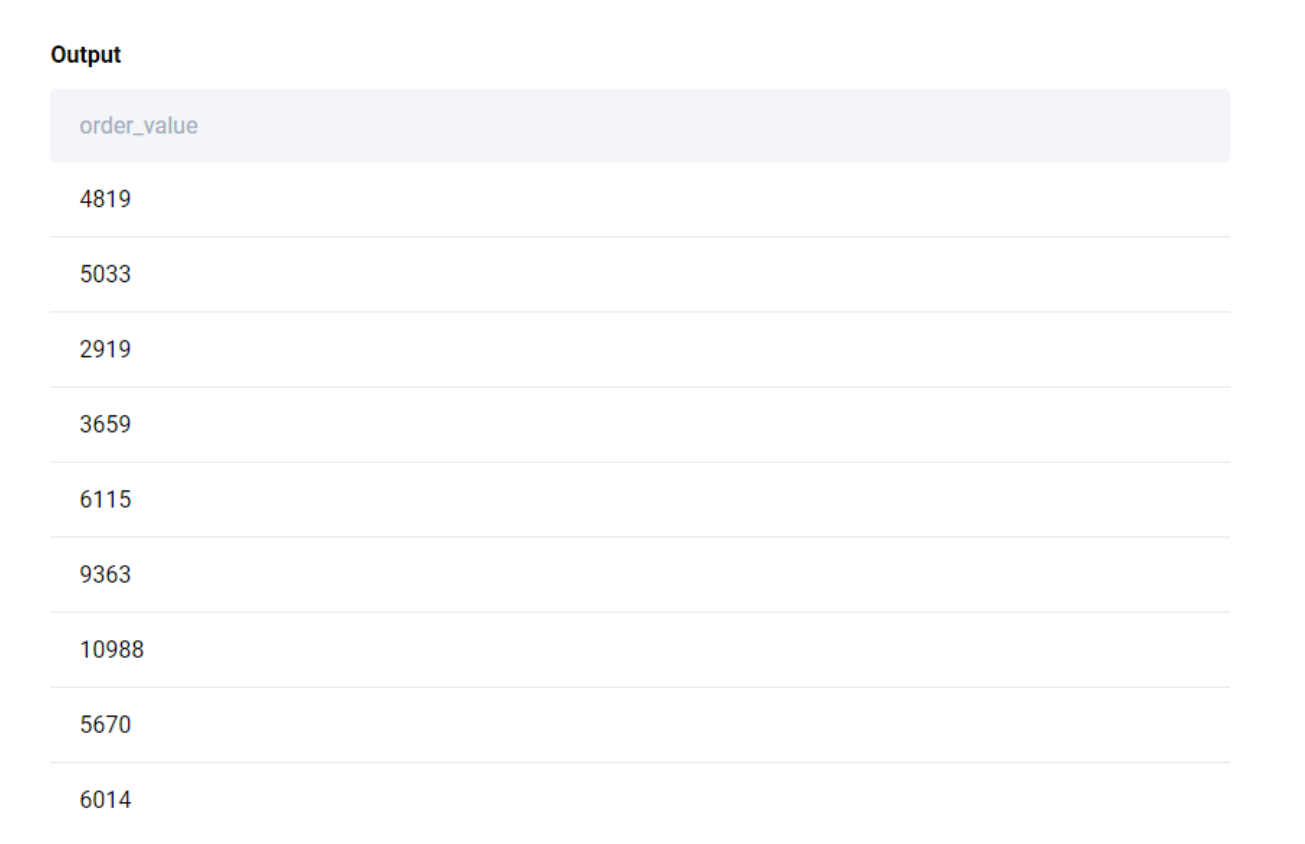
Now, this snippet only returns the field you are aggregating, i.e., order_value as the columns sales.territory_id and sales.order_date.dt.quarter specified in the groupby() function are used as an index.
We want the territory and quarter columns as well, so we will reset the index.
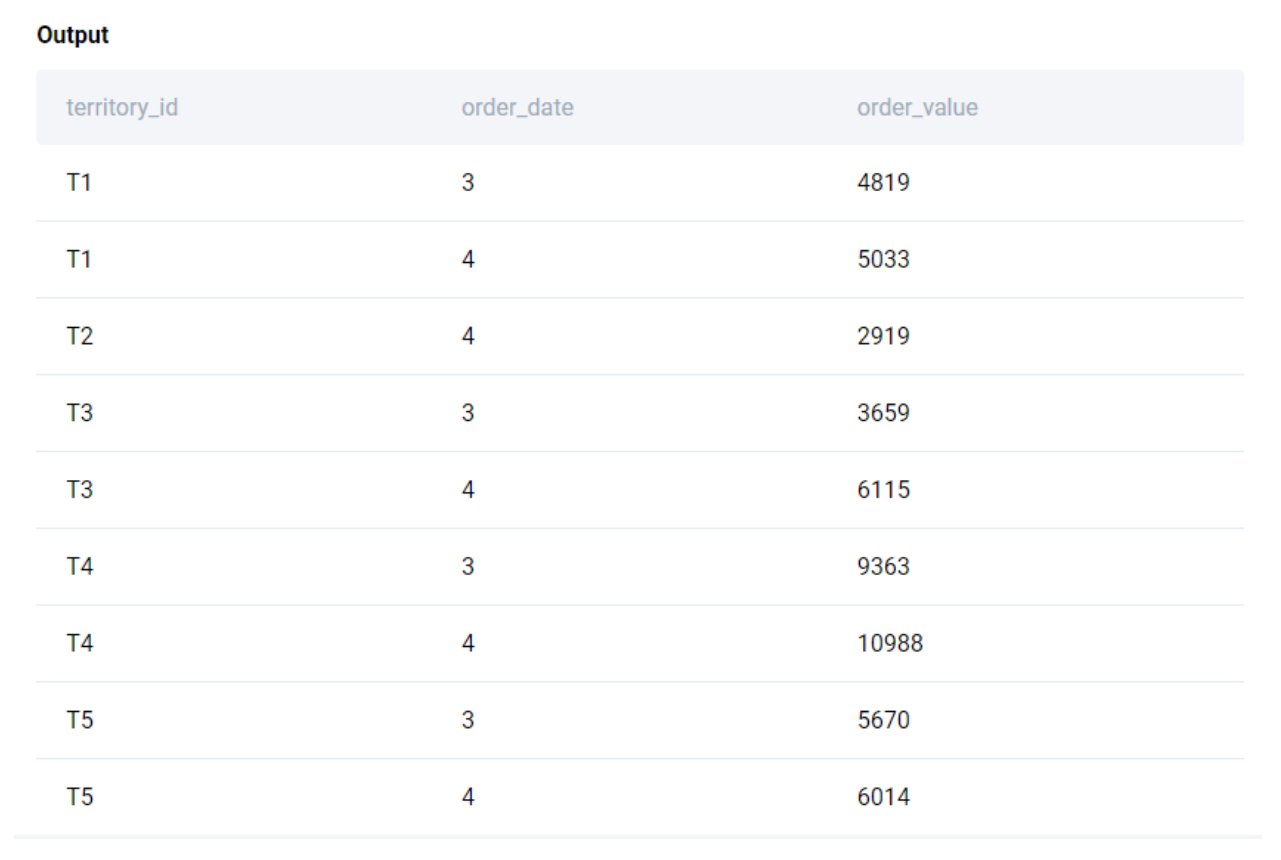
sales = sales.groupby([sales.territory_id, sales.order_date.dt.quarter]).sum().reset_index()
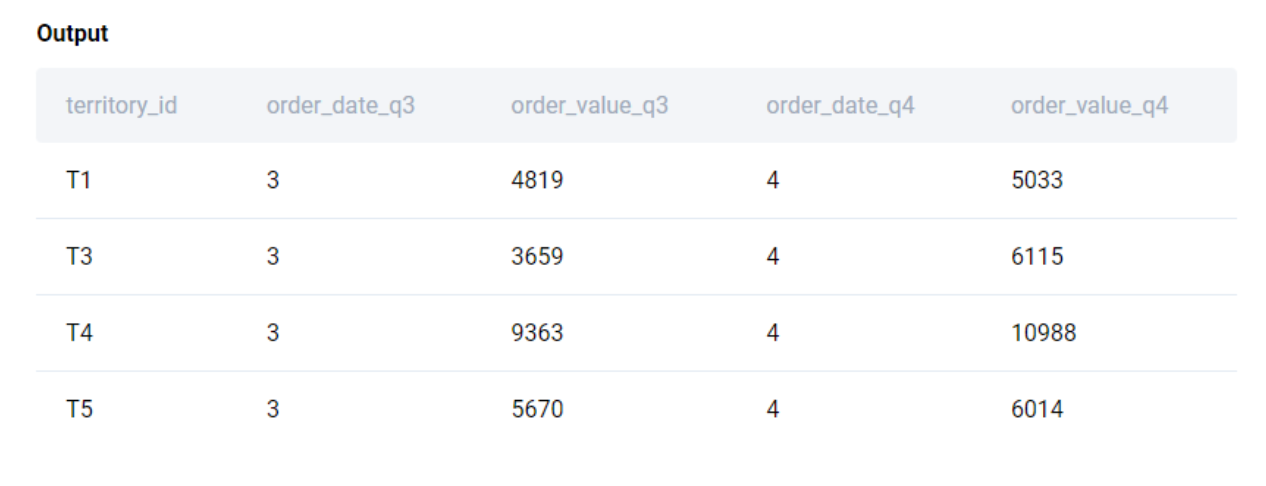
5). Territory ID | Q3 Sales | Q4 Sales
The next step is to transform this table into a table with the columns territory, Q3 sales, and Q4 sales. Let’s take a subset from the sales table, containing the Q3 sales.
sales = sales[sales.order_date==3]
6). Merge Q3 sales with Q4 sales in an inner join, relating them by territory_id
Now, let us merge it with another subset containing the Q4 sales.
sales = sales[sales.order_date==3].merge(sales[sales.order_date==4], how='inner', on='territory_id', suffixes=['_q3', '_q4'])
An important thing to note here is that when merging datasets, using suffixes can be very handy. It helps identify which table the columns are derived from. The default suffixes are ‘_x’ and ‘_y’ but for the sake of transparency, we will customize these to display ‘_q3’ and ‘_q4’.

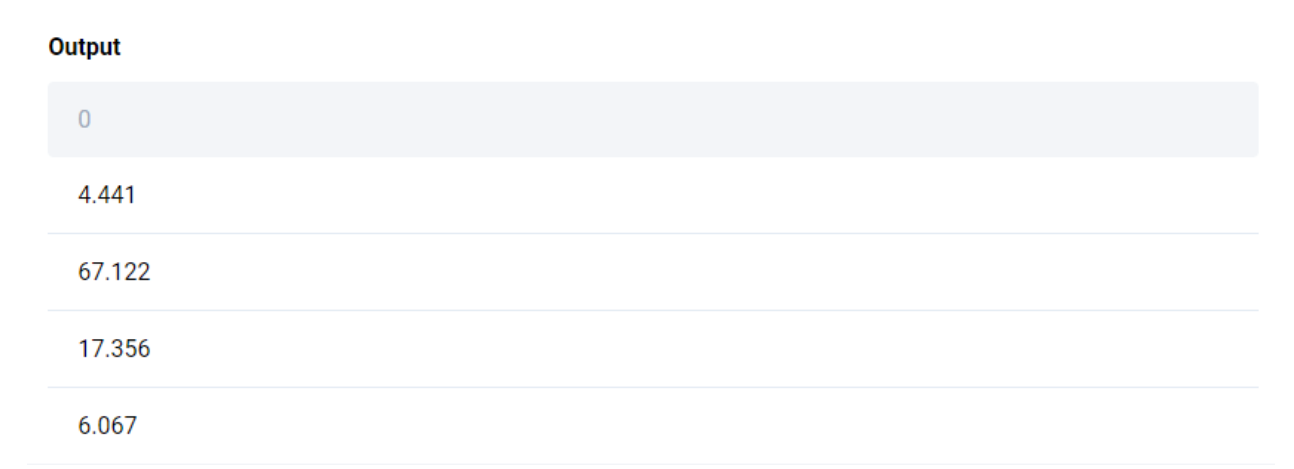
7). Calculate the Sales Growth Ratio using the following formula:
(Q4 Sales - Q3 Sales) / Q3 Sales * 100
We have all the required data to calculate the sales growth ratio. Hence, with the formula provided, let's create a new column names ‘sales_growth’ and calculate it.
sales['sales_growth'] = (sales['order_value_q4'] - sales['order_value_q3'])/sales['order_value_q3']*100

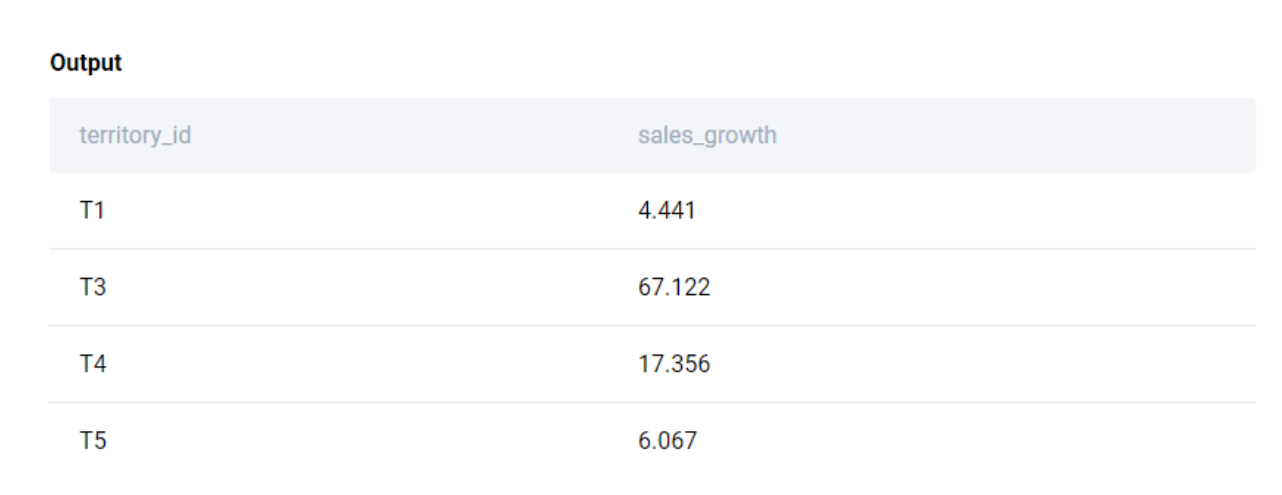
8). Show the territory and the sales growth ratio
Finally, let us select only the columns that we require, viz., territory_id and sales_growth.
sales[['territory_id', 'sales_growth']]
Our final solution looks like this:
import pandas as pd
import datetime as dt
fct_customer_sales_21 = \
    fct_customer_sales[fct_customer_sales.order_date.dt.quarter.isin([3,
                       4]) & (fct_customer_sales.order_date.dt.year
                       == 2021)]
sales = fct_customer_sales_21.merge(map_customer_territory, on='cust_id'
                                    , how='inner')[['territory_id'
                                    , 'order_date', 'order_value']]
sales = sales.groupby([sales.territory_id,
                      sales.order_date.dt.quarter]).sum().reset_index()
sales = sales[sales.order_date == 3].merge(sales[sales.order_date == 4]
                                    , how='inner', on='territory_id'
                                    , suffixes=['_q3', '_q4'])
sales['sales_growth'] = (sales['order_value_q4']
                         - sales['order_value_q3']) \
                         / sales['order_value_q3'] * 100
sales[['territory_id', 'sales_growth']]
Our desired table looks like this:

Considering Edge Cases
Always go beyond solving the problems in your interviews and discuss edge cases that could impact the scenario. There are certain benefits to discussing edge cases in interviews.
- Ensures the robustness of your solution
- Demonstrates strong attention to detail
- Establishes your understanding of the business and the data capture process
For example, in this advanced python interview question, you can talk about missing values that could potentially occur due to new store openings and closures that we have identified already. Another scenario to discuss, especially in the case of eCommerce businesses like Amazon, is ‘refunds’.
To account for the scenario of refunds, it is important to recognize that refunds may take place anywhere between a few weeks to months after the sale. In such an edge case, it is acceptable to make reasonable assumptions.
For instance, are refunds logged separately as a different dataset or the in the same table as sales but recognized as a negative number? After considering this scenario, use the 3-step framework we laid out in the article to solve the problem.
You could analyze the net sales instead of gross sales. Here, net sales will be the sales amount after the refunds. For that as well, you will have to consider how the data is being logged.
Let us assume that the refunds are logged in another table along with the corresponding order_id. With this information, you can merge the refunds dataset with that of sales through the common order_id column. You can use a left join from the sales table for refunds, as not all sales will have a refund processed for it. Also, in order to avoid errors while subtracting refunds from sales, it is best to impute the missing refund values with a zero. This difference will result in ‘net sales’ and, thereafter, can be proceeded with the other steps as discussed in the solution.
Conclusion
We have touched upon joins, filters, aggregation, and datetime manipulation in the course of solving this hard-level Python interview question from Amazon. Be sure to practice this question and more advanced Python interview questions that cover topics like virtualenvs, lists, iterTools, etc., on the Strata Scratch platform.
Remember that practice is the only way to improve your Python programming skills, so use our platform to your advantage with our advanced programming examples.
You can also watch out tutorial videos on our YouTube channel that take you through the 3-step framework we use to solve any coding interview question. Hope you learned something from this article. Follow us and subscribe to our YouTube channel for more Data Science interview questions.
Latest Posts:


Share