Questions To Help You Practice For Your Data Science Interview

Categories:
 Written by:
Nathan Rosidi
An overview of the types of questions in a Data Science interview along with the hands on practice using our platform.
In 2012, Harvard Business Review called Data Scientist the sexiest job of the 21st century and the growing trend in the number of job openings for Data Scientist seems to be confirming that statement. With the increase in data, most of the companies today are leveraging Data Science heavily to make informed business decisions and to find out areas of growth for their business. Data Scientists play a key role in this. As a Data Scientist, you need to have a lot of skills; Coding Skills, Statistical Analysis, Probability, Problem Solving, Technical Knowledge, Business Acumen, etc. For the interview there are many areas the candidate can be judged on.
Due to the broad nature of a Data Scientist role, it becomes quite overwhelming for the candidates. Most of the candidates find it very difficult to get through the recruitment process. In this article, we will see the types of questions that can be asked in the Data Science interview. The Data Science interview questions can be either divided into two major categories or can be divided into 8 smaller categories.
Two main categories:
- Coding Questions
- Non-Coding Questions
The non-coding questions can be divided further into different categories:
- System Design
- Probability
- Statistics
- Modeling
- Technical
- Product
Before moving on with the questions, let’s see what is the role of a Data Scientist in the company:
What Does a Data Scientist do?
Data Scientists are analytics experts in the organization that helps the business to make informed decisions and enable innovation in the company. Data Scientists are the go-to people in the company who organize and analyze large sets of structured and unstructured data and derive insights from them. These folks are the experts in analytics, machine learning, problem solvings skills and interpreting the insights to convert them into actionable business decisions. They design data modeling processes, create advanced ML algorithms and predictive models for extracting the desired data for Business needs.
For gathering and analyzing the data, Data Science professionals has the below responsibilities:
- Acquire the Data from various sources
- Data Cleaning and Processing
- Combining the relevant data sources based on the business needs
- Storing the Data
- Exploratory Data Analysis
- Defining the Problem at hand and planning
- Choosing Predictive Models and Algorithms
- Measuring and Improving Results
- Communicating results to the stakeholders for taking actions
- Repeat the process to solve another problem
Here’s the ultimate guide “What Does a Data Scientist Do?” that will lead you through the various aspects of working in data science.
Coding
After analyzing the Data Science interview questions from across 80 different companies, coding questions seem to be the most dominant one. These are the types of questions in which the interviewer will test the programming acumen of the candidate. The language can be anything; SQL, Python, R or any other programming language required for that specific job. Coding is one of the most important skills for the Data Scientist.
FAANG companies focus a lot on coding questions. Out of all the Data Science questions from Glassdoor, Indeed, etc., close to 50% of the questions were coding related. Coding questions can be defined as questions that either need a programming language or a pseudocode to solve a specific problem. Coding questions are designed to understand the candidate’s ability to solve the problem, to understand their thought process and their comfort level with the programming language, check their creativity, etc. The importance of coding questions in data science interviews cannot be overstated as the vast majority of data science roles involve coding on a regular basis.
Typically most of these data science companies test you on two major languages; Python and SQL. Today, we will be looking at some of the coding questions that have been asked in the interviews and do hands-on practice using the StrataScratch platform.
SQL

Data Science Interview Questions #1: Monthly Percentage Difference
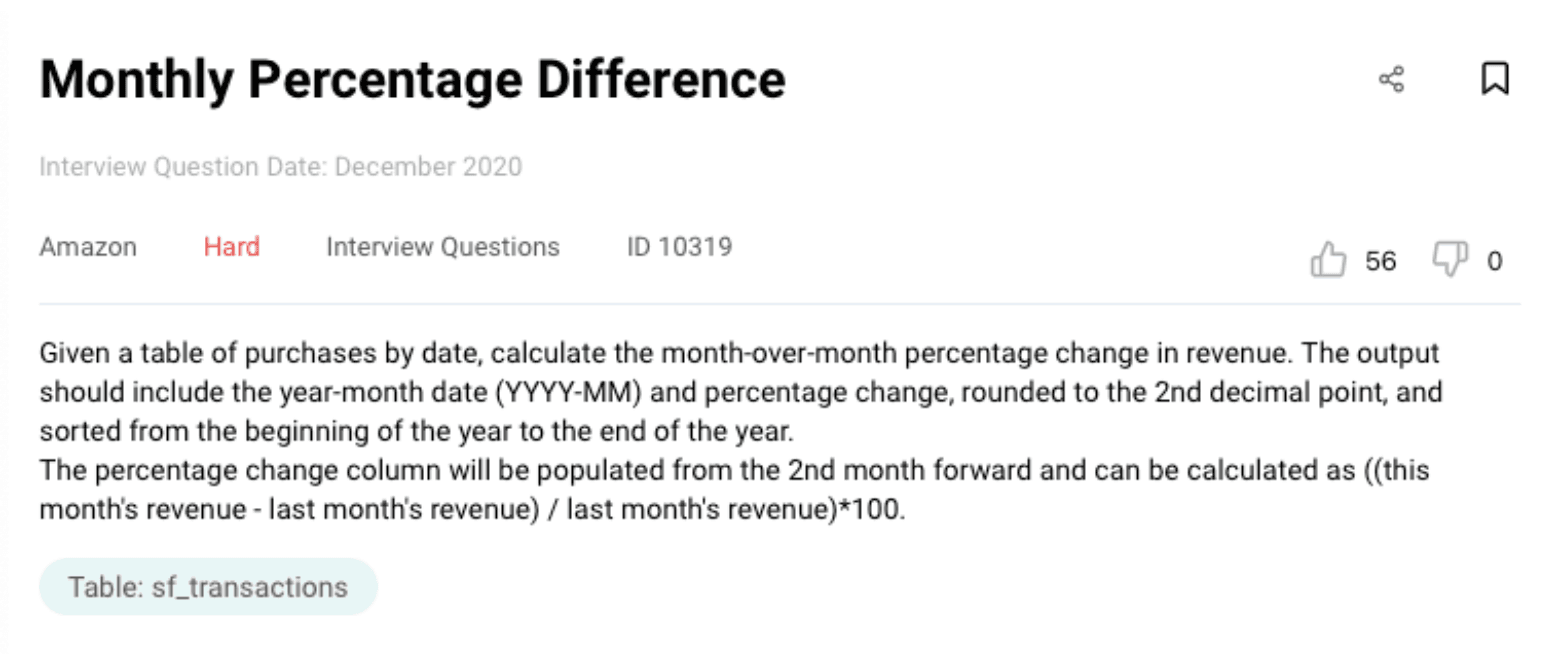
Link to the question: https://platform.stratascratch.com/coding/10319-monthly-percentage-difference
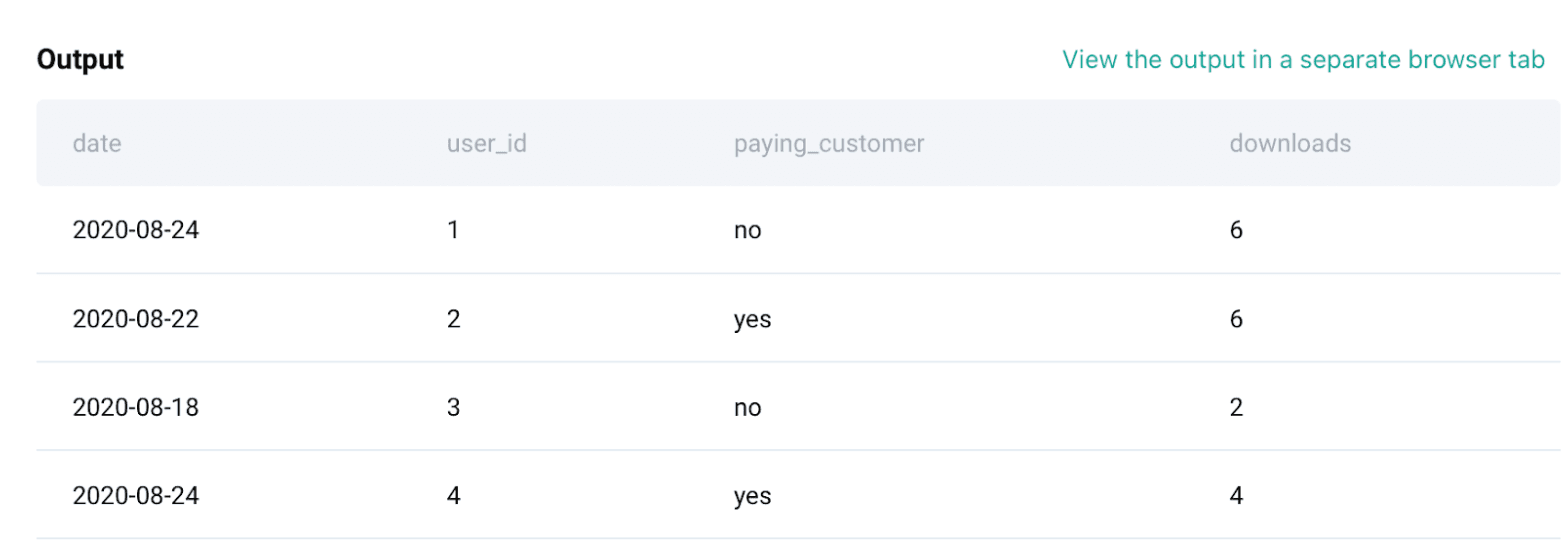
In this question from Amazon, we need to calculate the month-over-month percentage change in revenue. The output should have data in YYYY-MM format and percentage change should be rounded to the 2nd decimal point and sorted from beginning to end of the year.
There is one table provided: sf_transactions
There are four fields in the table; ID, created_at, value and purchase ID.
Solution Approach
As per the question, the first step is to calculate the revenue at the monthly level and change the data format to YYYY-MM. Thus, we will be using the DATE_FORMAT function to change the format of created_at field and then use SUM() to calculate the total revenue.
SELECT DATE_FORMAT(created_at,'%Y-%m') AS ym,
        SUM(value) AS revenue
FROM sf_transactions
GROUP BY 1
ORDER BY 1
In the above part of the code, we are summing up the ‘value’ for each month to calculate the total revenue for that month and change the data format as mentioned in the question. Since we need the dates in ascending order, we are using ORDER BY at the end.
Now that we have revenue for each month in ascending order, let's use the LAG() function to get the revenue for the previous month in order to do month over month calculations.
   SELECT DATE_FORMAT(created_at,'%Y-%m') AS ym,
            SUM(value) AS revenue,
            LAG(SUM(value)) OVER() AS prev_revenue
    FROM sf_transactions
    GROUP BY 1
    ORDER BY 1
With the lag function, you get the revenue for the previous month. Now to calculate the percentage change month-over-month, we can use the formula as:( (Current Month Revenue - Last Month Revenue) / (Last Month Revenue)) * 100 and then use the ROUND() function on the result to get a percentage difference up to 2 decimal points.
Final Query
SELECT DATE_FORMAT(created_at,'%Y-%m') AS ym,
       ROUND((SUM(value) - LAG(SUM(value)) OVER ())
             / LAG(SUM(value)) OVER ()
             * 100, 2) AS revenue_diff_pct
  FROM sf_transactions
 GROUP BY ym
ORDER BY ymOutput
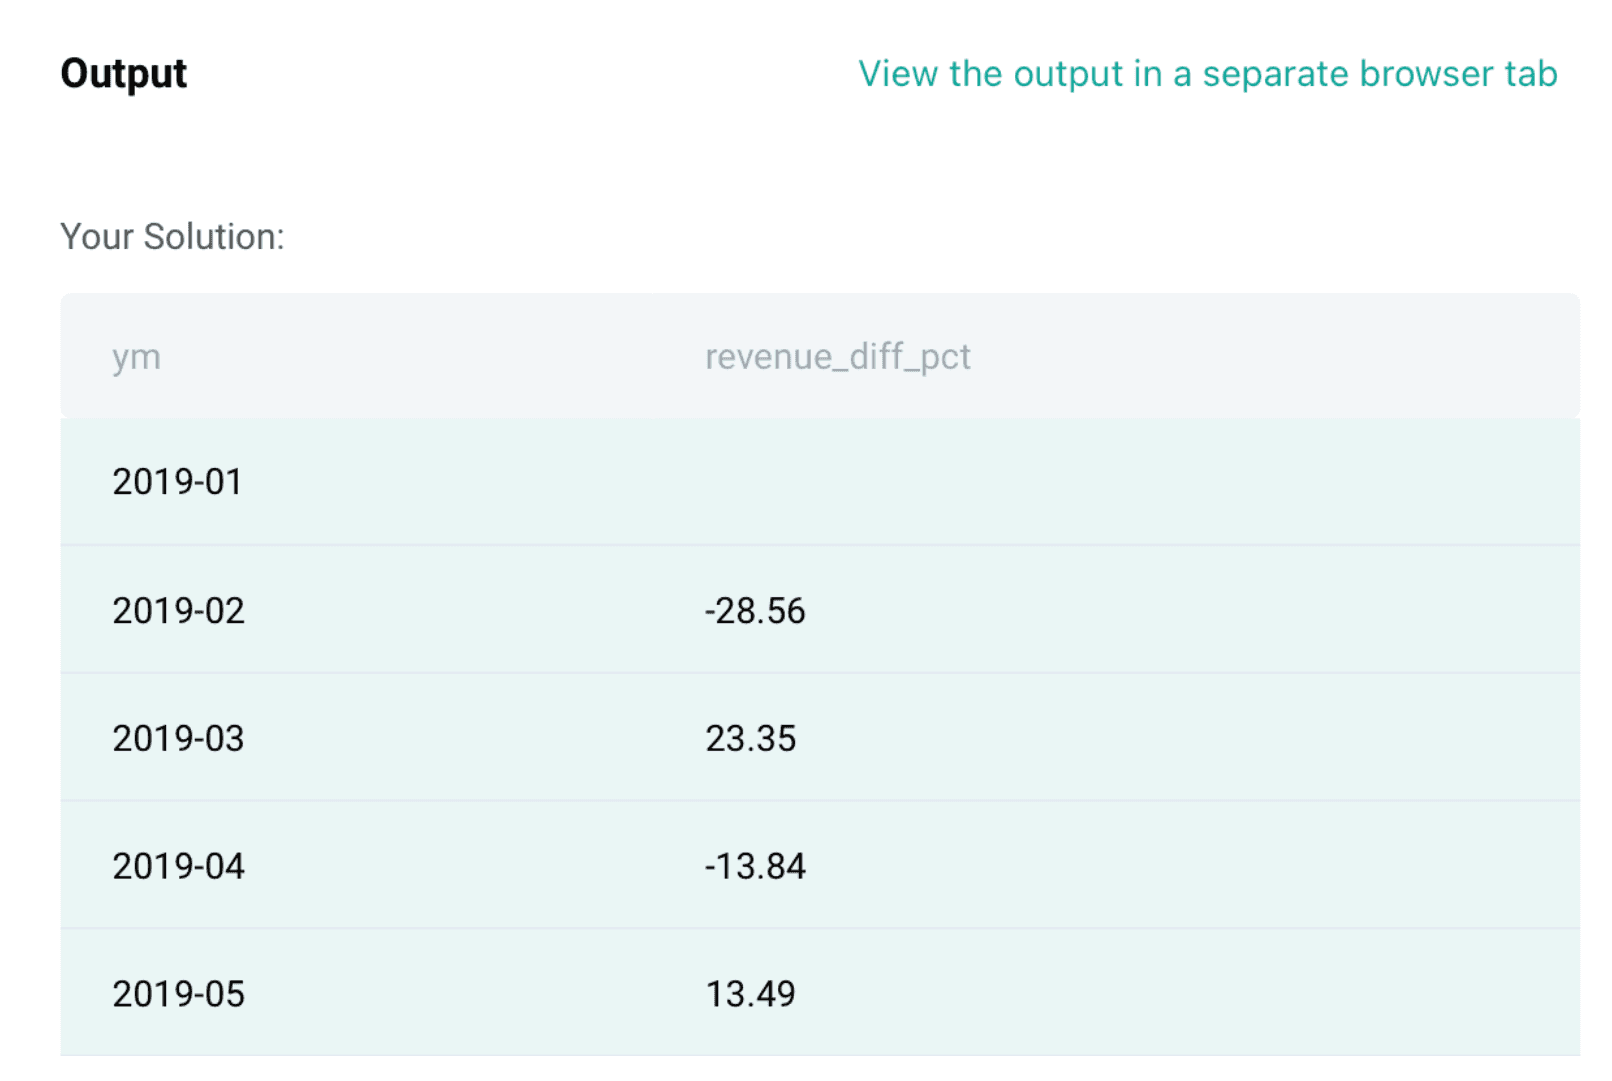
Data Science Interview Questions #2: Premium vs Freemium
Link to the question: https://platform.stratascratch.com/coding/10300-premium-vs-freemium
In this question, there are three tables, ms_user_dimension, ms_acc_dimension, ms_download_facts.
Solution Approach
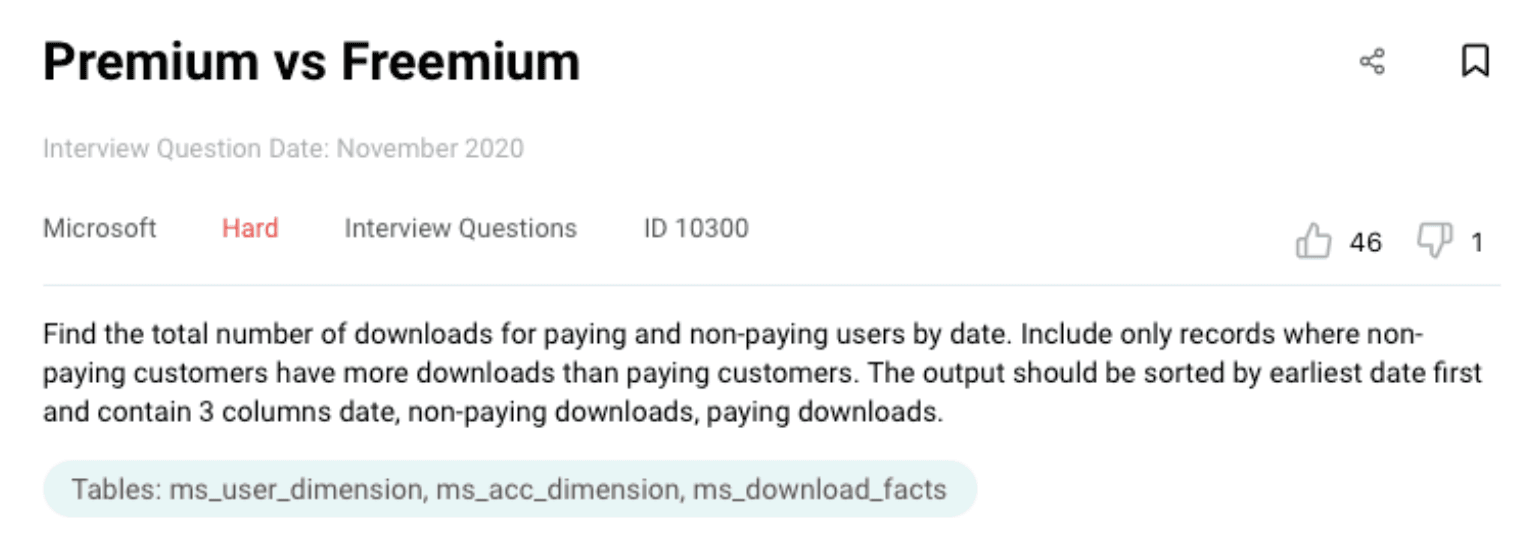
We have three tables. First step is to join the user dimension table with the account table to identify which users are paying customers and which users are non-paying customers. Let’s use CTEs to solve this problem.
WITH user_account_mapping as (

SELECT u.user_id,
       u.acc_id,
       a.paying_customer
FROM ms_user_dimension u
JOIN ms_acc_dimension a
ON u.acc_id = a.acc_id

)
From the above step, we are selecting user ID and account ID from user dimension, joining this table with the account dimension on account ID, and extracting the paying customer column from the account dimension. The output of this table will give user user IDs mapped to account IDs with a flag of paying/non-paying as shown below:
Now, the next step is to join this table with the download facts table to get the number of downloads for each user. Let’s look at that code below.
final_table as
(
SELECT d.date,
       d.user_id,
       ua.paying_customer,
       SUM(d.downloads) AS downloads
FROM ms_download_facts d
JOIN user_account_mapping ua
ON d.user_id = ua.user_id
GROUP BY 1,2,3
)
Now, the output of the above table will give us the number of downloads by each paying and non-paying customer for all the dates as shown below. We have named the above query as final_table and let’s use this to calculate the remaining part.
From the expected output, we need a number of non-paying downloads and paying downloads as separate columns. Thus, we will use CASE WHEN inside SUM() to do that. Below is the code for it.
SELECT date,
SUM(CASE WHEN paying_customer = 'no' THEN downloads END) non_paying,
sum(CASE WHEN paying_customer = 'yes' THEN downloads END) paying
FROM final_table
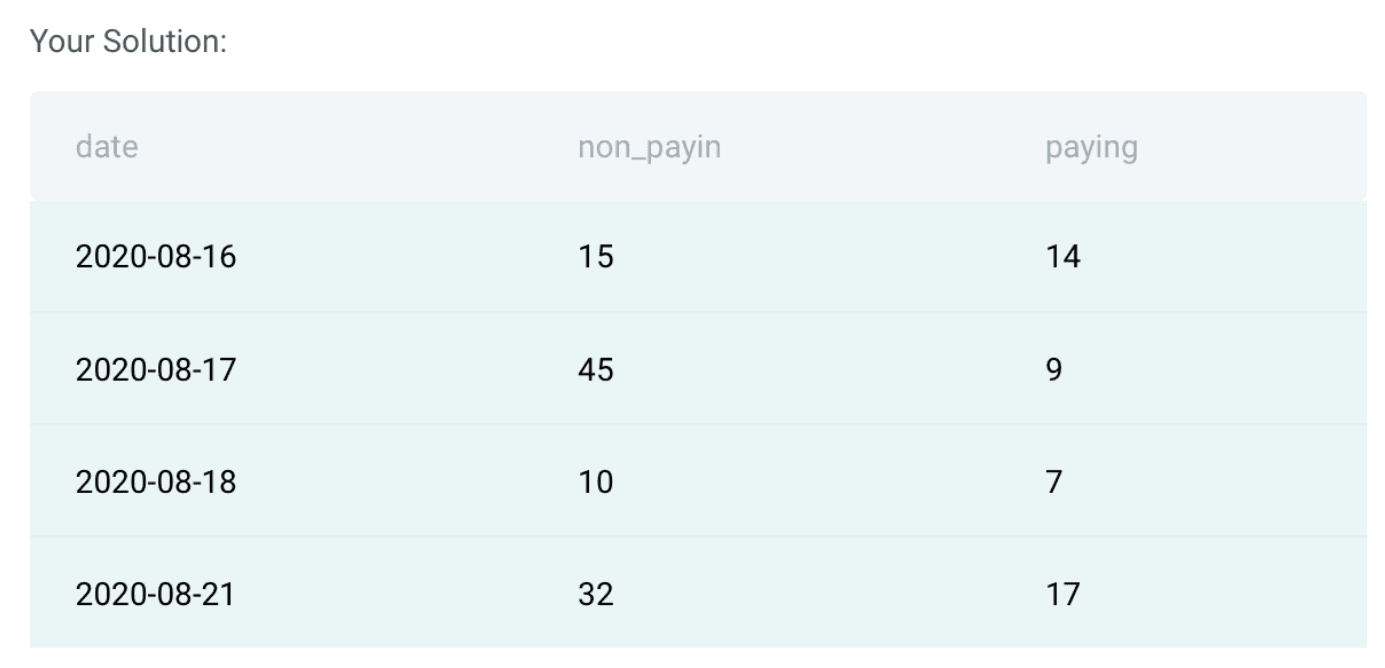
GROUP BY 1Now, the above query will give us the Date, downloads by non-paying customers and downloads by paying customers. For the expected output, we need to sort the data by date and display only those rows where non paying downloads are greater than paying downloads. Below is the code for it using WHERE condition to filter the data.
SELECT *
FROM (
SELECT  date,
        SUM(CASE WHEN paying_customer = 'no' THEN downloads END) non_paying,
        SUM(CASE WHEN paying_customer = 'yes' THEN downloads END) paying
FROM final_table
GROUP BY 1
)b
WHERE non_paying > paying
ORDER BY date
Final Query:
WITH user_account_mapping as (

SELECT u.user_id,
       u.acc_id,
       a.paying_customer
FROM ms_user_dimension u
JOIN ms_acc_dimension a
ON u.acc_id = a.acc_id

),

final_table AS

(
SELECT d.date,
       d.user_id,
       ua.paying_customer,
       SUM(d.downloads) AS downloads
FROM ms_download_facts d
JOIN user_account_mapping ua
ON d.user_id = ua.user_id
GROUP BY 1,2,3
)

SELECT *
FROM (
SELECT  date,
        SUM(CASE WHEN paying_customer = 'no' THEN downloads END) non_paying,
        SUM(CASE WHEN paying_customer = 'yes' THEN downloads END) paying
FROM final_table
GROUP BY 1
)b
WHERE non_paying > paying
ORDER BY dateOutput
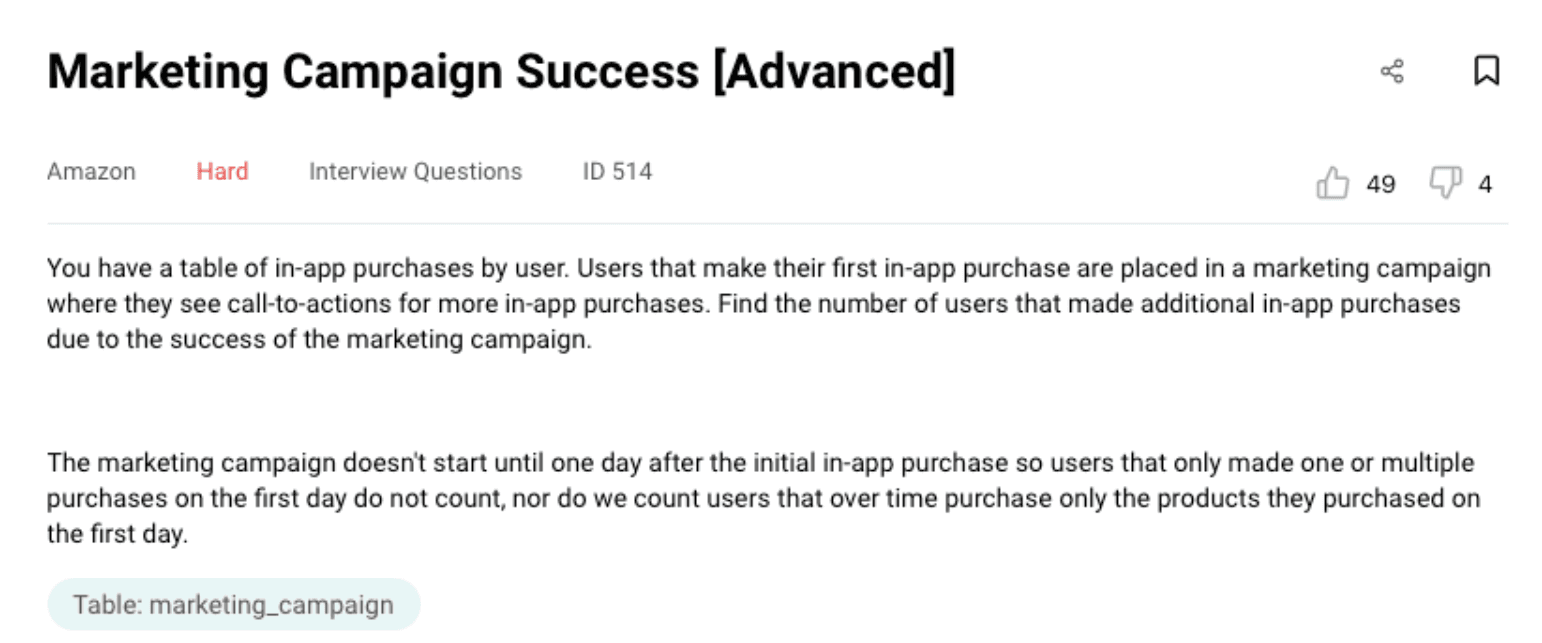
Data Science Interview Questions #3: Marketing Campaign Success
Link to the question: https://platform.stratascratch.com/coding/514-marketing-campaign-success-advanced
In this question, there is one table provided. This table is around marketing campaigns. Some background, the users that make their first purchase are placed in this table where they see calls to actions for more purchases. We need to find the number of users that made additional purchases due to the success of the marketing campaign.
Solution Approach
The first step is to find out the first order date for each user for any item in the dataset. To do this, we will be using MIN() function along with the PARTITION BY() clause. Find the first part of the code below:
    SELECT
        user_id,
        -- Date when user first orders any item
        MIN(created_at) OVER(PARTITION BY user_id ) AS m1
 FROM marketing_campaign
We also need to find the first order date for each product by each user. To calculate that, we will use similar code as above but using the product ID field in the partition clause along with the user ID. This will provide us the first order date for each product by each user.
SELECT
user_id,
-- Date when user first orders any item
MIN(created_at) OVER(PARTITION BY user_id ) AS m1,
-- Date when each item was first ordered by user
MIN(created_at) OVER(PARTITION BY user_id,product_id ) AS m2
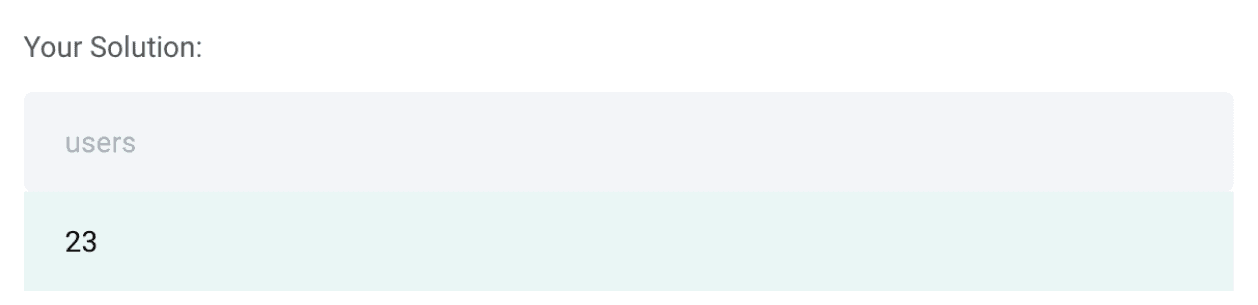
FROM marketing_campaignNow the last part of the question, we need to find the number of users that made additional purchases due to the success of the campaign which means that we need to count the number of distinct user IDs where the first order date for each user is less than the first order date for the additional products i.e. m1 < m2.
Final Query
SELECT
    COUNT(DISTINCT user_id) AS users
FROM (
    SELECT
        user_id,
        -- Date when user first orders any item
        MIN(created_at) OVER(PARTITION BY user_id ) AS m1,
        -- Date when each item was first ordered by user
        MIN(created_at) OVER(PARTITION BY user_id,product_id ) AS m2
    FROM marketing_campaign
    )c

WHERE m1< m2Output
Data Science Interview Questions #4: Total Wine Revenue
Link to the question: https://platform.stratascratch.com/coding/10030-total-wine-revenue
In the question, we have one table; winemag_p1. Find the sample output of this table below:
We need to find the total revenue made by each winery and variety that has at least 90 points.
Solution Approach
So for this question, the first step is to calculate the total revenue for each winery and variety. For this, we will do SUM(price) to calculate the total revenue and then group by winery and variety. Below is the code for it.
SELECT winery,
       variety,
       SUM(price) AS revenue
FROM winemag_p1
GROUP BY 1
This calculates the total revenue for all the wineries irrespective of the total points it has. The question also asks us to calculate the revenue only when the points are greater than 90. Thus, to incorporate this part, we will be using the HAVING() clause at the end of the above query to solve this question.
Final Query:
SELECT winery,
       Variety,
       SUM(price)
FROM winemag_p1
GROUP BY 1,2
HAVING SUM(points<90) = 0Output
Data Science Interview Questions #5: Class Performance
Link to the question: https://platform.stratascratch.com/coding/10310-class-performance
In this question, we need to find the range (difference between max and min scores) in all the three assignments among different students. To solve this question, we have one table: box_scores.
Solution Approach
First step is to calculate the total scores in all the three assignments for each student. Let’s use CTE for this question and store the result of this in t1.
with t1 as (
SELECT DISTINCT student,
       assignment1 + assignment2 + assignment3 AS total_score
FROM box_scores
)
The output of the above query is shown below which will have distinct students along with the total scores in all the three assignments. Now we need to find the difference between the maximum score and the minimum score.
Final Query
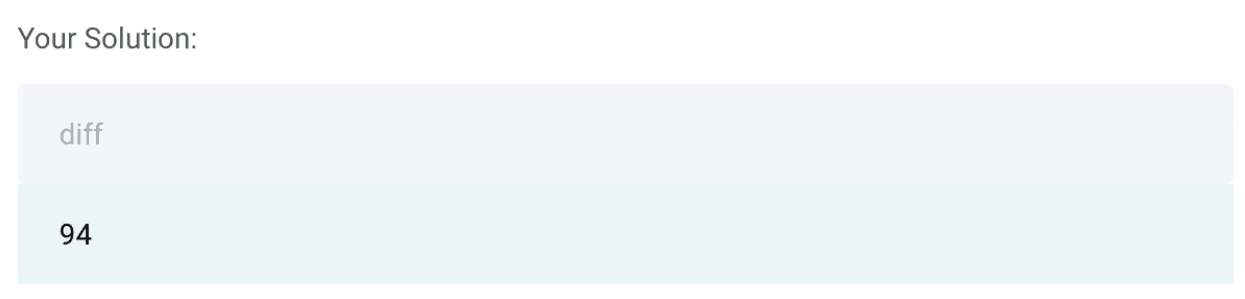
WITH t1 as (
SELECT DISTINCT student,
       assignment1 + assignment2 + assignment3 AS total_score
FROM box_scores
)
SELECT MAX(total_score) - MIN(total_score) AS diff
FROM t1Output
Python

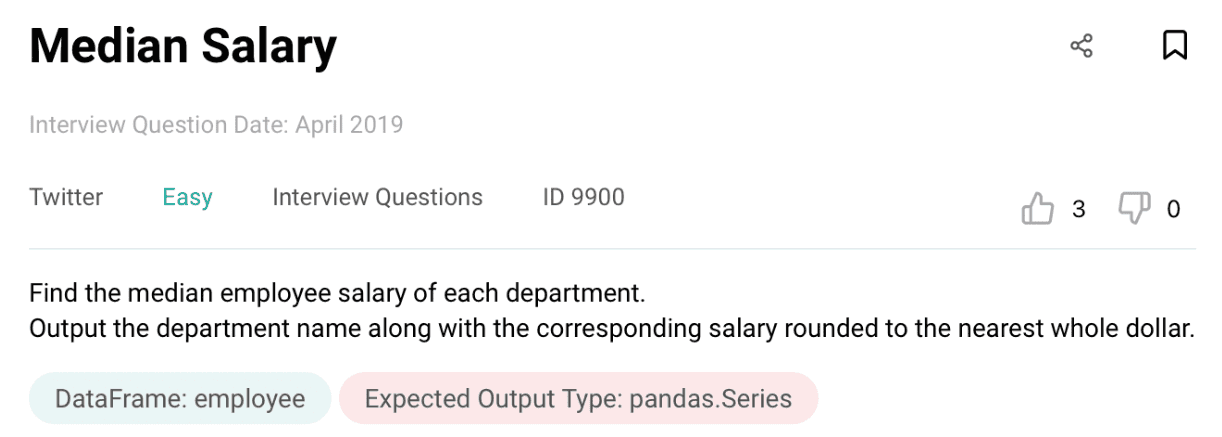
Data Science Interview Questions #6: Median Salary
Link to the question: https://platform.stratascratch.com/coding/9900-median-salary
Solution Approach
In this question, we need to find the median salary for each department. We are provided with one table as below:
This table has a lot of columns which are not required. Thus, we first reduce this data frame into only two columns that are needed to solve this question; Department and Salary.
# Import your libraries
import pandas as pd

# Start writing code
employee = employee[['department','salary']]
The resulting Dataframe will only have two columns; Department and Salary. Now we can group by Department and compute the median salary using the functions groupby() and median() together as below:
Final Query:
# Import your libraries
import pandas as pd

# Start writing code
employee = employee[['department','salary']]
result = employee.groupby(['department'])['salary'].median().reset_index()
result- The dataset has already been loaded as a pandas.DataFrame.
- print() functions and the last line of code will be displayed in the output.
- In order for your solution to be accepted, your solution should be located on the last line of the editor and match the expected output data type listed in the question.
Output
Data Science Interview Questions #7: Average Salaries
Link to the question: https://platform.stratascratch.com/coding/9917-average-salaries
Solution Approach:
There is one table provided to solve this question as below:
In this question, we need to calculate the average salary for each department. So this can be done by using a groupby() function along with the average function in python. So the first step is to calculate the average in a separate column as below:
# Import your libraries
import pandas as pd
# Start writing code
employee['avg_salary'] = employee.groupby(['department'])['salary'].transform('mean')
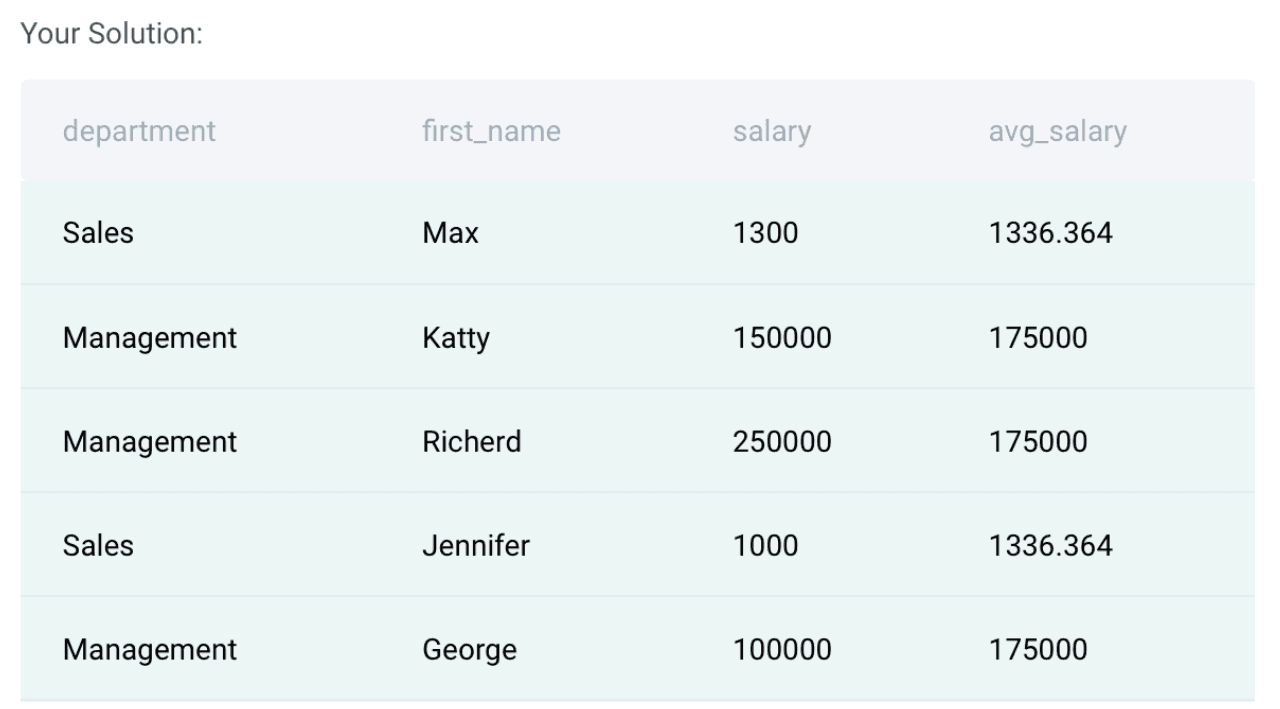
employee.head()Once we have calculated the average, we can now select the columns; Department, First Name, Salary and Average Salary as mentioned in the question. The final Query is below:
Final Query:
# Import your libraries
import pandas as pd

# Start writing code
employee['avg_salary'] = employee.groupby(['department'])['salary'].transform('mean')

result = employee[['department','first_name','salary','avg_salary']]- The dataset has already been loaded as a pandas.DataFrame.
- print() functions and the last line of code will be displayed in the output.
- In order for your solution to be accepted, your solution should be located on the last line of the editor and match the expected output data type listed in the question.
Output
Data Science Interview Questions #8: Employee with Bonuses
Link to the question: https://platform.stratascratch.com/coding/9903-employees-with-bonuses
Solution Approach
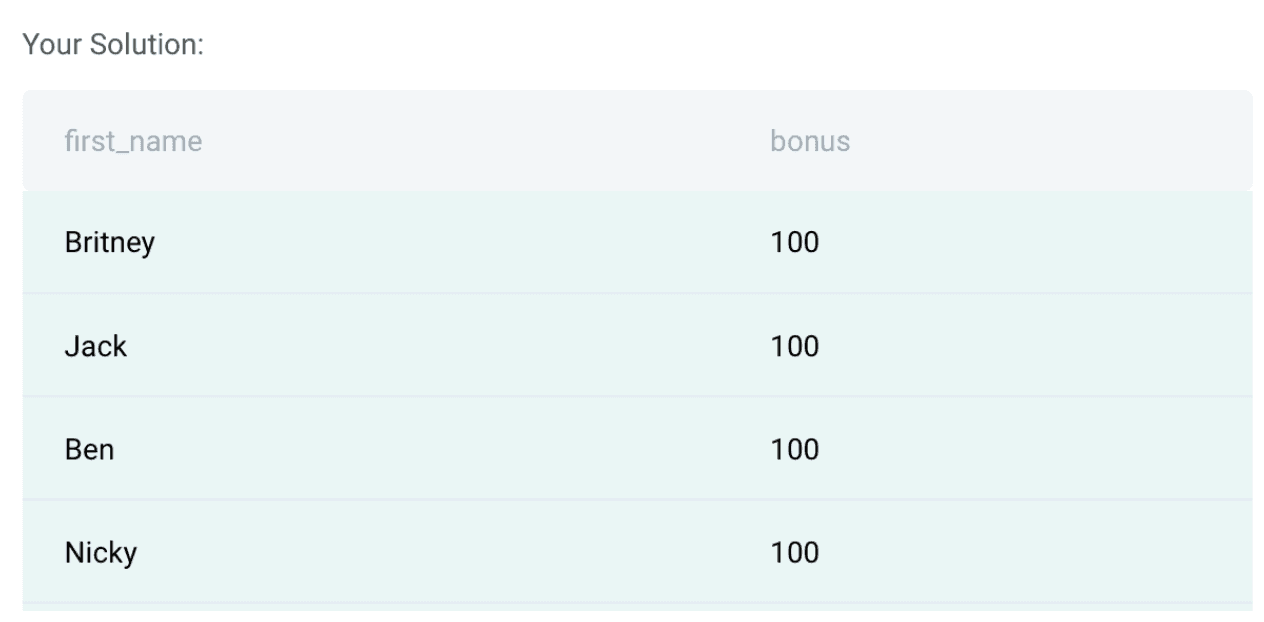
In this question, you need to first check which are the rows in the table with bonus < 150. There is one table provided to solve this question:
From the above table, we can see ‘bonus’ and ‘first_name’ fields that are required to solve this question. The first step is to filter the data for rows with a bonus less than 150. Please find the sample code for it below:
# Import your libraries
import pandas as pd

# Start writing code
employee = employee[employee['bonus']<150]
Once we do this, we select the first_name and bonus fields as mentioned in the question for the final query.
Final Query:
# Import your libraries
import pandas as pd

# Start writing code
employee = employee[employee['bonus']<150]

employee[['first_name','bonus']]- The dataset has already been loaded as a pandas.DataFrame.
- print() functions and the last line of code will be displayed in the output.
- In order for your solution to be accepted, your solution should be located on the last line of the editor and match the expected output data type listed in the question.
Output:
These are the types of coding questions that are typically asked in Python. If you want to practice more, head over to StrataScratch platform which has a wide range of questions. Also, check out the pandas interview questions for data science for more info.
Non-Coding
In this section, we will be covering the non-coding interview questions that may be asked in a data science interview. This section of questions is critical for the data science interview preparation since the interview usually has a broad range of topics. The non-coding questions can be on System Design topics, Probability, Business Case Study, Statistics, Modeling, Technical or Product. These questions can also be asked as a follow-up to the code that you wrote in the coding round. Now let’s look at different types of non-coding questions that can be asked in a Data Science Interview.
System Design

This category of questions tests your ability to solve design problems and create systems from scratch. These are typically theoretical questions with some calculations. Now let's look at a few examples.
Data Science Interview Questions #9: Restaurant Recommendation

Link to the question: https://platform.stratascratch.com/technical/2394-restaurant-recommendation
This question asks you to build a ‘restaurants you may like’ recommender system on the news feed.
Solution:
To solve such questions, you need to have a basic understanding of how the recommender system works and how best we can leverage those systems at Facebook for the given question. You can take inspiration from the recommender system build by Netflix.
The 'Restaurants you may like' recommender system is adopted using two methods:
Content-Based Filtering (CBF):
Definition: It models users' tastes based on their past behaviors but does not benefit from data on other users.
Limitation of this method:
- Novelty in recommended results because it only looks at the user's history and never jumps to other areas that users might like but haven't interacted with before.
- If the quality of content does not contain enough information to discriminate the items precisely, CBF will perform poorly.
Collaborative Filtering (CF):
Definition: CF looks at user/item interactions (visits) and tries to find similarities among users or items to do the recommender job.
Limitations:
- Sparse interaction matrix between users and items: where many users have very few or even no interactions.
- Cold Start Problem: It is a huge problem to find suitable restaurants, especially for newcomers to specific areas.
To solve the limitations of both methods, a hybrid approach can be used, which leverages the collaborative information between users, items, and metadata to complete the recommendation job.
Data Science Interview Questions #10: Python Dictionary to Store Data

Link to the question: https://platform.stratascratch.com/technical/2113-python-dictionary-to-store-data
When would I use a Python dictionary to store data, instead of another data structure?
Solution
I would use a Python dictionary to store data when the code readability is important and the speed of getting the data. I would also use it when the order of data is not essential.
A dictionary in Python is a structure for holding key-value pairs.
It should be used whenever:
- we want quick access to some data point (value), provided that we can uniquely associate that data with some identifier (key);
- The order of the data points is not important.
The key should be hashable, i.e., it can be passed to a hash function. A hash function takes an input of the arbitrary size and maps it to a relatively smaller fixed-size output (hash value) that can be used for table lookup and comparison.
There are no restrictions on the type of dictionary value. This is an important advantage of dictionaries over sets in Python because sets require that all values are hashable.
Data Science Interview Questions #11: Build a Recommendation System

Link to the question: https://platform.stratascratch.com/technical/2148-build-a-recommendation-system
Solution:
The type of recommendation system (RS) that is supposed to be built depends on the size of the current user (and product/item) base of the application.
RSs have a "cold-start" problem, i.e., if we have a low amount of data then they aren't effective at all. But, once we gather enough data points, we can utilize them to provide recommendations to our users.
Therefore, to solve the cold-start problem I would suggest a popularity-based algorithm. A popularity-based algorithm ranks all items by some metric (e.g., purchase count, number of views, etc.) and recommends the items that rank at the top. It is very obvious that this approach over-fits on the most popular items, and always recommends them, but when we have a low number of items it makes sense.
Once the user base grows, and we have gathered some amount of data, we can apply a more advanced algorithm for recommending items. The two most popular approaches are:
- Item-based filtering: to each user we recommend the items that are most similar to his purchase history
- User-based filtering: to each user we recommend the items that are most frequently bought by users that are most similar to them
In both cases, the measure of similarity needs to be defined and is application-specific. In practice, the two approaches are often combined to provide a hybrid RS.
Yet another approach to building an RS is through a classification model. A classification model would take as input user- and item-related features and output a probability/label for each item that would represent the likelihood that the user would buy that item. The model can be any classification model: logistic regression, KNN, neural network, etc. I would imagine that this is the approach that the big companies (like Amazon, Google, Netflix) implement to provide personalized recommendations.
Probability

Data Science Interview Questions #12: Four People in an Elevator

Link to the question: https://platform.stratascratch.com/technical/2358-four-people-in-an-elevator
Solution:
The total possibilities of assigning 4 floors from 4 people:
Since there are 4 people and each person can get off on any of the 4 floors, the total possibilities of assigning 4 floors from 4 people without repetitions:
This means that the first person has 4 options for choosing the floor, the second person has 3 options, the third person has 2 options, and the last person only has 1 option.
Thus, the probability that each person gets off on a different floor would be:
Data Science Interview Questions #13: Pick 2 Queens

Link to the question: https://platform.stratascratch.com/technical/2278-pick-2-queens
Solution:
Since there are a total of 52 cards and 4 queens in a deck of cards, then the probability of us getting a queen in a first trial would be:
If we got a queen in the first trial, then there are 3 more queens in 51 cards, thus the probability of us getting a queen in the second trial would be:
The probability of us getting 2 queens would be getting a queen in the first trial and second trial, or:
Statistics

Data Science Interview Questions #14: Central Limit Theorem

Link to the question: https://platform.stratascratch.com/technical/2386-central-limit-theorem
Solution:
Central Limit Theorem can be explained in multiple parts:
- The average of the sample means is equal to the mean of the population, regardless the sample size or the population distribution
- The standard deviation of the sample means is equal to the standard deviation of the population divided by square root the sample size
- If the population is normal distribution, the sampling distribution of the sample means will have a normal distribution regardless the sample size
- If the population distribution isn’t normal, sample sizes of 30 or more are frequently regarded adequate for the CLT to hold
Data Science Interview Questions #15: Assessing Multicollinearity

Link to the question: https://platform.stratascratch.com/technical/2380-assessing-multicollinearity
Solution:
To handle the multicollinearity, there are a few common ways as below:
1. Correlation Matrix
A correlation matrix shows Pearson correlation between two independent variables. If the correlation coefficient between the two independent variables is more than 0.75, then we consider that those variables have high collinearity.
2. Variance Inflation Factor (VIF)
VIF measures the ratio between the variance for a given coefficient with only the corresponding independent variable in the model versus the variance for a given coefficient with all independent variables in the model.
A VIF for the ith independent variable is defined as:
Where R(i) is a measure of the variance when only the ith variable is at play, relative to the variance when all the variables are included. The closer the VIF value is to 1, the less correlated the variable is to all other predictors. Hence, to assess multicollinearity in a dataset, we can compute the VIF for all the predictive variables, and assign a cutoff (typically between 5 and 10) as our threshold.
Data Science Interview Questions #16: Precision and Recall
Link to the question: https://platform.stratascratch.com/technical/2327-precision-and-recall
Solution:
Precision and Recall are both evaluation metrics that are commonly applied in a classification task.
Precision
Precision tries to answer the following use cases:
How big is the proportion of positive predictions from our ML model that were actually correct?
Recall
Recall tries to answer the following use case:
How big is the proportion of the actual positive that was correctly predicted by our model?
Modeling

Data Science Interview Questions #17: Few instances Labeled
Link to the question: https://platform.stratascratch.com/technical/2338-few-instances-labeled
Solution:
So the question is “What techniques can be used to train a classifier using a large dataset in which only a small proportion of instances are labeled?”
If we have a large dataset, in which only a small proportion of instances is labeled, then we can use a semi-supervised machine learning technique.
In practice, semi-supervised machine learning algorithms consist of the combinations of supervised algorithms and unsupervised algorithms. As an example, an algorithm that combines k-means clustering and one of the classification algorithms such as neural networks, SVM, random forests, etc.
As an example let’s say we want to classify a huge amount of handwritten digits between 0-9. Labeling all of the handwritten digits would be time consuming and costly. What we can do is:
- First, use K-means clustering to cluster all of the handwriting digits, let’s say we initialize 100 clusters.
- Next, we pick the data point in each cluster that is closest to the centroid of each cluster which means that we have 100 handwritten digits instead of the whole dataset.
- Next we can label each of these 100 handwritten digits and use them as an input of our classification algorithms to obtain the final prediction of the data.
Data Science Interview Questions #18: Features Correlation

Link to the question: https://platform.stratascratch.com/technical/2293-features-correlation
Solution:
If two features correlate to one another, then they will introduce the so-called multicollinearity problem.
What is Multicollinearity?
Multicollinearity occurs in linear regression when two or more independent variables (features) are correlated to one another. This shouldn't happen in linear regression since as the name suggests, an independent variable should be independent of the other independent variables.
What is the Problem with Multicollinearity?
A simple linear regression model has the following equation:
Where:
y^ : predicted value
θ(0): Intercept
θ(1): weight of the first feature
x(1): the first feature’s value
When our linear regression model has multicollinearity issues, then:
- The weight of each feature will be highly sensitive to a tiny change in the model. For example, if we add or remove one feature from the model, the weight of each feature will fluctuate massively. As a result, it becomes difficult to interpret the influence of one feature on the performance of our linear regression model.
- Multicollinearity will inflate the error and standard deviation of the weight of each feature. This becomes a problem because we can't trust the statistical result that comes out from the model (p-Value) for each feature when we want to do feature selections (adding or removing features to the model)
If you would like to learn more about multicollinearity in greater depth and how we can resolve this problem, check out this resource.
Technical

Data Science Interview Questions #19: Database Normalization
Link to the question: https://platform.stratascratch.com/technical/2330-database-normalization
Solution:
Database normalization is the transformation of complex user views and data stores to a set of smaller, stable data structures. In addition to being simpler and more stable, normalized data structures are more easily maintained than other data structures.
Steps
- 1st Normal Form (1 NF): The first stage of the process includes removing all the repeating groups and identifying the primary key. To do so, the relationship needs to be broken up into two or more relations. At this point, the relations may already be of the third normal form, but it is likely more steps will be needed to transform the relations into the third normal form.
- 2nd Normal Form (2 NF): The second step ensures that all non-key attributes are fully dependent on the primary key. All partial dependencies are removed and placed in another relation.
- 3rd Normal Form (3 NF): The third step removes any transitive dependencies. A transitive dependency is one in which non-key attributes are dependent on other non-key attributes.
After 3NF, the rest of the normalizations are optional and design choices are dependent on the nature of the dataset.
4. Boyce-Codd Normal Form (BCNF): It is the higher version of the 3NF. This form deals with a certain type of anomaly that is not handled by 3NF. A 3NF table which does not have multiple overlapping candidate keys is said to be in BCNF. For a table to be in BCNF, the table must be in the 3rd Normal Form and, for each functional dependency (X -> y) , X should be a super Key.
5. 4th Normal Form (4NF): For a table to satisfy the Fourth Normal Form, it should be in the Boyce-Codd Normal Form and the table should not have any Multi-valued Dependency.
Data Science Interview Questions #20: N-Gram

Link to the question: https://platform.stratascratch.com/technical/2045-n-gram
Solution:
N-gram is a sequence of N words or letters that are commonly used in the area of Natural Language Processing to achieve various things: for example, as an input for model training to do a sentence auto-completion task, spelling check tast, or grammar check task.
- 1-gram means a sequence only has one word, such as “Saturday”,”is”,”my”,”favorite”,”day”
- 2-gram means a sequence that has two records, such as “Saturday is”, “is my”, “my favorite”, “favorite day”
And so on with 3, 4, 5 grams. As you notice, the bigger the sequence of N-grams, the more context that it provides.
Product

Data Science Interview Questions #21: Customer Engagement and Disengagement
Link to the question: https://platform.stratascratch.com/technical/2392-customer-engagement-and-disengagement
Solution:
Customer engagement refers to users' recurring encounter with your product or brand throughout their user journey.
There are four ways to measure customer engagement:
- By month, week or day: Find out how many loyal users use your product on a daily, weekly or monthly basis. It totally depends on how you expect your users to use the app. An important KPI here is stickiness: The ratio between daily active users and monthly active users.
- By Channel: Find the acquisition channels that bring the most profitable customers.
- By Feature Usage: Identify invaluable features for your users.
- By Customer Health Score: Predicts the likelihood of getting a selected outcome from a customer based on engagement.
Data Science Interview Questions #22: Click on Search result
Link to the question: https://platform.stratascratch.com/technical/2378-clicks-on-search-result
Solution:
To answer this question, one of the users from StrataScratch has provided a very detailed solution as below:
What steps would you take to investigate the reason behind the change
1. Clarify the metric
- What is the process of the search result
- What exactly is a facebook event
2. Temporal
- How fast did the increase change
- Was it after a month of time of was it a gradual change
- Were there any outliers in a week that cause the 10% change
- Look at the historical week over week percentage and determine whether it is a normal variation or not
IF NONE OF THESE ARE THE CASE THEN CONTINUE
3. Internal product change
- Was there some sort of change in product that could have caused this change in metric
- ex. Change in the order of search results (events pop up more), change in product to increase volume of searches leading to more clicks
4. External change
- Significant events that are popping up causing more clicks
- Increase number of events
5. Metric decomposition
- Does the week over week metric include overall searches or is it only clicks to events
- Inspect why overall searches may have have increased
How do you decide if the change has a good or bad impact on the business
1. Clarify what are the goals of the business
- What does meta gain through more clicks on events
- Do these event pages have advertisements people can see
- Does meta gain revenue from more click throughs on events pages
- Or is the goal with the product just overall more interaction with the facebook platform?
2. Once the goal of the product is defined then we can solidify metrics
- What other metrics can we look at
- What are ad click through rates on the pages
- What is the increase in revenue
- Does increased click through rate lead to longer facebook session times
3. Make a recommendation with all the information
- ex. If the increase leads to shorter session times then we may want to diagnose the problem and revert whatever changes were made
Conclusion
You should be prepared for a wide variety of question types while preparing for a data science job interview. Coding and non-coding data science interview questions are the two main categories.
Even though coding-related questions are the most frequent, you still need to have other skills. The non-coding questions are essential because of this. They serve as a means of demonstrating your technical proficiency as well as your knowledge of the products, modeling, and system design.
The questions you'll encounter at the data science interviews for prestigious companies are described in this guide. Getting a job in these companies is not simple. Going through each question is just the beginning. The remaining code and non-coding interview questions are now your turn to examine. Use the StrataScratch platform for more practice.
Share