Python Pandas Interview Questions for Data Science (Part 2)


Categories:
 Written by:
Vivek Sankaran
The concluding part of the using Pandas for Python Data Science Interview Questions
In the previous article, Python Pandas Interview Questions for Data Science Part 1, we looked a how to get data into Pandas and perform basic calculations like
- Sorting DataFrames
- Handling Duplicates
- Aggregations
- Merging DataFrames
- Calculated Fields
In the second part of the series, we will build on that knowledge and use it to solve more complex Python Pandas interview questions. We will look at areas like
- Datetime Manipulation
- Text Manipulation
- Applying Functions
- Advanced Aggregations
- Offsetting Data
- Statistics using Pandas
If you are not acquainted with the Pandas library, please go through that article. Let us begin.
Applying Functions
In the previous part of our series, we looked at how to create additional fields. We can also use functions from Python libraries or user defined functions to manipulate values. To do this, we use the apply() method. The apply() method uses vectorization and hence, can calculate values much faster compared to iterating through each row in a series. Here is an easy one from an AirBnB Data Science Interview.
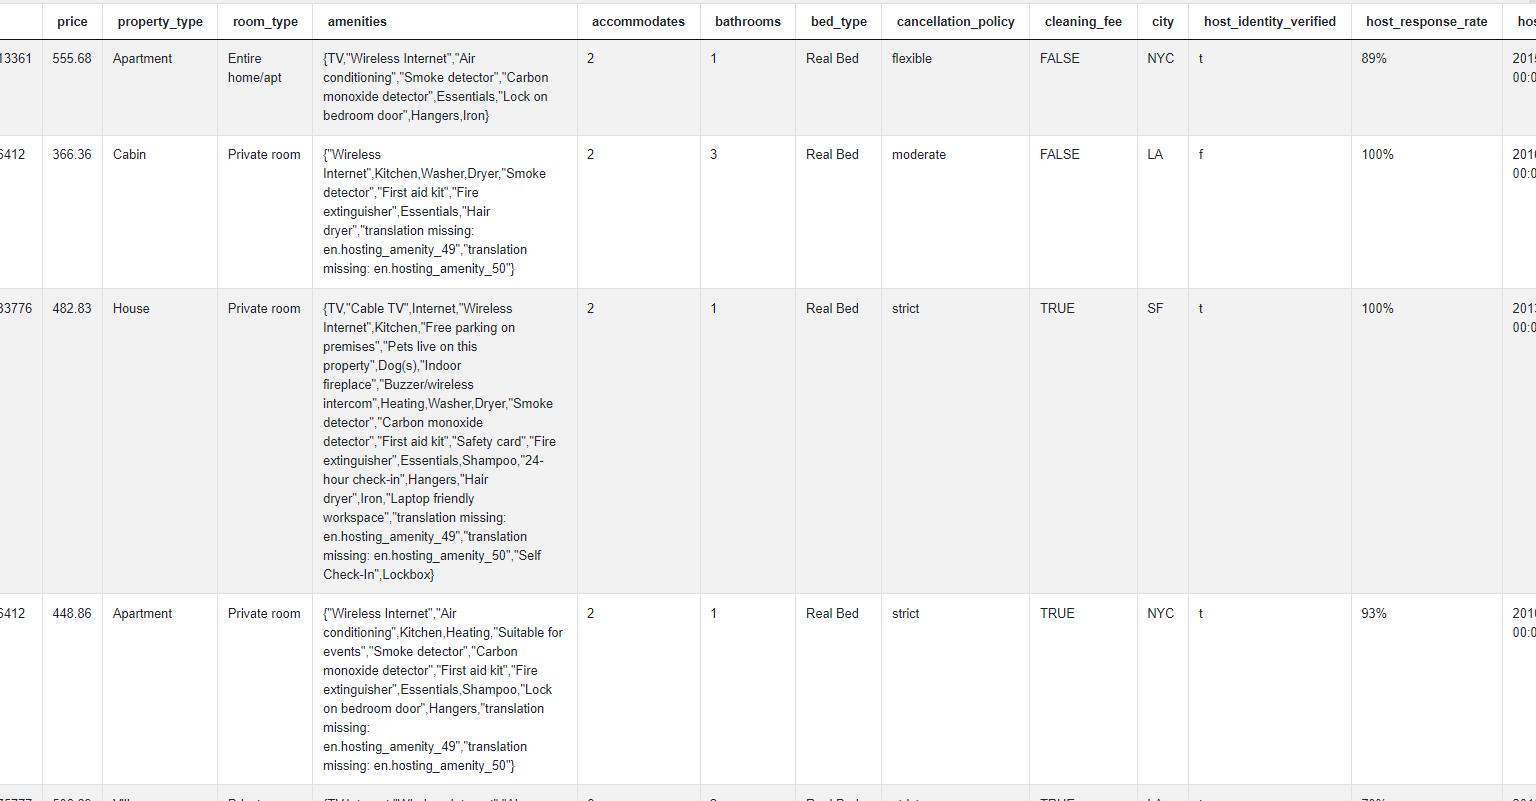
City With Most Amenities
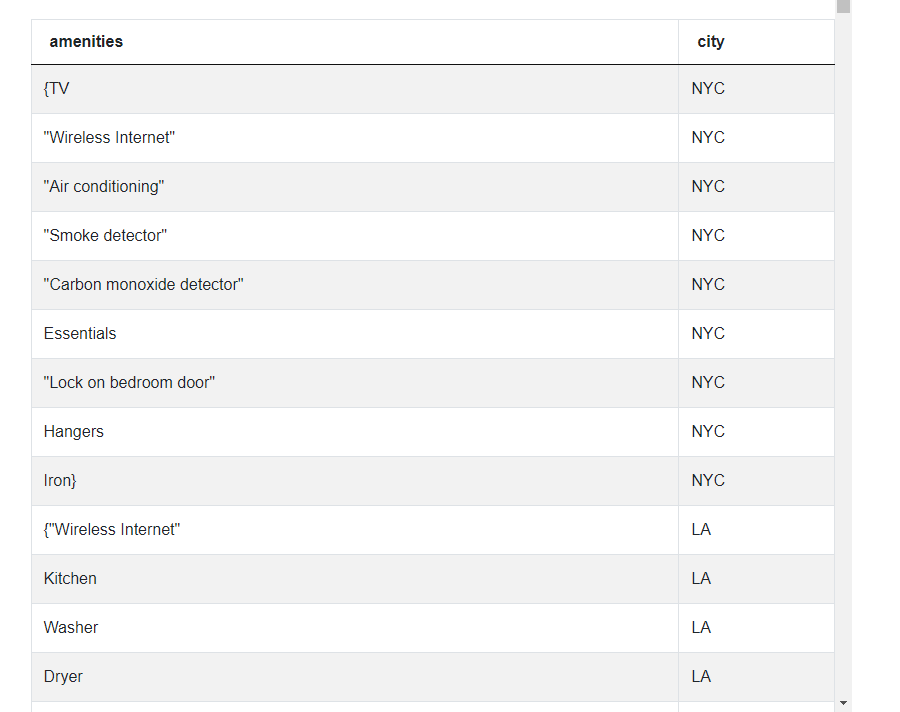
Find the city with the most amenities across all their host's properties from the given dataset of searches for properties on Airbnb. Assume that each row represents a unique host. Output the name of the city as your solution.

You can try to solve this https://platform.stratascratch.com/coding/9633-city-with-most-amenities
The problem uses the airbnb_search_details dataset with contains these fields
| id | int64 |
| price | float64 |
| property_type | object |
| room_type | object |
| amenities | object |
| accommodates | int64 |
| bathrooms | int64 |
| bed_type | object |
| cancellation_policy | object |
| cleaning_fee | bool |
| city | object |
| host_identity_verified | object |
| host_response_rate | object |
| host_since | datetime64[ns] |
| neighbourhood | object |
| number_of_reviews | int64 |
| review_scores_rating | float64 |
| zipcode | int64 |
| bedrooms | int64 |
| beds | int64 |
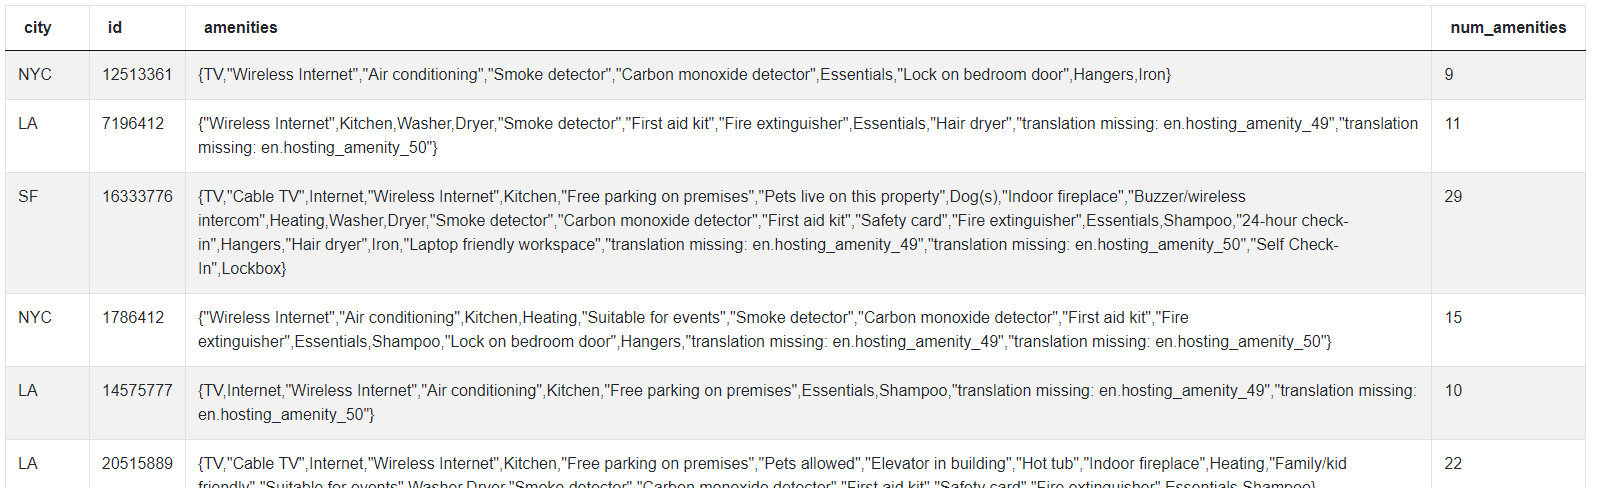
Here is how the data is presented.
Approach and Solution
Let us break this problem down. All the amenities for a given property are given in the amenities column. The amenities are listed in a string separated by commas. We find the number of amenities by simply splitting the string using the comma separator and taking the length of the resultant list.
# Import your libraries
import pandas as pd

# get the number of number of amenities
airbnb_search_details['num_amenities'] = airbnb_search_details
['amenities'].apply(lambda x : len(x.split(",")))
airbnb_search_details[['city', 'id', 'amenities', 'num_amenities']]
The dataset now looks like this.

We can now simply sum up the number of amenities for each city and output the city with the maximum number of amenities. We can combine all these methods in a single line using method chaining.
# Summarize by city and output the city with the most amenities
airbnb_search_details.groupby(by = ['city'], as_index = False).agg
({'num_amenities' : 'sum'}).sort_values(by = ['num_amenities'],
ascending = False).reset_index()['city'][0]
We are not restricted to built-in functions. We can create our own functions and create lambda functions on the fly. Let us try that in the following Python Pandas interview question. This one appeared in a City of San Francisco Data Science Interview.
Classify Business Type
Classify each business as a restaurant, cafe, school, or other. A business classified as a restaurant should have the word 'restaurant' in the business name. For cafes, either 'cafe', 'café', or 'coffee' should be in the business name. Schools will have the word 'School'. If a business is not a restaurant, café or a school, as per the above rules, it should be classified as ‘other’


You can solve this https://platform.stratascratch.com/coding/9726-classify-business-type
This problem uses the sf_restaurant_health_violations dataset that has the following fields.
| business_id | int64 |
| business_name | object |
| business_address | object |
| business_city | object |
| business_state | object |
| business_postal_code | float64 |
| business_latitude | float64 |
| business_longitude | float64 |
| business_location | object |
| business_phone_number | float64 |
| inspection_id | object |
| inspection_date | datetime64[ns] |
| inspection_score | float64 |
| inspection_type | object |
| violation_id | object |
| violation_description | object |
| risk_category | object |
The data looks like this.

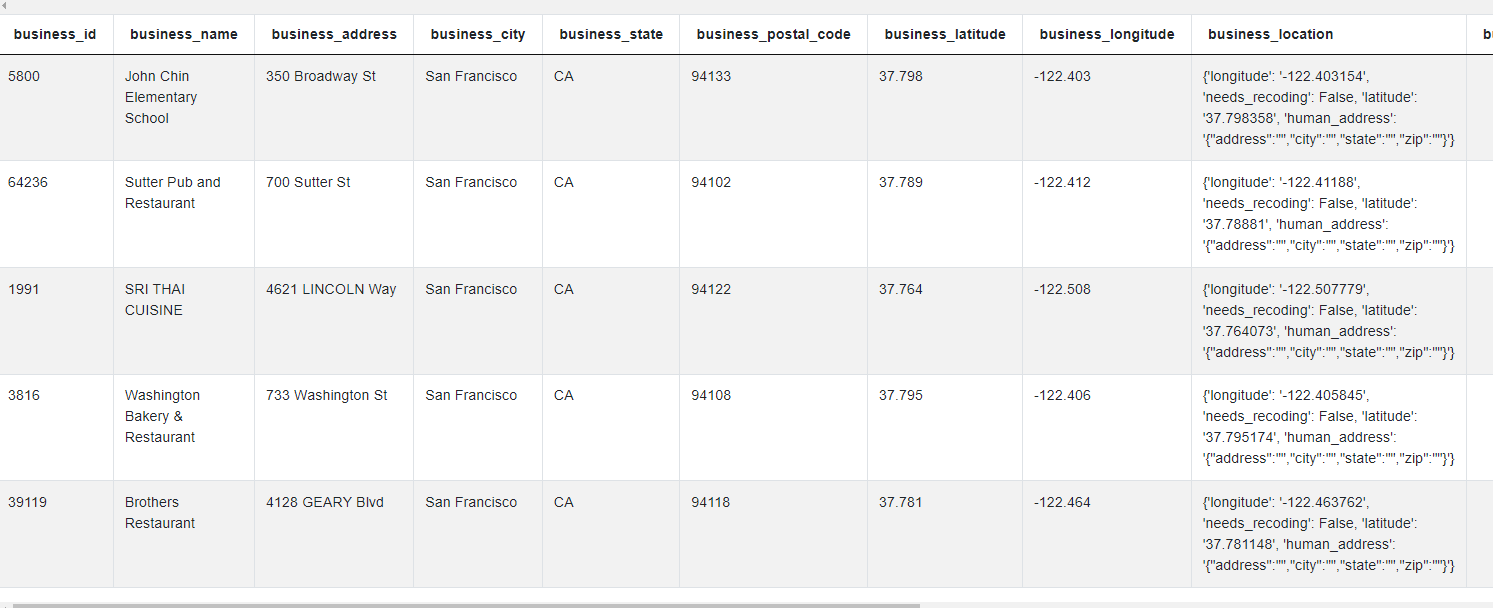
Approach and Solution
The only relevant field for this Python Pandas interview question is the business_name column. We write a lambda function and use the apply method to check which of the business rules a business satisfies. Once we have the category, we output the relevant fields as required in the problem.
# Import your libraries
import pandas as pd

# Classify as per the rules
sf_restaurant_health_violations['category'] = sf_restaurant_health_violations
['business_name'].apply(lambda x: \
'school' if x.lower().find('school') >= 0 \
else 'restaurant' if x.lower().find('restaurant') >= 0 \
else 'cafe' if (x.lower().find('cafe') >= 0 or x.lower().find('café') >= 0 \
or  x.lower().find('coffee') >= 0) \
else 'other'
    )
# Output relevant fields
sf_restaurant_health_violations[['business_name', 'category']].drop_duplicates()
As we can see, the apply method is a very powerful way of manipulating values and creating calculated fields using functions either user defined or from a Python library.
Advanced Aggregations
We had seen aggregations using the groupby method in the last article. Pandas supports other aggregations as well and we can also create a spreadsheet style pivot table. Let us see how to do that with Pandas. We start one from a City of San Francisco Data Science Problem.
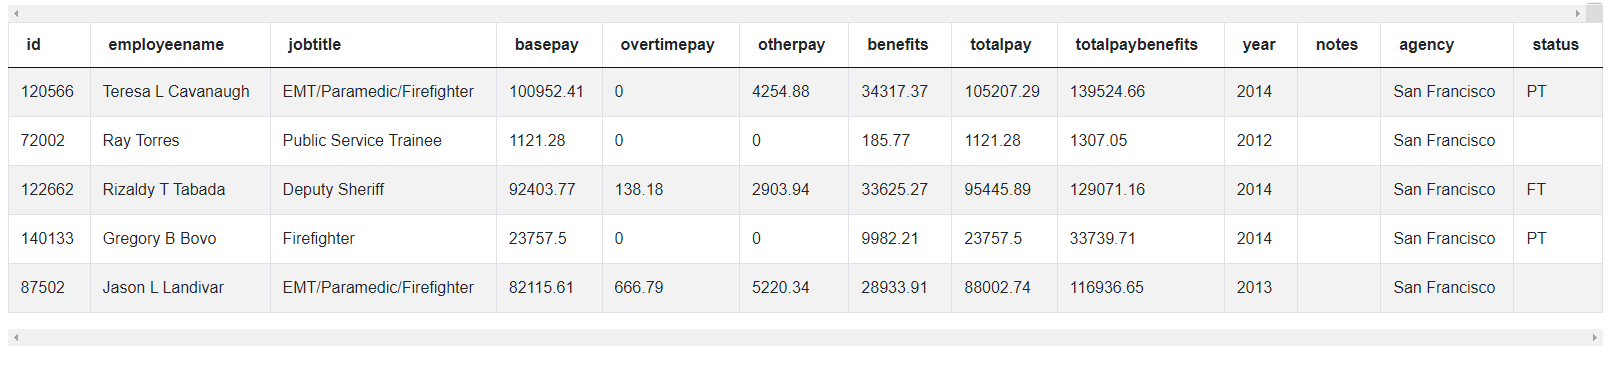
Make a pivot table to find the highest payment in each year for each employee
Find the highest payment for each employee across each of the years 2011 through to 2014. Output the result as a table with the year in columns and employee names along the rows sorted in alphabetical order.

You can try to solve this https://platform.stratascratch.com/coding/10145-make-a-pivot-table-to-find-the-highest-payment-in-each-year-for-each-employee
The problem uses the sf_public_salaries dataset with the following fields.
| id | int64 |
| employeename | object |
| jobtitle | object |
| basepay | float64 |
| overtimepay | float64 |
| otherpay | float64 |
| benefits | float64 |
| totalpay | float64 |
| totalpaybenefits | float64 |
| year | int64 |
| notes | datetime64[ns] |
| agency | object |
| status | object |
The data is presented thus.

Approach and Solution
While this problem might be a bit difficult with SQL, with Pandas, this problem can be solved in a single line of code using the pivot_table() function. We simply pass the right arguments and get the desired output.
# Import your libraries
import pandas as pd

# create the pivot table
pd.pivot_table(data = sf_public_salaries, columns = ['year'],
index = 'employeename', values = 'totalpay', aggfunc =
'max', fill_value = 0).reset_index()
The pivot_table() method is quite powerful and can help solve complex aggregations very quickly. Here is another example. This one is from a Facebook Data Science Interview.
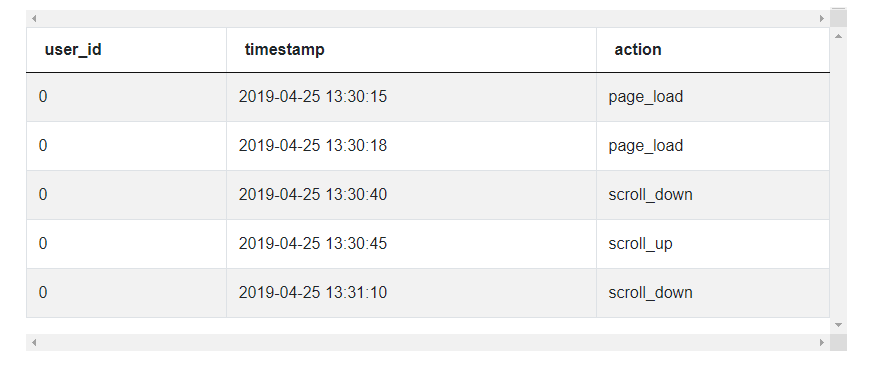
Time Between Two Events
Report the user with the least amount of time between a page load and their first scroll down. The output should include the user id, page load time, first scroll down time, and time between the two events in seconds.


You can solve this https://platform.stratascratch.com/coding/9784-time-between-two-events
This problem uses the facebook_web_log dataset that has the following columns.
| user_id | int64 |
| timestamp | datetime64[ns] |
| action | object |
The data is presented thus.

Approach and Solution
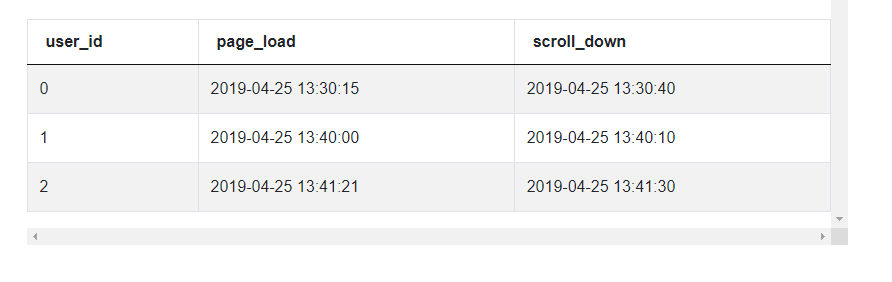
Again, this interview question could be a little complex in SQL. However, in Pandas, this is relatively straightforward with the use of a pivot table. We start off by creating a pivot table with the earliest instance of each action for each user_id. Since we need only the page_load and scroll_down events, we keep only those columns in the output.
import pandas as pd

# Find the first instance of diffrent actions
summ_df = pd.pivot_table(data = facebook_web_log, index = 'user_id', columns =
'action', aggfunc = 'min', values = 'timestamp').reset_index()[['user_id',
'page_load', 'scroll_down']]
The output looks like this.

Now the problem becomes very simple. We can directly calculate the duration by taking the difference between the scroll_down and page_load timestamps. We then output the user_id and other required fields for the user with the lowest duration.
# Caclulate duration
summ_df['duration'] = summ_df['scroll_down'] - summ_df['page_load']
# Output the user details for the user with the lowest duration
summ_df.sort_values(by = ['duration'])[:1]
As you can see, the pivot_table() function allows us to do multiple aggregations without having to separate them out and merge them and we might do in SQL.
Datetime Manipulation
Datetime manipulation is one of the most frequently asked Data Science Interview questions. The ubiquity of datetime datasets and a range of complexity that can be achieved with simple looking data makes it a popular Data Science test area. Pandas has numerous datetime functions covering a wide range of datetime use cases. Once you have loaded data into Pandas in datetime format, one can extract the relevant datetime functions from a datetime object in Pandas by invoking the .dt accessor. This provides us access to a wide variety of datetime methods that can be accessed over the entire Pandas Series.
Let us use it in a real world Python Pandas interview question. This one is from a DoorDash Data Science Interview.
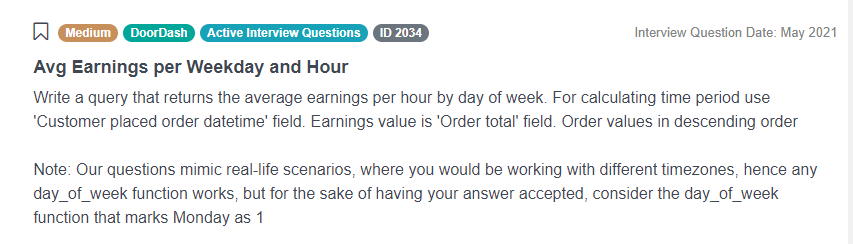
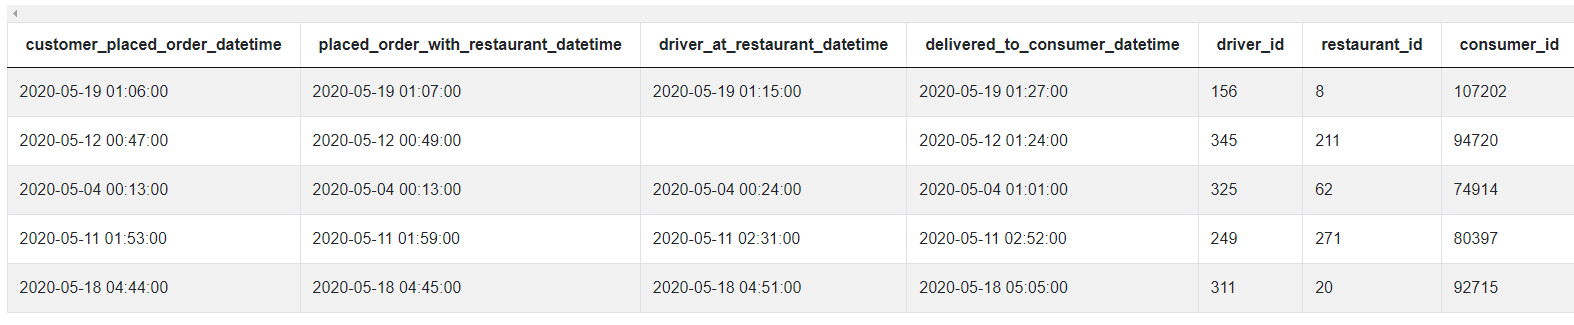
Avg Earnings per Weekday and Hour
Report the average number of earnings per hour for each day of the week. Use the customer_placed_order_datetime field as for calculating the relevant date time values. The Earnings can be taken as the sum of the 'Order total' field.
Consider Monday as the first day of the week.

You can solve this https://platform.stratascratch.com/coding/2034-avg-earnings-per-weekday-and-hour
The problem uses the doordash_delivery dataset that has the following fields.
| customer_placed_order_datetime | datetime64[ns] |
| placed_order_with_restaurant_datetime | datetime64[ns] |
| driver_at_restaurant_datetime | datetime64[ns] |
| delivered_to_consumer_datetime | datetime64[ns] |
| driver_id | int64 |
| restaurant_id | int64 |
| consumer_id | int64 |
| is_new | bool |
| delivery_region | object |
| is_asap | bool |
| order_total | float64 |
| discount_amount | float64 |
| tip_amount | float64 |
| refunded_amount | float64 |
The dataset looks like this.

Approach and Solution
To solve this Python Pandas interview question, we need to extract the day of the week and the hour from the relevant datetime field. As mentioned in the problem, this field is 'customer_placed_order_datetime'.
To get the day of the week, we use the .dt.weekday attribute. As per the documentation, this returns 0 for Monday and 6 for Sunday. Since we need to start with 1 for Monday, we add 1 to the result.
# Import your libraries
import pandas as pd

# Keep relevant fields
dd_df = doordash_delivery[['customer_placed_order_datetime', 'order_total']]
# Get the day of the week (add 1 to keep have Monday = 1)
dd_df['weekday'] = dd_df['customer_placed_order_datetime'].dt.weekday + 1
Similarly, we can also extract the hour of the day. To do this we use the .dt.hour attribute of the datetime object.
# Hour of the day
dd_df['hour'] = dd_df['customer_placed_order_datetime'].dt.hour
We can now simply aggregate by day of the week and hour of the day and output the relevant columns.
dd_df.groupby(by = ['weekday', 'hour'], as_index = False).agg
({'order_total': 'mean'})
Let us try a slightly more difficult Python Pandas interview question. This one is from a Salesforce Data Science Interview and uses both datetime manipulation as well as pivot tables.
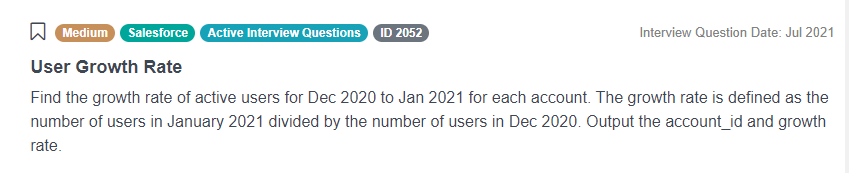
User Growth Rate
Calculate the growth rate of active users for Jan 2021 over Dec 2020 for each account.

You can solve this https://platform.stratascratch.com/coding/2052-user-growth-rate
The problem uses the sf_events dataset that has the following columns.
| date | datetime64[ns] |
| account_id | object |
| user_id | object |
The data looks like this.


Approach and Solution
We need to aggregate number of users across two different time periods for each account. This is a perfect case for a pivot table. But before we do that, we start off by extracting the year and month from the date as we have to aggregate across months. To do this we use the .strftime() method. This extends the strftime() method available in the Python datetime library. This is very similar to the TO_CHAR() function in SQL that we had discussed in SQL Datetime article.
# Import your libraries
import pandas as pd

# Create the Year - Month indicator
sf_events['month'] = sf_events['date'].dt.strftime('%Y-%m')
We can now aggregate using the pivot table for the months of Dec 2020 and Jan 2021, calculate the growth rate and output the relevant columns.
# Aggregate relevant months
summ_df = sf_events[sf_events['month'].isin(['2020-12', '2021-01'])].
pivot_table(
    index = 'account_id', columns = 'month', values = 'user_id', aggfunc =
    'nunique').reset_index()
# Calculate growth rate and output relevant columns
summ_df['growth_rate'] = summ_df['2021-01'] / summ_df['2020-12']
summ_df[['account_id', 'growth_rate']]
Text Manipulation
As with datetime functions, Pandas provides a range of string functions. Like the .dt accessor for datetime functions, we can use .str accessor to use the standard string functions across the entire Series. There are some additional functions beyond the standard string library that can come in handy. Let us look at a few examples of Python Pandas interview questions. The first one is from a City of Los Angeles Data Science Interview
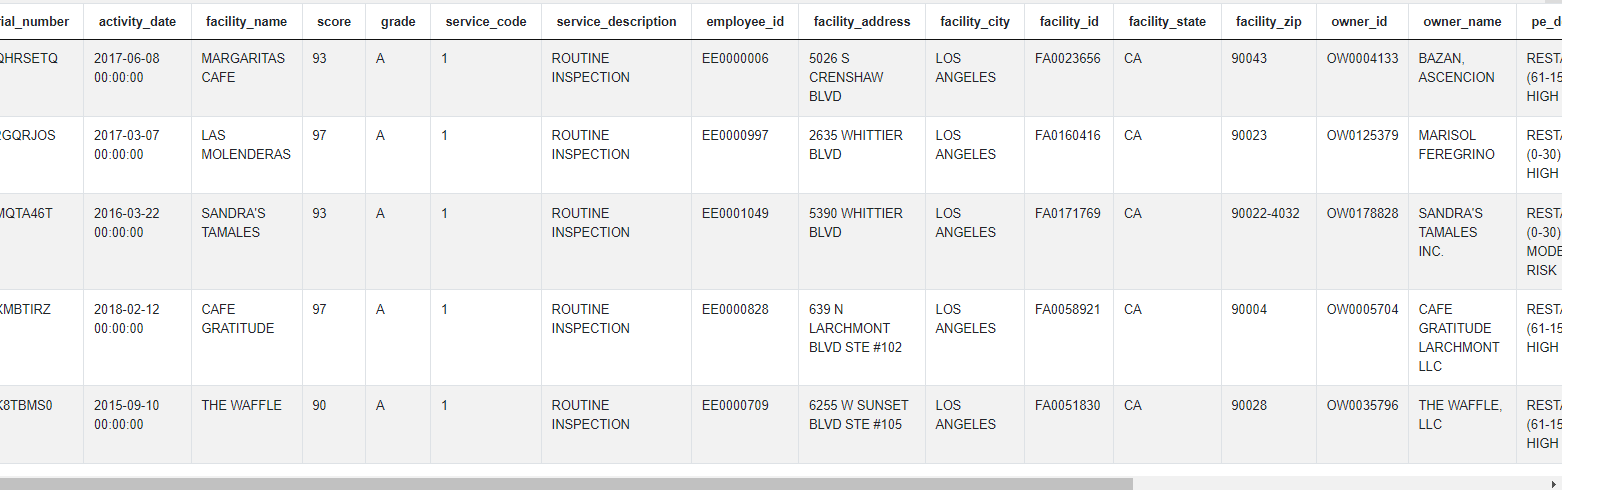
'BAKERY' Owned Facilities


You can solve this https://platform.stratascratch.com/coding/9697-bakery-owned-facilities
The problem uses the los_angeles_restaurant_health_inspections dataset with the following fields.
| serial_number | object |
| activity_date | datetime64[ns] |
| facility_name | object |
| score | int64 |
| grade | object |
| service_code | int64 |
| service_description | object |
| employee_id | object |
| facility_address | object |
| facility_city | object |
| facility_id | object |
| facility_state | object |
| facility_zip | object |
| owner_id | object |
| owner_name | object |
| pe_description | object |
| program_element_pe | int64 |
| program_name | object |
| program_status | object |
| record_id | object |
The data is presented as below.

Approach and Solution
While there are a lot of columns in the dataset, the relevant ones are owner_name and pe_description. We start off by keeping only the relevant columns in the dataset and dropping duplicates (if any).
We then proceed to search for the text BAKERY in the owner_name field and LOW RISK in the pe_description field. To do this, we use the str.lower() method to convert all the values to lowercase and the .str.find() method to find the instances of the relevant text. The .str.find() is an extension of the Python built in method find() for string type variables.
We then output the rows that satisfy the two criteria using a Boolean Mask.
# Import your libraries
import pandas as pd

# Keep relevant fields
rel_df = los_angeles_restaurant_health_inspections[['owner_name', 'pe_description']].drop_duplicates()
# Find the relevant text in the two fields.
rel_df[(rel_df['owner_name'].str.lower().str.find('bakery') >= 0) &( rel_df['pe_description'].str.lower().str.find('low risk') >=0)]
Besides the usual string methods, the .str accessor also has some additional methods. One such method is explode().
As the name suggests, the method splits the Series or a particular column in a DataFrame. The other values (in case of a DataFrame) and the indexes are repeated. Let us see how this is used in practice. We use this in the AirBnB Data Science Interview Question that we had solved earlier in the article.
City With Most Amenities
Find the city with the most amenities across all their host's properties from the given dataset of searches for properties on Airbnb. Assume that each row represents a unique host. Output the name of the city as your solution.
Link to the question https://platform.stratascratch.com/coding/9633-city-with-most-amenities
The relevant fields in the airbnb_search_details dataset are amenities and city

Approach and Solution
We start off by keeping on the relevant fields in the dataset (this is not needed in the actual solution. We are doing it to make the solution simpler to understand).
# Import your libraries
import pandas as pd

# Keep Relevant fields
rel_df = airbnb_search_details[['amenities', 'city']]
We split the amenities string into a list by calling the split method.
# Split the amenities string
rel_df['amenities'] = rel_df['amenities'].str.split(",")
Now we invoke the explode() method on the amenities column.
rel_df = rel_df.explode('amenities')
As one can see, the explode method creates a separate row for each object inside an iterable like list, set, tuple, etc. Now we can aggregate the amenities on the city and output the result as earlier.
# Summaroze by city
rel_df.groupby(by = ['city'], as_index = False).agg({'amenities' : 'count'}).
sort_values(by = ['amenities'], ascending = False).reset_index()['city'][0]
The explode is a very powerful function and comes in very handy for text manipulation based questions.
Statistics using Pandas
Given the ability to work with tabular data, Pandas is a natural choice for statistical manipulation as well. While NumPy is considered the go-to library for statistical manipulation, since Pandas is built-on NumPy, it inherits quite a few statistical measures that can be invoked to calculate these measures easily. Let us look at a few examples. The first one is from a City of Los Angeles Data Science Interview question.
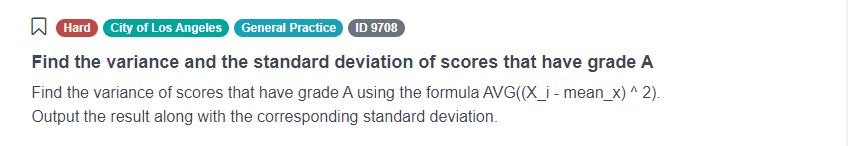
Find the variance and the standard deviation of scores that have grade A

You can try to solve this https://platform.stratascratch.com/coding/9708-find-the-variance-and-the-standard-deviation-of-scores-that-have-grade-a
The problem uses the los_angeles_restaurant_health_inspections dataset that we saw previously. The dataset has the following fields.
| serial_number | object |
| activity_date | datetime64[ns] |
| facility_name | object |
| score | int64 |
| grade | object |
| service_code | int64 |
| service_description | object |
| employee_id | object |
| facility_address | object |
| facility_city | object |
| facility_id | object |
| facility_state | object |
| facility_zip | object |
| owner_id | object |
| owner_name | object |
| pe_description | object |
| program_element_pe | int64 |
| program_name | object |
| program_status | object |
| record_id | object |
The data is presented thus.
Approach and Solution
Let us solve this by doing the calculations ourselves. We will then solve this by invoking the built in Pandas methods. We start off by subsetting the relevant fields and keeping only those scores that correspond to grade A.
# Import your libraries
import pandas as pd

# Subset relevant rows
la_df = los_angeles_restaurant_health_inspections[los_angeles_restaurant_health_
inspections['grade'] == 'A'][['grade', 'score']]
la_df
Variance is the average squared deviation from the mean. Population variance is defined as


Standard Deviation is the square root of the variance
We can calculate variance by calculating the average of the squared difference from the mean of the ranks. We can accomplish this in a single step by using vectorized operations. From the variance we can calculate the standard deviation easily. And finally output the results in the desired format.
variance = ((la_df['score'] - la_df['score'].mean())**2).mean()
stdev = variance ** 0.5
output_df = pd.DataFrame({'variance' : [variance], 'stdev' : [stdev]})
Instead of calculating the variance from the formula, we can also invoke the built-in Pandas statistical methods. Since we are calculating population variance and standard deviation, we need to specify to Pandas to not use Bessel's correction. We can do this by setting the ddof argument to 0 in both variance and standard deviation calculations.
variance = la_df['score'].var(ddof = 0)
stdev = la_df['score'].std(ddof = 0)
output_df = pd.DataFrame({'variance' : [variance], 'stdev' : [stdev]})
Let's try a slightly trickier one. This is from a Google Data Science Interview.
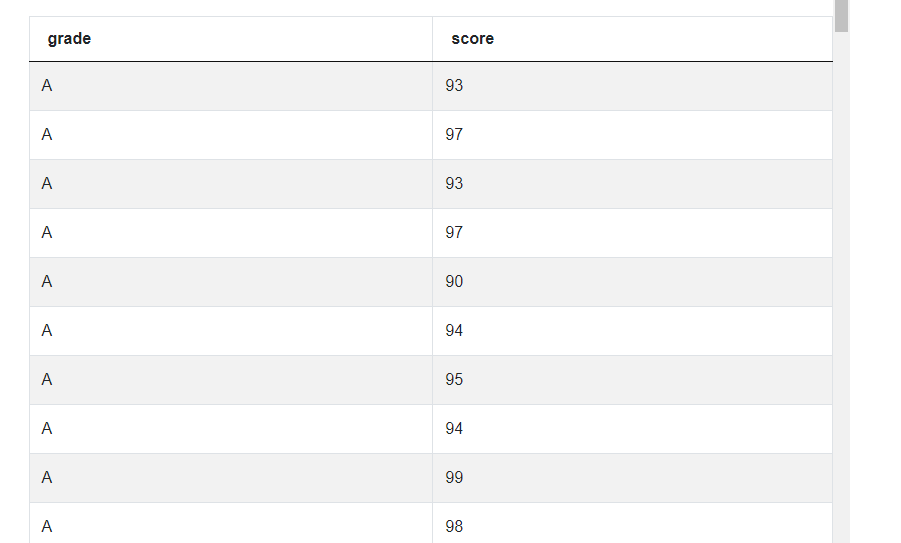
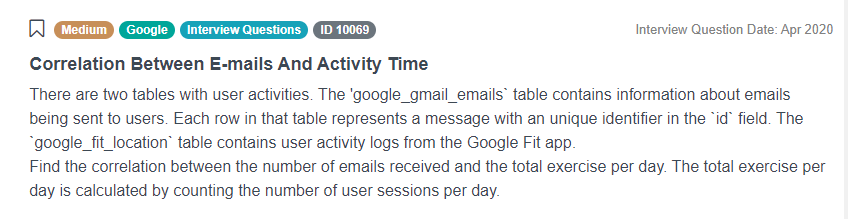
Correlation Between Emails And Activity Time
Find the correlation between the number of emails received by a user and the total exercise per day. The total exercise per day is the number of user sessions per day.

You can try to solve this https://platform.stratascratch.com/coding/10069-correlation-between-e-mails-and-activity-time
This problem uses two datasets
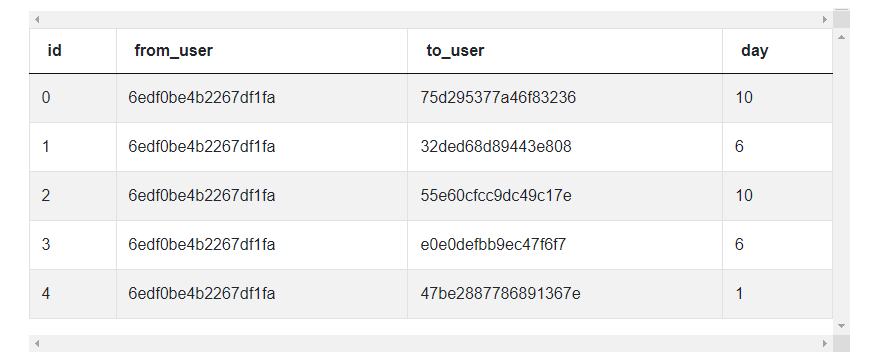
- google_gmail_emails which has the following fields.
| id | int64 |
| from_user | object |
| to_user | object |
| day | int64 |
The data is presented thus.

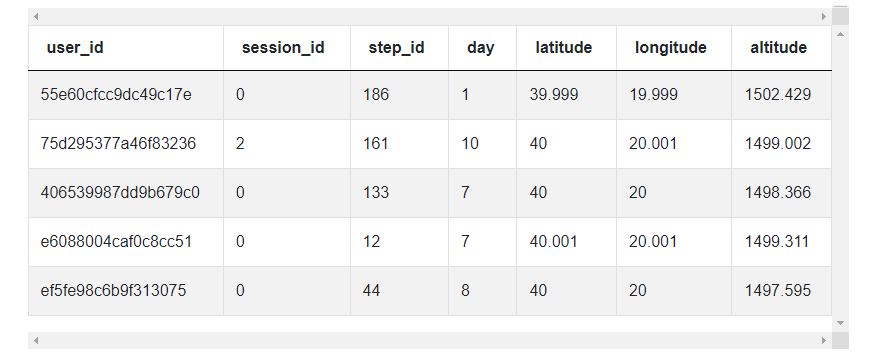
- The second dataset google_fit_location contains the following fields
| user_id | object |
| session_id | int64 |
| step_id | int64 |
| day | int64 |
| latitude | float64 |
| longitude | float64 |
| altitude | float64 |
The data looks like this.

Approach and Solution
We start off by calculating the number of emails sent to each user per day. We do this by aggregating the number of emails by user_id and day
import pandas as pd
import numpy as np
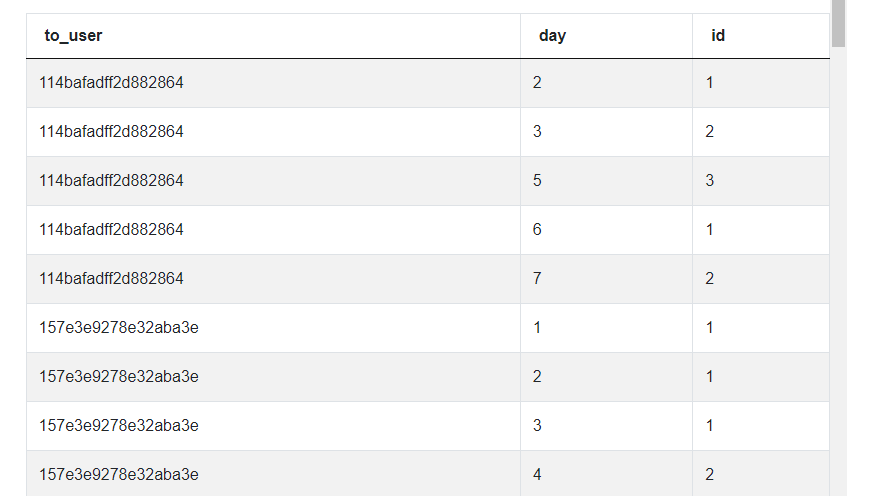
mail_base = google_gmail_emails.groupby(
['to_user', 'day']).size().to_frame('n_emails').reset_index()
We get the following dataset.

We do the same for other dataset, counting the number of user sessions per day. Note: we need to count each user session only once.
location = google_fit_location.groupby(
['user_id', 'day'])['session_id'].nunique().to_frame('total_exercise').reset_index()
Giving us


We now merge the two datasets on user and day
merged = pd.merge(mail_base, location, left_on=['to_user', 'day'], right_on=['user_id', 'day'], how='outer').fillna(0)We can now calculate the correlation using the corr() function. The correlation output will provide the correlation across the two variables. For example a correlation output for two variables x and y will contain something akin to this.


We can need the values across the diagonal (highlighted in green). Therefore, we subset the relevant fields.
result = merged['n_emails'].corr(merged['total_exercise'])Offsetting Data
Another common business case especially with time-series data is finding out their previous or next values. Pandas has capabilities to support these SQL style lag and lead operations. Let's use these methods in practice with a problem from an Uber Data Science Interview.
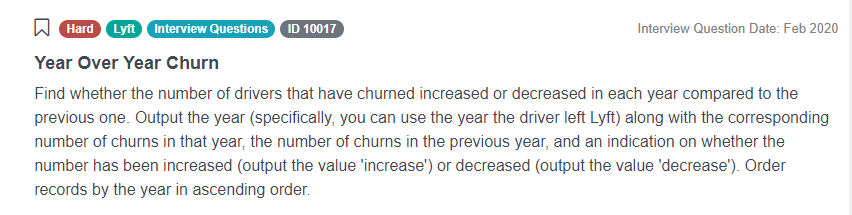
Year Over Year Churn
Calculated the churn of the drivers for each year and report if the number has increased or decreased when compared to the previous year.

You can solve the full https://platform.stratascratch.com/coding/10017-year-over-year-churn
The problem uses the lyft_drivers dataset that has the following fields.
| index | int64 |
| start_date | datetime64[ns] |
| end_date | datetime64[ns] |
| yearly_salary | int64 |
The dataset looks like this.


Approach and Solution
We start off by calculating the churn for each year. To do this, we first calculate the year of the churn from the end_date field and then count the churn for each year.
# Import your libraries
import pandas as pd
# Get the year from exit date
lyft_drivers['year'] = lyft_drivers['end_date'].dt.year
# Get the number of the drivers churned for each year
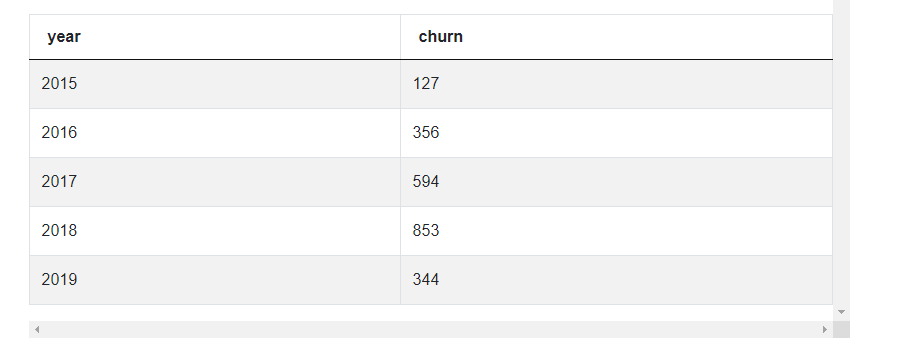
summ_df = lyft_drivers.groupby(by = ['year'], as_index = False).agg
({'index' : 'count'}).sort_values(by = ['year']).rename
(columns = {'index' : 'churn'}).dropna()This gives us the following summary data.

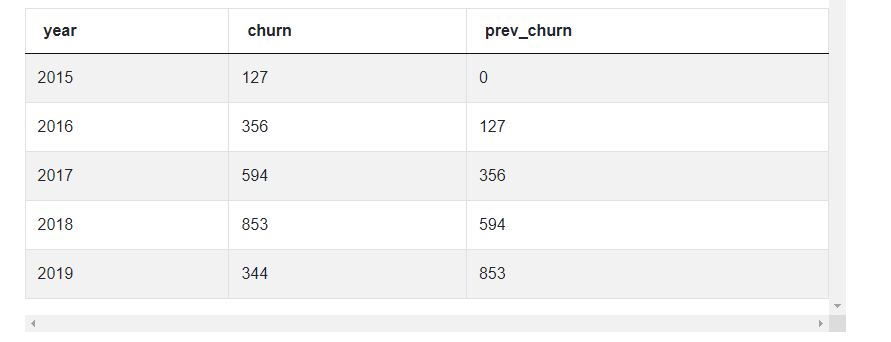
To check if the number has increased or decreased compared to the previous year. For this, we need to offset or shift the values down for the churn numbers. We can accomplish this by using the shift() method. As the name suggests, the shift method offsets the data by n rows. One can also pass the negative number in order to shift the values up.
# Fetch the prev year's churn numbers
summ_df['prev_churn'] = summ_df['churn'].shift(1).fillna(0)
summ_df
We can compare the value with the previous item and determine if the number has increased or decreased.
# Compare the two churn numbers and output the change
summ_df['change'] = summ_df.apply(lambda x: 'increase' if x['churn'] > x['prev_churn'] else('no change' if x['churn'] == x['prev_churn'] else 'decrease'), axis=1)
summ_df
Bonus Python Pandas Interview Questions

We finish off by solving a couple of problems that combine all the things that we have learnt. The first one uses window functions. This one Is from an Amazon Data Science Interview.
Revenue Over Time
Find the three-month moving average for each month.

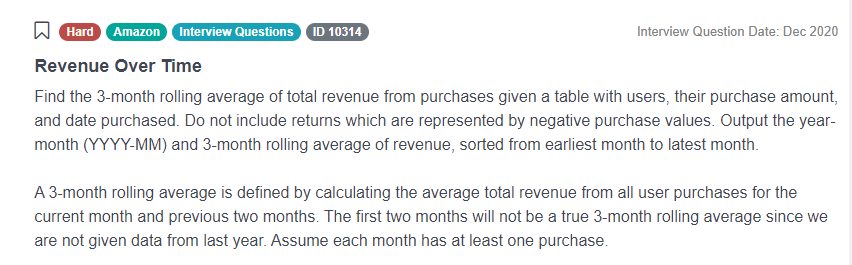
You can try to solve this https://platform.stratascratch.com/coding/10314-revenue-over-time
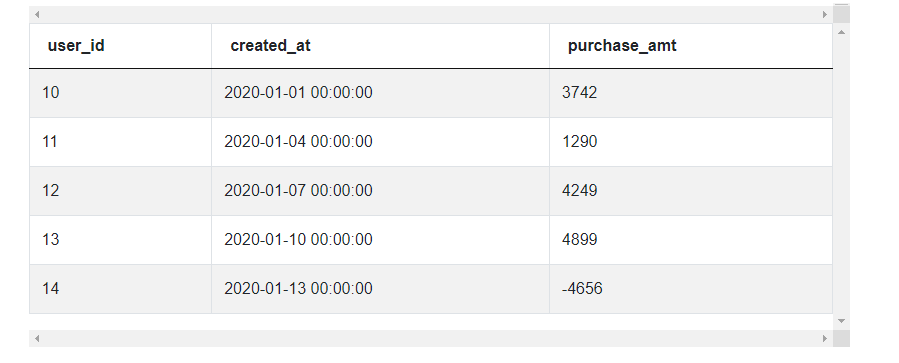
The problem uses the amazon_purchases dataset that has the following fields.
| user_id | int64 |
| created_at | datetime64[ns] |
| purchase_amt | int64 |
The data looks like this.

Approach and Solution
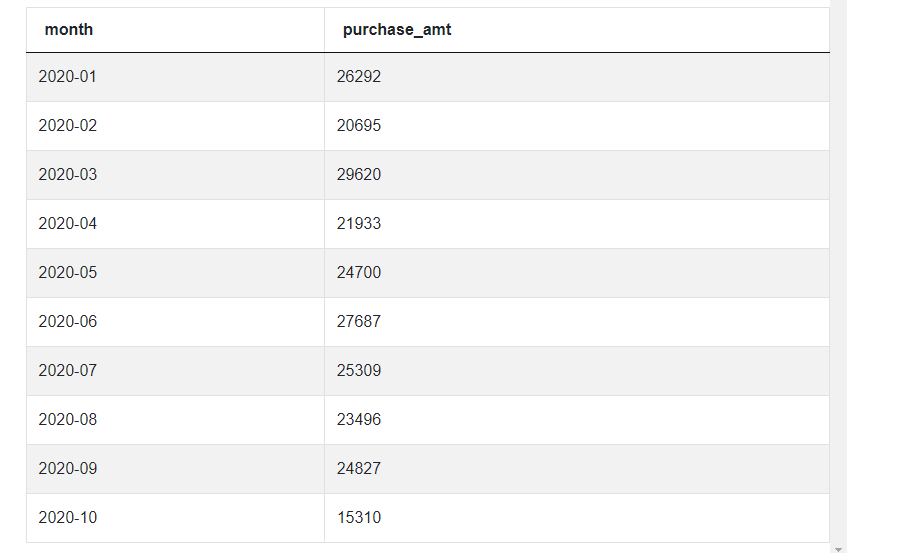
We start off by subsetting the data with relevant transactions. We remove refund transactions as described in the problem. We find the month indicator as required by invoking the strftime method on the created_date field. We further proceed to aggregate the purchase transactions for each month.
# Import your libraries
import pandas as pd

# Remove refund transactions
pos_df = amazon_purchases[amazon_purchases['purchase_amt'] > 0]
# Create Month indicator
pos_df['month'] = pos_df['created_at'].dt.strftime("%Y-%m")
# Aggregate the purchases by month
summ_df = pos_df.groupby(by = ['month'], as_index = False).sum()
[['month', 'purchase_amt']].sort_values(by = ['month'])
To find the moving average, we use the rolling function. The rolling function creates a moving window of n rows. We can change the arguments to get our desired output. Since we do not want the first two observations to return null values, we set the min_periods argument to 1. Finally we invoke the mean() method to calculate average over the three months and return the relevant fields.
# Calculate the rolling average, ensure that the value is calculated
  even for the first two months
summ_df['roll_avg'] = summ_df['purchase_amt'].rolling
(3, min_periods = 1).mean()
# Output relevant fields
summ_df[['month', 'roll_avg']]
This next one is from an Amazon Data Science Interview and uses the apply method in an innovative way.
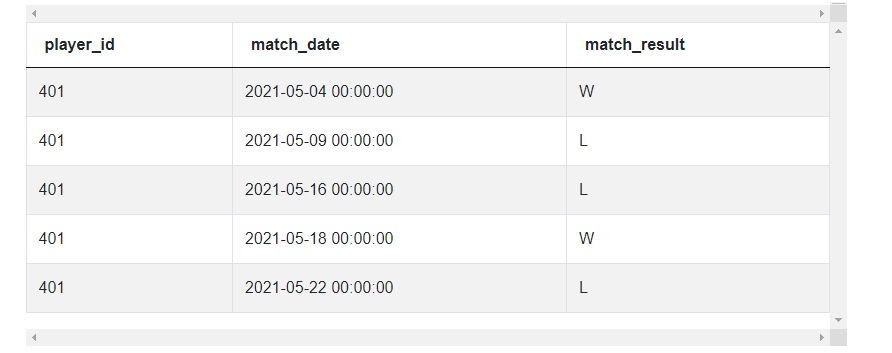
Player with the Longest Streak
A streak is a set of consecutive matches won by a particular player. The streak ends when a player loses their next match. Output the ID(s) of the player(s) with the longest streak and the length of the streak(s).


You can solve this Python Pandas https://platform.stratascratch.com/coding/2059-player-with-longest-streak
This Pandas interview question uses the players_results dataset with the following fields.
| player_id | int64 |
| match_date | datetime64[ns] |
| match_result | object |
The data is presented thus.

Approach and Solution
In order to solve this problem, we need to get the results of a player. Suppose the sequence of results of a player are
WWLWLWWWLWWWWWWWLLLWLWWe can simply split the string by using the letter ‘L’ as the separator. This will split the string into lists. Something like this.
[WW] [W] [WWW] [WWWWWWW] [] [] [] [W] [W].Finally, we find the length of the longest list and we will be able to determine the streak of the player. To do this in Pandas, we need to concatenate the results. To do this, we simply apply the sum() method.
The sum() method should give a total of values when numeric data is passed. But when string type data is passed, it will perform the addition operation. The addition operator in Python will concatenate the strings, which is exactly what we need!!.
We start off by concatenating the results.
# Import your libraries
import pandas as pd

# Create the sequence of results
streak_df = players_results.groupby(by = ['player_id'], as_index = False).agg
({'match_result': 'sum'})

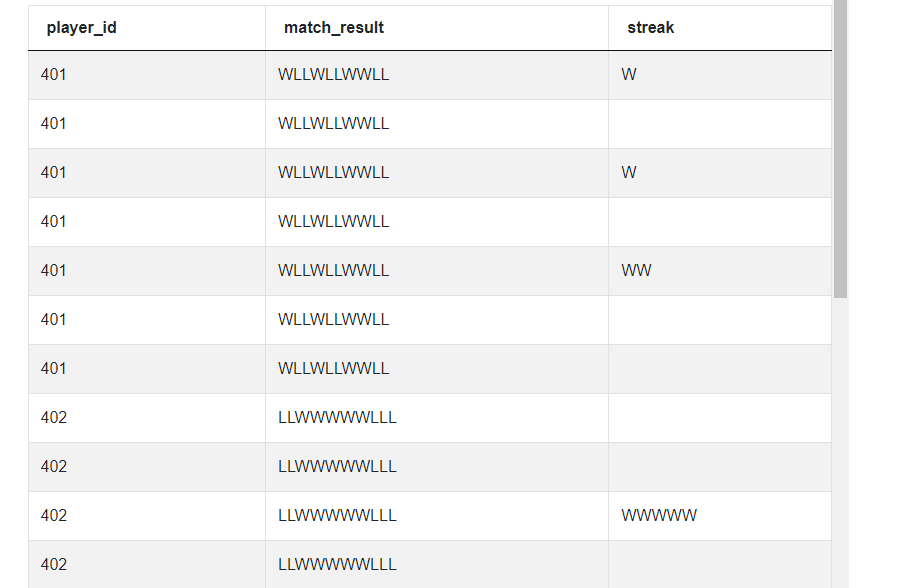
We then proceed to split the match_result string using the letter L as the separator. We also explode the results so that we get each list as a separate row.
# Split the sequence using 'L' as the separator and explode
streak_df['streak'] = streak_df['match_result'].str.split('L')
streak_df = streak_df.explode(column = 'streak')
Now the rest of the problem is straightforward. We simply need to aggregate the maximum length of the streak string and output the relevant fields.
# Find the length of the streak
streak_df['streak_len'] = streak_df['streak'].apply(len)
# Aggregate
streaks_df = streak_df.groupby(by = ['player_id'], as_index = False).agg
({'streak_len' : 'max'})
# Output relevant fields
streaks_df['rank'] = streaks_df['streak_len'].rank(method =
'dense', ascending = False)
streaks_df[streaks_df['rank'] == 1].drop(columns = ['rank'])
Conclusion
In this series of articles, we looked at how to use Pandas and how to solve Python Pandas interview questions. Proficiency in Pandas is expected if one is serious about a career in Data Science with Python as the major tool. Using Pandas is as easy as using spreadsheet software like MS-Excel, Google Sheets, Numbers or LibreOffice Calc. All one needs to gain proficiency in Pandas is a bit of time and curiosity. We have over 700 coding and non-coding problems on the StrataScratch platform that are relevant to Data Science Interviews. These problems have been sourced from the actual Data Science interviews at top companies like Uber, Netflix, Noom, Microsoft, Facebook, et al. Check out our recent post on Python Interview Questions and Answers. On StrataScratch, you will have an opportunity to join a group of 20,000+ like minded data science aspirants and get a collaborative learning experience. Sign up on StrataScratch today and prepare for the most in-demand jobs at big tech firms and start-ups across the world.
Share