Probability and Statistics Questions for Data Science Interviews


Categories:
 Written by:
Vivek Sankaran
How to use Python for solving Probability and Statistics questions for Data Science Interviews.
Data Science is an intersection of Mathematics, Computer Science and Business Expertise. A lot of people dread getting in Data Science because they fear Algebra, Matrices and Combinatorics from High School and College. While there is no running away from those, we can make our lives enjoyable and brush up our Python skills by using the various libraries available in Python for solving Probability and Statistics interview questions that come up so frequently in Data Science interviews.
Python for Probability and Statistics Interview Questions
One of the advantages of Python is the availability of numerous libraries (or packages) for just about everything under the sun. On PyPi we have over 300,000 libraries. Most of them are open-source with their source codes available on GitHub and other online repositories. We will discuss a few that can be used for solving Probability and Statistics interview questions. We will use these libraries largely for three purposes –
- Enumerate the scenarios. While we can list down all possible cases of flipping a coin three times, it might not be possible to check all the cases while drawing three cards from a deck or rolling five dice. We can also visualize the results quickly to help us understand the subject better.
- Calculate exact probabilities. We can cross-check our analytical solutions by using various scientific calculation libraries in Python (SciPy, NumPy, et al) in case solutions are not present or we want to check our workings.
- Simulating scenarios and calculating empirical probabilities. Sometimes it is not possible to exactly calculate values. So, we can conduct trials and find out the observed or empirical probabilities. If we have set up the experiment properly, then as we will observe, the results are surprisingly close to the analytical solution. This is a good way to test if your solution is correct.
The main libraries that we will be using here are -
- itertools: to calculate combinatorics
- Numpy: for fast mathematical calculations and generating random numbers
- SciPy: for analytical calculation of probabilities using built-in distribution functions.
- Matplotlib and Seaborn: to quickly visualize the results.
Areas tested in Probability and Statistics Interview Questions
Broad areas tested in the field of Probability and Statistics for Data Science interview questions include -
- Combinatorics
- Games of Chance for example: rolling a dice, flipping a coin, drawing from a deck of cards
- Conditional Probabilities
- Probability Distributions
- Understanding of basic statistical terms
- Mean, Median, Mode
- Variance, Standard Deviation
- Handling Outliers
- Reading Statistical Plots like histograms, box plots, et al.
The StrataScratch Platform has over 150 such data science interview questions that you can practice and ace your next interview.
Two Out Of Five (Easy)
Find the probability of getting exactly two tails in 5-coin flips?


You can solve this question here: https://platform.stratascratch.com/technical/2283-two-out-of-five
Solution
This is an easy one. Let us look at all possible cases. Each coin toss has two results. And the results will grow out like a tree as shown below.
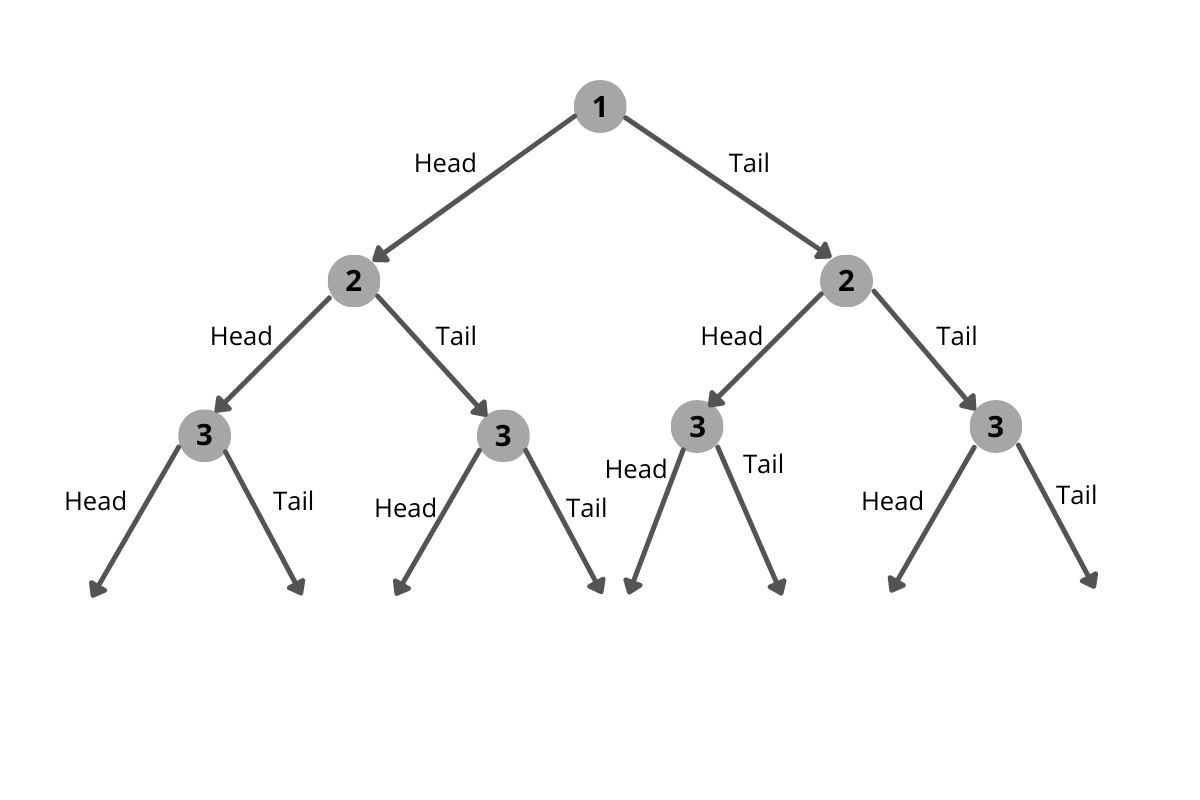
The number of outcomes after n flips of the coin will be 2n. Here we have five tosses, so the total possible outcomes will be 2x2x2x2x2 = 32.
Let us calculate the favorable outcomes. We need to obtain 2 tails. So, some favorable outcomes include H-T-H-T-H, H-T-T-H-H, H-H-T-T-H, etc. But H-T-H-H-H and H-T-H-T-T will not be favorable as we have one and three tails respectively.
Therefore, to get the favorable cases, we need to select two of the five flips that will give show tails. The rest will show heads. This can be done in 5C2 or 10 ways. These are the favorable cases.
Our required probability will be


The Binomial Distribution
These types of Boolean value outcomes viz Heads or Tails, True or False, Yes or No, etc are very common in probability and statistics. These follow a Binomial distribution where the Probability of exactly k successes out of n, is given by


where

and p is the probability of success in each outcome and (1-p) the probability of failure.
In our case, we have n = 5, p = ½ and k = 2. Substituting directly, we get

Let us use Python to calculate these results.
Using itertools
We can use the itertools library to enumerate all the possible cases and the favorable cases. Let us start off with all possible cases. We need to find out all possibilities with five flips of a coin. We can use the product() method in itertools to generate this.
flips_5 = list(itertools.product('HT', repeat = 5))
flips_5[:10][('H', 'H', 'H', 'H', 'H'),
('H', 'H', 'H', 'H', 'T'),
('H', 'H', 'H', 'T', 'H'),
('H', 'H', 'H', 'T', 'T'),
('H', 'H', 'T', 'H', 'H'),
('H', 'H', 'T', 'H', 'T'),
('H', 'H', 'T', 'T', 'H'),
('H', 'H', 'T', 'T', 'T'),
('H', 'T', 'H', 'H', 'H'),
('H', 'T', 'H', 'H', 'T'),
('H', 'T', 'H', 'T', 'H')]We can verify the number of cases by looking at the length of the list.
len(flips_5)32From the flip_5 results, we need to find out the favorable results. So we keep only the results where the number of tails is exactly two. You can use the built-in itertools method – filterfalse() to pass a lambda expression for this.
favorable_flips = [flip_outcome for flip_outcome in flips_5 if
len(list(itertools.filterfalse(lambda x : x !='T', flip_outcome))) == 2]
favorable_flips [('H', 'H', 'H', 'T', 'T'),
('H', 'H', 'T', 'H', 'T'),
('H', 'H', 'T', 'T', 'H'),
('H', 'T', 'H', 'H', 'T'),
('H', 'T', 'H', 'T', 'H'),
('H', 'T', 'T', 'H', 'H'),
('T', 'H', 'H', 'H', 'T'),
('T', 'H', 'H', 'T', 'H'),
('T', 'H', 'T', 'H', 'H'),
('T', 'T', 'H', 'H', 'H')]len(favorable_flips)10We can calculate the probability easily now.
prob_2T_5flips = len(favorable_flips) / len(flips_5)
prob_2T_5flips0.3125Using SciPy
We can use the built-in binomial distribution generator function in SciPy to accomplish the same result.
stats.binom.pmf(k = 2,n = 5, p = 0.5)0.3125Calculating Empirical results using NumPy
If we do not know how to calculate using a formula, one can also try simulating the results over many scenarios. To do this we simulate one million scenarios of flipping five coins. We use the choice() method in NumPy’s random module.
outcomes = np.random.choice(['H', 'T'], (1000000, 5))
outcomes[:10]array([['T', 'T', 'H', 'H', 'H'],
['T', 'H', 'H', 'T', 'H'],
['T', 'T', 'H', 'H', 'H'],
['T', 'H', 'T', 'T', 'T'],
['H', 'H', 'T', 'H', 'H'],
['T', 'H', 'T', 'T', 'H'],
['H', 'H', 'H', 'H', 'T'],
['T', 'T', 'T', 'T', 'H'],
['T', 'H', 'T', 'T', 'H'],
['H', 'H', 'T', 'T', 'H']], dtype='<U1')
The favorable outcomes can now be created by sub-setting only those cases where two tails show up.
fav_outcomes = [outcome for outcome in outcomes if sum(outcome == 'T') == 2]
fav_outcomes[:10][array(['T', 'T', 'H', 'H', 'H'], dtype='<U1'),
array(['T', 'H', 'H', 'T', 'H'], dtype='<U1'),
array(['T', 'T', 'H', 'H', 'H'], dtype='<U1'),
array(['H', 'H', 'T', 'T', 'H'], dtype='<U1'),
array(['H', 'T', 'H', 'T', 'H'], dtype='<U1'),
array(['T', 'H', 'T', 'H', 'H'], dtype='<U1'),
array(['T', 'H', 'H', 'H', 'T'], dtype='<U1'),
array(['H', 'T', 'H', 'H', 'T'], dtype='<U1'),
array(['T', 'H', 'H', 'H', 'T'], dtype='<U1'),
array(['T', 'H', 'H', 'T', 'H'], dtype='<U1')]And the final probabilities can be found as earlier.
len(fav_outcomes) / len(outcomes)0.311937As one can see, we will not get the exact answer, but we can get very close to it.
We can compare all the scenarios (No Tails, Exactly one tail, etc) with the exact answer obtained using SciPy. We get this.
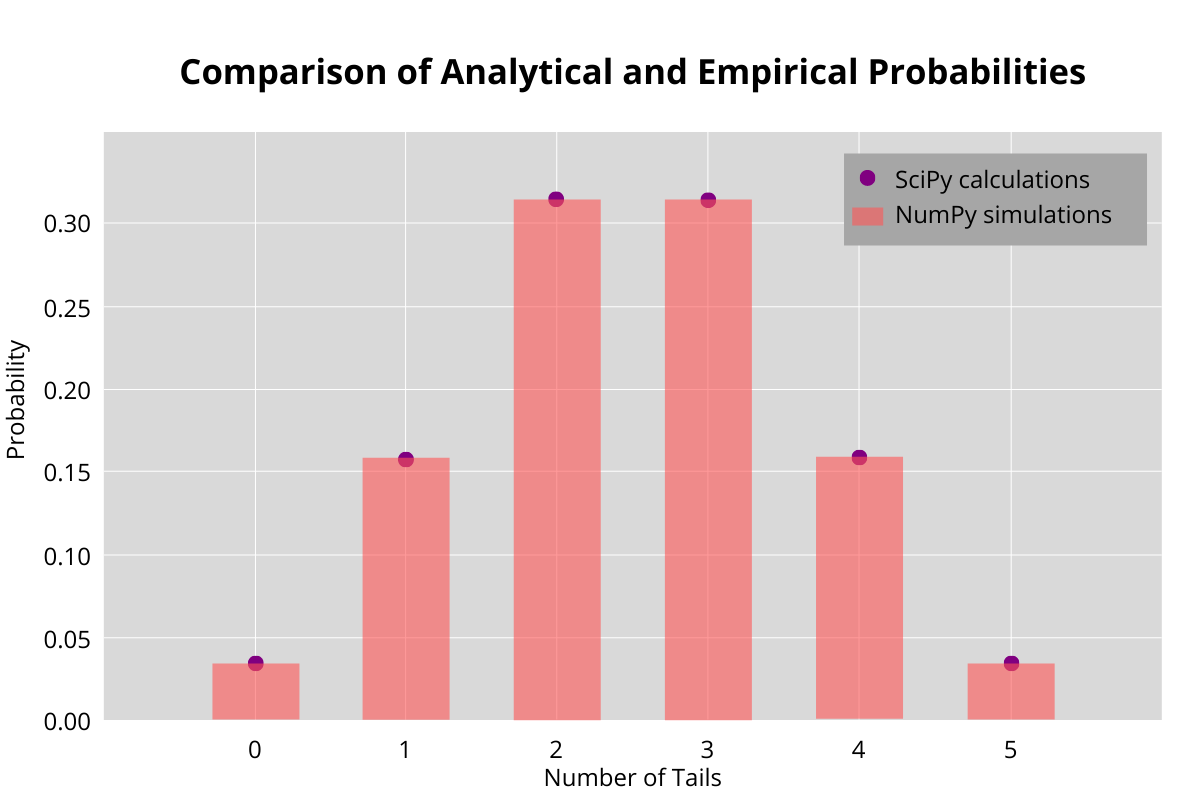
The empirical probabilities are very close to the analytically calculated values. Let us move to a more complex problem.
Different Card (Medium)
Find the probability of drawing two cards that belong to different colors or different shapes (suits) from a shuffled deck of 52 cards?


You can solve this question here: https://platform.stratascratch.com/technical/2001-different-card
Solution
Let us identify all possible cases. We must draw two cards one after the other. So, the number of possible cases will be 52P2 = 52 * 51 = 2652
Let us identify the favorable cases now. We need two cards that are not of the same color or shape (suit). Therefore, we cannot draw two spades or two hearts. But we can draw a club and a spade or a heart and a diamond because even though the colors are the same, the suits are different. While it is not too difficult to calculate the number of favorable cases directly, in many cases (including this one) that involve combinatorics and probabilities, it is easier to calculate the unfavorable cases and then subtract it from the total number of cases to get the number of favorable cases.
What are our unfavorable cases? Let us negate our favorable cases.
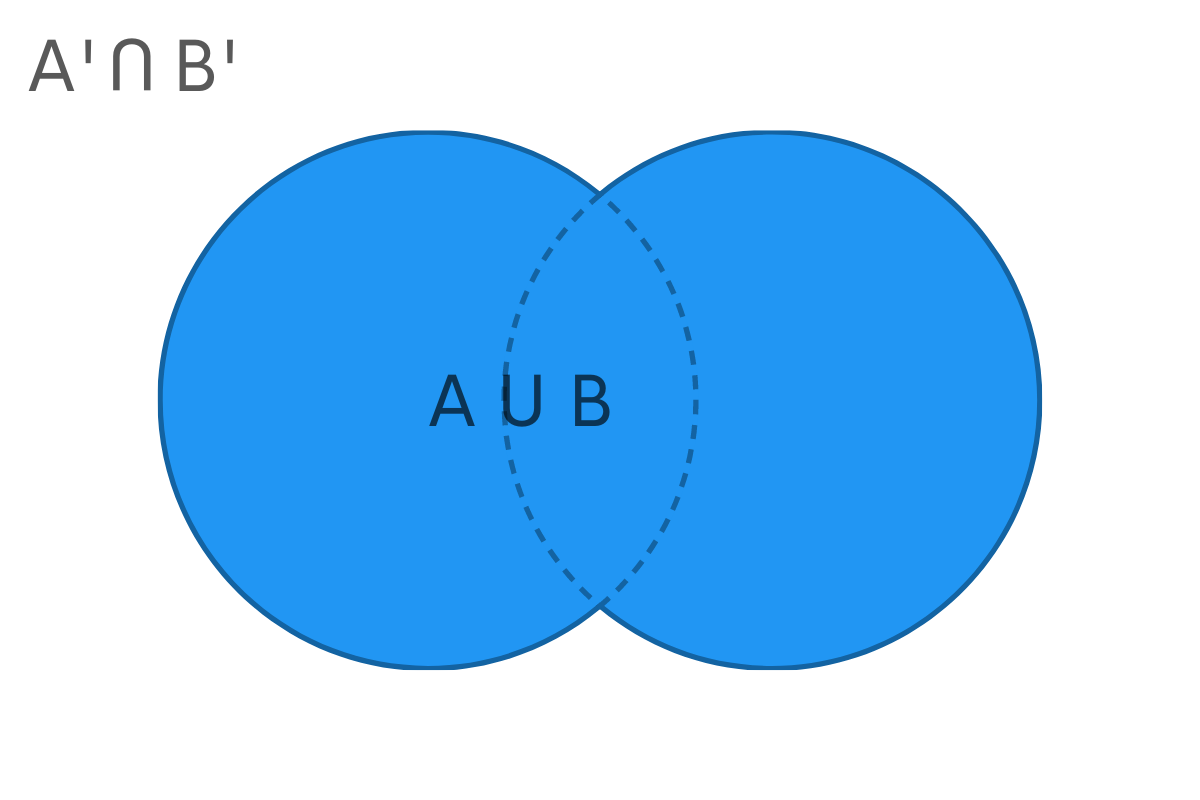
Unfavorable cases = Not (Two cards are not of the same color or shape)From Boolean Algebra, Not (A Or B) results in Neither A nor B. This can be seen from the below Venn Diagram.
Not (Two cards are not of the same color or shape) can be written as
Not (Two cards are not of the same color) and Not (Two cards are not of the same shape)
Resolving the double negations, we get
Unfavorable cases = Two cards are of the same color and of the same suit.
Which simply resolves to Two cards of the same suit. (Since any two cards of the same suit have to be of the same color)
Now we can easily calculate this.
First, we find a suit which will match This can be done in 4C1 = 4 ways.
Then we draw two cards from this suit. Each suit has 13 cards. Therefore, the number of ways will be 13P2 = 156 ways.
Combining the two, number of unfavorable cases = 4 x 156 = 624
Hence, the number of favorable cases will be 2652 – 624 = 2028 ways.
Probability = 2028 / 2652 = 13 / 17
Alternative Method:
We will have a match only after the second card is drawn. That decides whether it is a match or not. After we have drawn any card from the deck, there will be 51 cards left. Of these 51 cards, have 12 cards that belong to the same suit of the card we have already drawn. We need to avoid these 12 cards.
So, number of favorable cases = 51 -12 = 39 and all possible cases = 51
Hence, the probability = 39 / 51 = 13 / 17
Solving using Python
Exact calculation:
Using itertools, we first simulate a deck.
suits = ['S', 'C', 'D', 'H']
ranks = [2, 3 ,4, 5, 6, 7, 8, 9 , 'T', 'J', 'Q', 'K' , 'A']
cards = [str(rank) + suit for suit in suits for rank in ranks]
cards[:20]['2S',
'3S',
'4S',
'5S',
'6S',
'7S',
'8S',
'9S',
'TS',
'JS',
'QS',
'KS',
'AS',
'2C',
'3C',
'4C',
'5C',
'6C',
'7C',
'8C']len(cards)52Let us draw two cards out of these 52 cards. For this we will use the permutations() method.
outcomes = list(itertools.permutations(cards, 2))
len(outcomes)2652This is the same number that we got from our analytical calculations. Now we can calculate the unfavorable outcomes
unfavorable_cases = len(list(itertools.permutations(suits, 1))) *
len(list(itertools.permutations(ranks, 2)))
unfavorable_cases624We can now calculate the probability as earlier.
probability = 1 - unfavorable_cases / len(outcomes)
probability0.7647058823529411Simulating using NumPy
Let us draw two cards from a deck one million times.
any_two_cards = np.random.choice(cards, (1000000,2))
any_two_cards[:10]array([['QC', '3D'],
['5C', 'JS'],
['3H', 'AH'],
['KS', '6C'],
['7S', '5C'],
['KC', 'KS'],
['4S', '3D'],
['4S', 'TD'],
['5H', '8D'],
['5C', '8S']], dtype='<U2')Calculate the unfavorable cases where the suits (the last characters of the card string match
unfavorable_cases = [selection for selection in any_two_cards if
(selection[0][-1] == selection[-1][-1]) ]
unfavorable_cases[:10][array(['3H', 'AH'], dtype='<U2'),
array(['TC', '5C'], dtype='<U2'),
array(['QH', '6H'], dtype='<U2'),
array(['9C', 'TC'], dtype='<U2'),
array(['4S', '8S'], dtype='<U2'),
array(['8D', '9D'], dtype='<U2'),
array(['7C', '7C'], dtype='<U2'),
array(['9D', 'AD'], dtype='<U2'),
array(['QD', 'QD'], dtype='<U2'),
array(['AD', '8D'], dtype='<U2')]And finally we can calculate the probability as earlier.
emp_probability = 1 - (len(unfavorable_cases) / len(any_two_cards))
emp_probability0.749957Again, close to the actual answer. Let us try a hard one to finish things off.
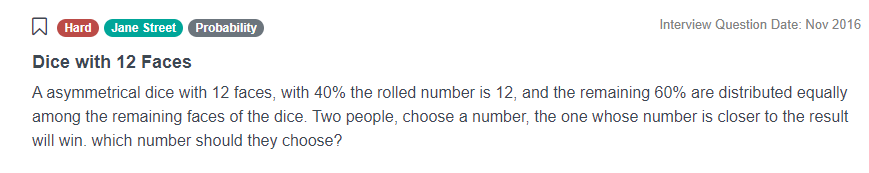
Dice with 12 Faces (Hard)
A loaded die with 12 faces has a 40% probability of getting a 12. The remaining 60% are distributed equally among the remaining faces of the dice. Two people each choose two different numbers. The one whose number is closer to the actual die roll will win. Which number should they choose?

You can solve this question here: https://platform.stratascratch.com/technical/2280-dice-with-12-faces
This is an excellent question to test your understanding of probabilities. This also involves some game theory. To solve this, let us take a normal fair die with six faces numbered 1 to 6. Our aim is to choose a number that maximizes our chances of winning. We win if the number on the die roll is closer to the number that we chose compared to that of our opponent. We also need to consider the actions of our opponent, since the outcome depends on her choice as well.
Let us assume that we chose the number 6. Our opponent has five choices left (from 1 to 5). She is equally competent as we are, so she will try to maximize her chances. Let us see what the scenarios are.

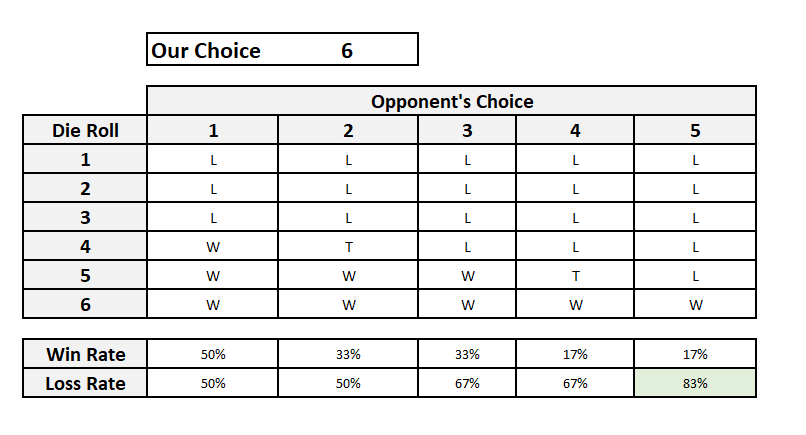
The best choice for our opponent will be to choose 5, since in that case she wins 5 out of 6 times.
Let us pick 5. Our opponent’s choices now are (1,2,3,4 and 6). Let us plot the scenarios.

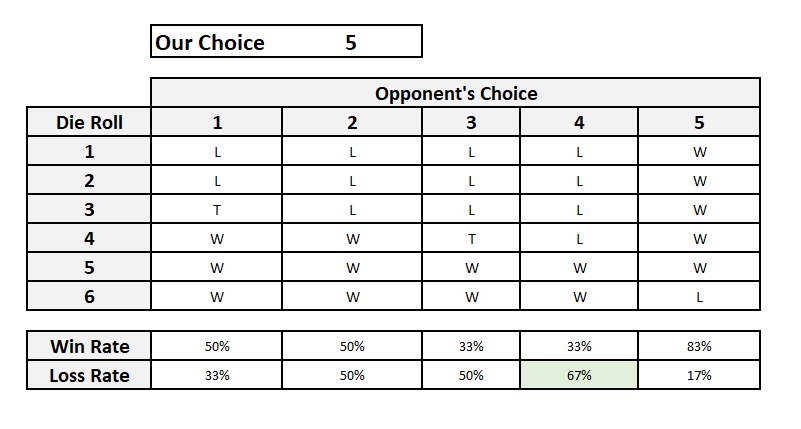
Our chances have improved compared to the earlier case. Now the best choice for our opponent is 4 where she wins two in three times. Let us see what happens if we pick 4. Our opponent’s choices are now (1,2,3, 5 and 6). And the scenarios are.

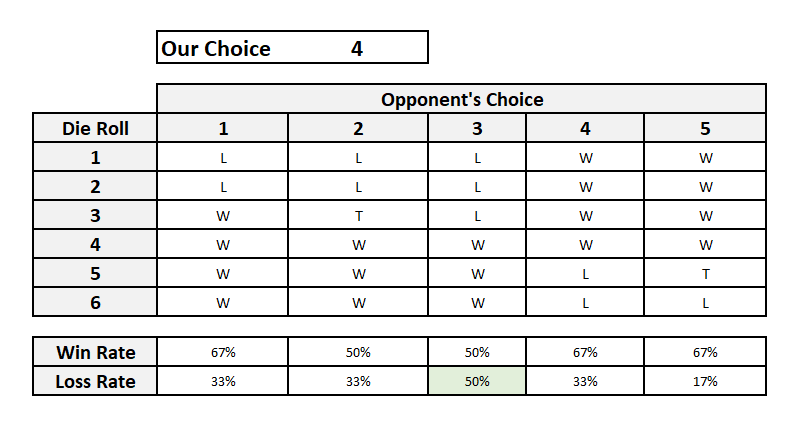
This is even better for us since we have at least an even chance of winning each time. The best choice for our opponent is now 3 where it is a coin toss on who wins.
The remaining three choices 3, 2 and 1 will be mirror images of 4, 5 and 6. So what did we learn for this?
- Our chances improve as we move towards the middle. This happens because we are leaving fewer numbers than our opponent where she has an advantage. When we were in the corner (1 or 6), our opponent had the full run of the choices. But when we move towards the center, we are forcing her to pick a side and leave the other side to us. A greater number of die rolls are now favorable to us.
- The best choice for our opponent will be to pick a number closest to ours and on the side that has greater numbers. If the opponent leaves a gap between our choice and her choice, then the number in the gap can be contested by both of us, for example when she chooses 2 and we choose 4, then 3 results in a tie. Worse, if she chooses 1 and we choose 4, she loses when 3 comes up.
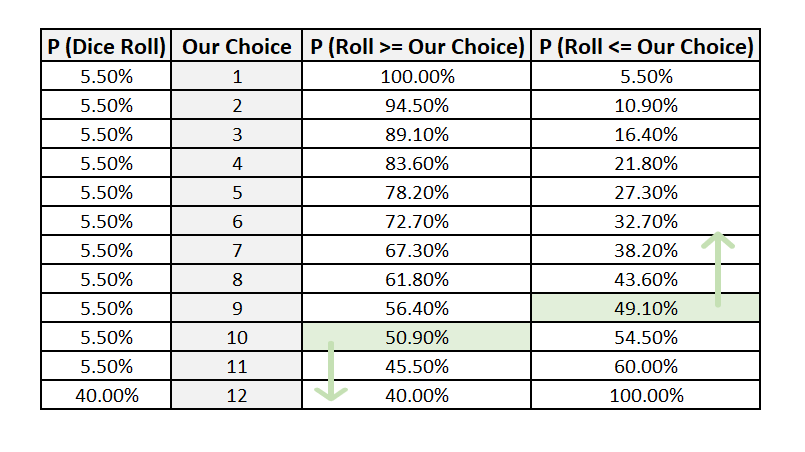
Let us look at the mathematics behind it. The table below shows the probabilities on both sides of our choice. As discussed above, we need to optimize both sides of our choice.

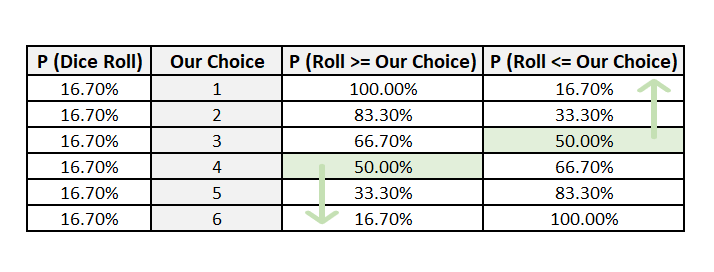
When we optimize for only one side, our opponent can bet on the other side with a greater chance of winning. Therefore, the most optimum choice for us as well our opponent will be 3 and 4. This loosely follows Hotelling’s law on location of shops and push carts.
Now that we know what to calculate, we can now extend this to our loaded die.
Our aim is to maximize our chances bearing in mind our opponent’s actions. So we try to cover both flanks as much as possible.

If we choose 9, then our opponent can choose 8 betting that the roll of the dice will be lower or 10 betting the dice will be higher. 10 is a better option. Moreover, the chance of getting a roll of 9 and below is lesser than the chances of getting 10 and above. So this is not the optimal choice. If we choose 10, then the best that our opponent can do is 9, reversing the previous scenario.
Hence, 10 is the best choice for us and 9 for our opponent.
Let us try to solve this problem by simulating it in Python.
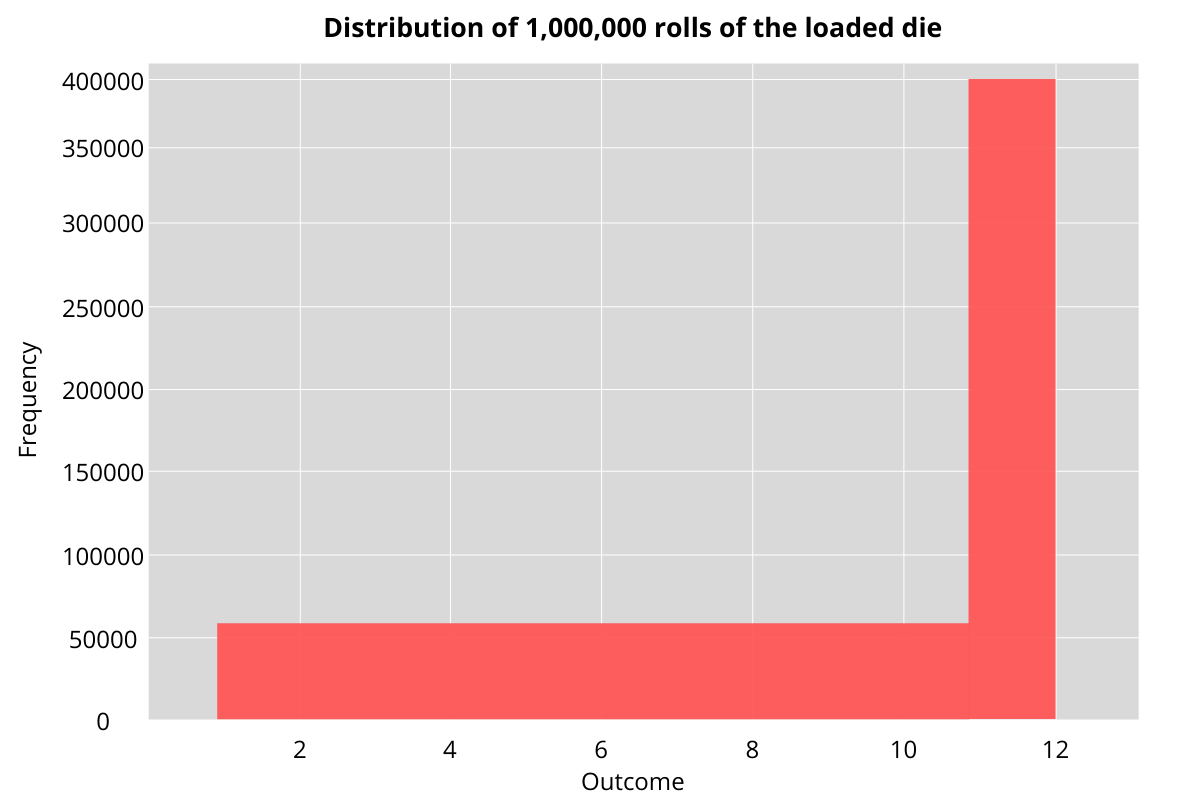
We start off by simulating the dice by passing the probabilities. We look at one million rolls of this die. As the figure below shows, the probability of getting a 12 is 40% with the rest distributed evenly.
outcomes = np.random.choice(np.arange(1,13), size = 1000000, p =
np.array([0.6/11] * 11 + [0.4]))
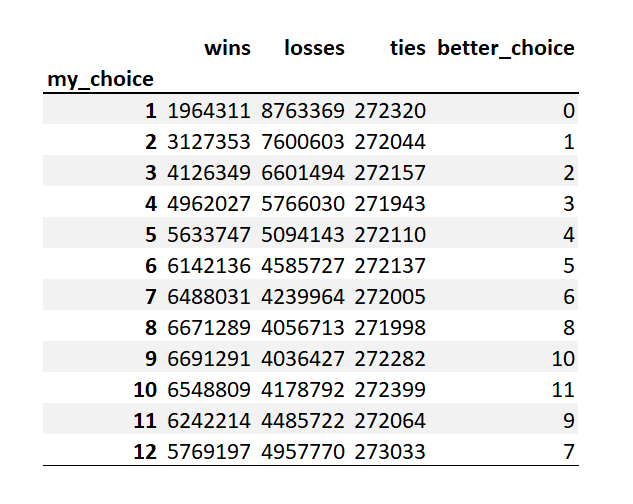
Now we formulate our choice and our opponent’s choice and calculate the outcomes based for each set of choice. Finally, we find out in how many of the cases are our choices better than that of our opponent. As we can see, when we choose 10, then in each of the 11 other choices that our opponent has we have better chances of winning.
choices = list(itertools.permutations(np.arange(1,13), 2))
results = []
for choice in choices:
    wins = (abs(outcomes - choice[0] ) < abs(outcomes - choice[1] )).sum()
    losses = (abs(outcomes - choice[0] ) > abs(outcomes - choice[1] )).sum()
    ties =  (abs(outcomes - choice[0] ) == abs(outcomes - choice[1] )).sum()
    results.append([choice[0], choice[1], wins, losses, ties])

results_df = pd.DataFrame(results, columns = ['my_choice', 'opp_choice',
'wins', 'losses', 'ties'])
results_df['better_choice'] = results_df['wins'] > results_df['losses']
results_df

summ_df = results_df[['my_choice', 'wins', 'losses', 'ties',
'better_choice']].groupby(by = ['my_choice']).sum()
summ_df
You can view the entire notebook used for generating these statistics and visualizations here.
Check out our comprehensive statistics cheat sheet for important terms and equations for statistics and probability
Conclusion
In this article, we showed you how to use libraries in Python to help solve Probability and Statistics questions for Data Science Interviews. We solved the questions by listing out all the cases, using the probability distribution functions to calculate the exact analytical solution and simulating scenarios to approximate the solution.
Mastering these libraries is bare essential to getting a Data Science job that involves Python. With sufficient practice, you can become proficient in using these libraries and many others. Join StrataScratch today and compete and collaborate with over 20,000 other aspiring data scientists working towards achieving their dream job at top tech companies and hottest start-ups across the world.
Share