NumPy Concatenate(): Efficient Array Manipulation in Python


 Written by:
Nathan Rosidi
Mastering advanced techniques in data manipulation with NumPy through comprehensive understanding and application of array concatenation methods.
NumPy is a cornerstone of the Python data science ecosystem, renowned for its powerful array manipulation capabilities. One of the most potent functions in NumPy is the ability to combine different datasets.
If we compare a data scientist to a chef, using concatenate is akin to blending various ingredients to create a delicious meal. A skilled chef knows there is more than one way to prepare the perfect dish.
In this article, we will explore various techniques, beginning with basic array operations and progressing to more advanced analyses. We'll achieve this by using concatenate in diverse ways. Let's start with the fundamentals!
Understanding the Basics of NumPy Arrays

Let’s start with the basics.
What is a NumPy array in Python?
A NumPy array in Python is like a different version of a list. It's a collection of elements, that you can do math on very easily and quickly. Unlike regular lists in Python, elements in a NumPy array are all of the same type, which makes calculations faster and more efficient.
Let’s create a simple array by using NumPy.
# Creating a simple NumPy array
array_example = np.array([1, 2, 3, 4, 5])
print("NumPy Array:", array_example)
Here is the output.


Here, we've made a basic one-dimensional array. Simple, right?
Basic Array Operations
Basic operations with arrays are straightforward. Let's say you're analyzing daily temperatures. Adding, subtracting, multiplying, and dividing numbers in an array is as easy as it sounds.
Let’s see the code.
# Basic operations on NumPy arrays
temperatures = np.array([20, 22, 24, 26, 28])

# Add 2 to each element
temperatures_plus_two = temperatures + 2
print("Temperatures + 2:", temperatures_plus_two)

# Multiply each element by 2
temperatures_doubled = temperatures * 2
print("Temperatures * 2:", temperatures_doubled)
Here is the output.

In our example, we added 2 to each temperature and then doubled them. This shows how NumPy makes data manipulation efficient and intuitive.
NumPy concatenate() Function


Now, we have a basic knowledge of what is NumPy array and how it works, now we can use NumPy concatenate function.
What is the NumPy concatenate() Function?
NumPy concatenate function is used to combine two arrays together. Let’s see an example.
# Concatenating two arrays
array_one = np.array([1, 2, 3])
array_two = np.array([4, 5, 6])

concatenated_array = np.concatenate((array_one, array_two))
print("Concatenated Array:", concatenated_array)
Here is the output.

In this example, we've merged two arrays into one.
Parameters of NumPy concatenate() function
The NumPy concatenate() function primarily takes two parameters: the sequence of arrays to join and the axis along which to join them.
Here's a brief overview of all its parameters:
- a1, a2, ...: These are the arrays you want to join together.
- axis: If you don't specify anything, it defaults to 0, which means it will stack the arrays vertically.
- out: If you provide an array here, NumPy will place the result into this array instead of creating a new one.
- dtype: This optional parameter lets you specify the data type of the resulting array.
- casting: This optional parameter controls how NumPy should handle the casting of types during the concatenation.
If you want to know more about parameters of concatenate(), here is the official documentation link.
NumPy Concatenating Arrays with Different Dimensions
In real-world data science applications, it's common to see the situations where we need to concatenate arrays that have different dimensions. Let's explore how we can efficiently combine such arrays.
Consider a scenario in a financial or health dataset where you have a main set of data and an additional set of features that you want to integrate. These arrays might have different dimensions, but you need to combine them for comprehensive analysis.
For starters, let’s use simple exercise. Here is the code, which creates two different array’s and at the end, we will vertically stack one array on top of other.
# Example of Concatenating Arrays with Different Dimensions
import numpy as np

# Creating a 1D array (e.g., a new feature column)
array_1d = np.array([7, 8, 9])

# Creating a 2D array (e.g., the main dataset)
array_2d = np.array([[1, 2, 3], [4, 5, 6]])

# Vertically stacking the 1D array on top of the 2D array
vstacked_array = np.vstack((array_1d, array_2d))
print("Vertically Stacked Array:\n", vstacked_array)
Here is the output.

If you feel that you need to improve your python skills too, here you can start from these python interview questions.
Concatenating Arrays Along a Specific Axis
Now let’s do more complicated example, which concatenating array along a specific axis. To do that, we will use world happiness report from Kaggle, you can find the dataset here.
The World Happiness Report from Kaggle shows how happy people are in different countries. It uses scores based on things like money, health, and freedom. The data helps us see which countries are happier.
Let's start by identifying European countries, adding the "Year" column. We'll focus on a few columns like 'Country or region', 'Score', 'GDP per capita', and 'Healthy life expectancy' to observe trends over the years.
# Adding 'Year' column to each dataset
data_2017['Year'] = 2017
data_2018['Year'] = 2018
data_2019['Year'] = 2019

# List of European countries (a representative sample for demonstration)
european_countries = [
    "Norway", "Denmark", "Iceland", "Switzerland", "Finland",
    "Netherlands", "Sweden", "Austria", "Luxembourg", "Germany"
]

# Filtering each dataset for European countries and selecting specific columns
data_2017_europe = data_2017[data_2017['Country or region'].isin(european_countries)][
    ['Country or region', 'Year', 'Score', 'GDP per capita', 'Healthy life expectancy']
]
data_2018_europe = data_2018[data_2018['Country or region'].isin(european_countries)][
    ['Country or region', 'Year', 'Score', 'GDP per capita', 'Healthy life expectancy']
]
data_2019_europe = data_2019[data_2019['Country or region'].isin(european_countries)][
    ['Country or region', 'Year', 'Score', 'GDP per capita', 'Healthy life expectancy']
]
Next, we will concatenate the filtered datasets to combine them into a single DataFrame. To do that, first we will turn our datasets for each years into values, to be able to concatenate them by using numpy afterwards.
And at the end, we will turn the arrays to the pandas datafame, and add column names to see at the end our data, in dataframe format. Here is the code.
data_2017_europe_np = data_2017_europe.values
data_2018_europe_np = data_2018_europe.values
data_2019_europe_np = data_2019_europe.values

# Concatenate the arrays along axis 0 (rows)
european_data_concatenated_np = np.concatenate([data_2017_europe_np, data_2018_europe_np, data_2019_europe_np], axis=0)

# If you need to convert it back to a DataFrame:
european_data_concatenated_df = pd.DataFrame(european_data_concatenated_np, columns=['Country or region', 'Year', 'Score', 'GDP per capita', 'Healthy life expectancy'])
Now, let’s see our dataframes first rows.
european_data_concatenated_df.head()Here is the output.


Great, but don’t forget, we did 3 different years.
Let’s visualize the output to evaluate the result better. Here is the code:
import matplotlib.pyplot as plt
import seaborn as sns

# Setting the style
sns.set(style="whitegrid")

# Creating a bar chart
plt.figure(figsize=(15, 10))

# Plotting
sns.barplot(x="Country or region", y="Score", hue="Year", data=european_data_concatenated_df, palette="muted")

# Adding titles and labels
plt.title("Happiness Score by Country and Year in Europe", fontsize=16)
plt.xlabel("Country", fontsize=14)
plt.ylabel("Happiness Score", fontsize=14)
plt.xticks(rotation=45)
plt.legend(title="Year")

# Show the plot
plt.show()
Here is the output.


Concatenating Arrays Horizontally
Let’s use happiness dataset that we mentioned before.
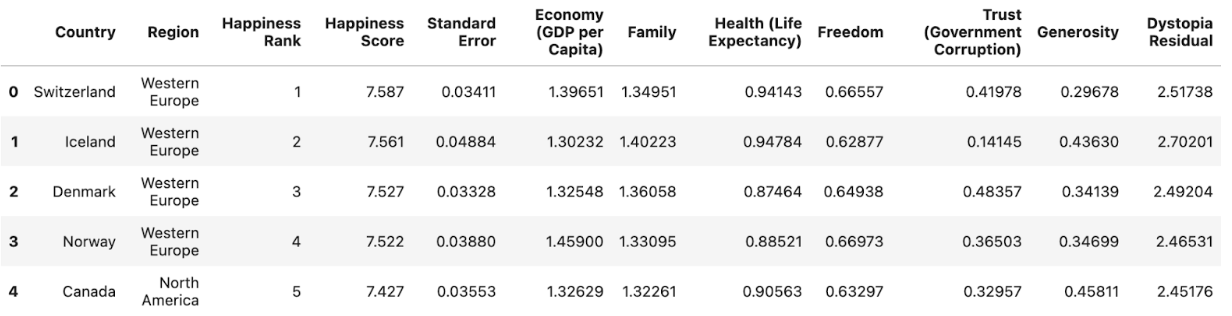
Let’s see 2015’s dataset for you to see. Here is the code:
import pandas as pd
Import numpy as np

# Load data
data_2015 = pd.read_csv('2015.csv')
data.2015.head()
Here is the output.

With the World Happiness Report data for different years, let's say we want to compare the happiness scores of countries across two consecutive years this time.
We can do this by concatenating the datasets horizontally. This is like putting two yearly reports, 2015 and 2016, side by side to see changes over time.
In the code below, first we select relevant data from two different datasets and turn these dataframes into NumPy arrays, by using values() method. At the end we will horizontally concatenate them into single big arrays and convert back to dataframe to see the result.
import numpy as np
import pandas as pd

# Load data
data_2015 = pd.read_csv('2015.csv')
data_2016 = pd.read_csv('2016.csv')

# Selecting relevant columns and adding year to column name
data_2015_selected = data_2015[['Country', 'Happiness Score']].head(100)
data_2015_selected.rename(columns={'Happiness Score': 'Happiness Score 2015'}, inplace=True)

data_2016_selected = data_2016[['Country', 'Happiness Score']].head(100)
data_2016_selected.rename(columns={'Happiness Score': 'Happiness Score 2016'}, inplace=True)

# Convert the selected columns to NumPy arrays
data_2015_np = data_2015_selected.values
data_2016_np = data_2016_selected.values

# Horizontally concatenate the arrays
concatenated_horizontally_np = np.hstack([data_2015_np, data_2016_np])

# Convert back to DataFrame, if needed
concatenated_horizontally_df = pd.DataFrame(concatenated_horizontally_np, columns=['Country 2015', 'Happiness Score 2015', 'Country 2016', 'Happiness Score 2016'])
Now, let’s see first few rows of our dataframe.
# Display the first few rows of the concatenated DataFrame
concatenated_horizontally_df.head()
Here is the output.


In this code, we merge the 2015 and 2016 happiness data side by side, horizontally. It helps to visually compare how each country's happiness score changed from one year to the next.
Concatenating Arrays Vertically
You can find Tesla stock data on Kaggle, for example, this one shows between 2010 to 2020.
To demonstrate concatenating vertically, we are now using two distinct datasets of Tesla stock data, representing different time periods: 2012-2013 and 2014-2015.
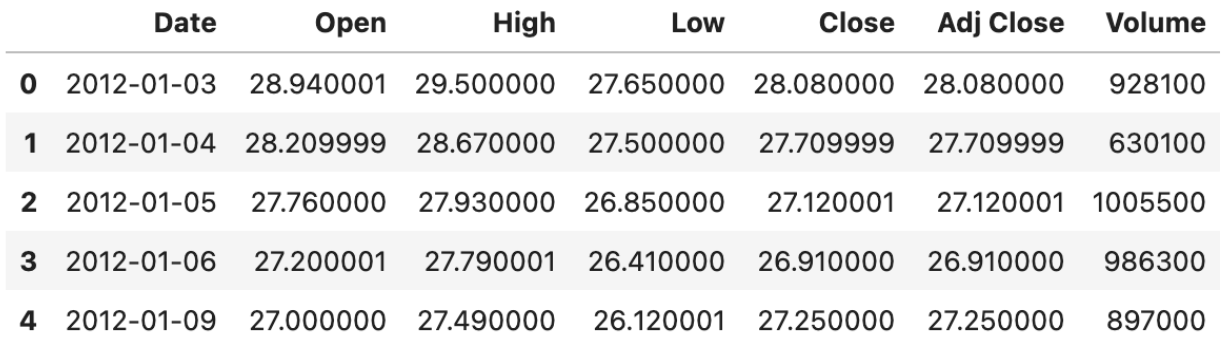
Here is our first dataset. Let’s see the code.
tesla_data_2012_2013.head()Here is the output.

Here is our second dataset. Let’s see the code.
tesla_data_2014_2015.head()Here is the output.


Now let’s concatenate two datasets of Tesla stock data from different times into one big set using NumPy.
This way of putting data together is good for looking at trends over a long time. It helps us see how Tesla's stock did over many years, which is important for understanding its financial performance.
Of course to do that first, we will convert dataframe to arrays, concatenate, then convert back to the dataframe, here is the code:
# Convert DataFrames to NumPy arrays
tesla_data_2012_2013_np = tesla_data_2012_2013.values
tesla_data_2014_2015_np = tesla_data_2014_2015.values

# Vertically concatenate the arrays
concatenated_vertically_tesla_np = np.vstack([tesla_data_2012_2013_np, tesla_data_2014_2015_np])

# Optionally, convert back to DataFrame
concatenated_vertically_tesla_df = pd.DataFrame(concatenated_vertically_tesla_np, columns=tesla_data_2012_2013.columns)

# Display the head of the concatenated DataFrame
print(concatenated_vertically_tesla_df.head())
Here is the output.

Before finishing the article, if you want to test your NumPy knowledge, check out these NumPy interview questions.
Bonus: Using NumPy Concatenate() instead of Pandas concat()

Sometimes, working with arrays provides more flexibility and speed. So, if your project includes using Pandas' concat(), you might consider using NumPy's concatenate() first.
To do that, first thing you must do is changing format of your data, like in this data project from our platform, Laptop Price Prediction.


As you can see, your task will be to define and train a machine learning model to predict laptop price. To do that, there are several times you must use pa ndas concat function, like combining dataframes at first.
import numpy as np
import pandas as pd

# Convert the selected columns to NumPy arrays
data_2015_np = data__selected.values
data_2016_np = data__selected.values
Then pick your position, and concatenate your arrays, according to your wishes. But before everything, don’t forget to convert it to dataframe too.
concatenated_df = pd.DataFrame(concatenated_df_np, columns=concatenated_df_np.columns)Just like in the above example you can repeat same actions, for this data project too.


For this data project, we need a model to predict how many interactions a property gets over time.
For any data project you choose, converting pandas to arrays will provide the flexibility and speed you need. It's a rare but powerful technique.
Final Thoughts
In this article, we went into the features of NumPy concatenate() function, exploring how it can blend different datasets.
Remember, just like in cooking, practice is key in data science; using tools like NumPy's concatenate() in various scenarios will sharpen your skills. We invite you to join StrataScratch platform, where you can take your data science journey to the next level, tackling real-world projects and interview questions that will prepare you for an exciting career in this field.
Don't miss this chance to grow – explore the platform today!
Share