Noom Data Analyst Interview Question

Categories:
 Written by:
Nathan Rosidi
Noom helps you lose weight. We help you get a job at Noom. In today’s article, we’ll show you one of Noom’s hard SQL interview questions.
We’re getting into the habit of choosing the hard data analyst interview questions for you. That’s probably not bad. If you manage to get through these questions, then the medium and easy level questions will be a piece of cake for you.
A piece of cake we’re not discouraging you from eating. That’s Noom’s business as a fitness and weight loss subscription-based app. Our mission here is to make you fit but only in terms of your SQL coding skills.
The interview we will cover is an excellent example of using JOINs and aggregate functions in a more advanced way, which includes writing subqueries.
We’ll go through all the explanations step-by-step to make them easy to understand. If things get too complicated, you can always help yourself with our video tutorial that tackles the same question.
Noom Data Analyst Interview Question
Here’s the question we’ll show you how to answer:
Find The Most Profitable Location
Last Updated: April 2021
Find the most profitable location. Write a query that calculates the average signup duration in days and the average transaction amount for each location. Then, calculate the ratio of average transaction amount to average duration.
Your output should include the location, average signup duration (in days), average transaction amount, and the ratio. Sort the results by ratio in descending order.
Link to the question: https://platform.stratascratch.com/coding/2033-find-the-most-profitable-location
To find the most profitable location, the business wants to compare the average sign-up duration and the average transaction amount for each location by taking a ratio between the two.
They expect you to provide a table outlining each location, the average duration, average transaction amount, and ratio. The result should be sorted from the highest ratio to the lowest.
Now, it wouldn’t be wise to just jump to writing a code and hope you’ll get to the solution somehow. Strategy is important, the same as your SQL knowledge. The strategy here includes a framework for solving this and other SQL data analyst interview questions.
Solution Approach Framework to Solve (Noom) Data Analyst Interview Question

We will use the three-step framework that will help you to take a complex problem and simplify it into few steps. If you’re our regular reader, you’re probably familiar with it.
For those of you who are new to this or need a refresher, the three steps are:
- Exploring the dataset
- Writing out the approach
- Coding the solution
First, you need to understand the dataset. This means understanding columns in the tables, their data types, and what the data really represents. Also, watch out for the traps hidden in data which could lead to considering the edge cases when writing the solution.
When you’re done with this step, you should outline the steps you will take to solve the problem. No, you’re not coding yet! You’re only writing out your approach as sentences or pseudo code. What you do here is create a skeleton for your solution, and the code will add flesh to it.
And the last step you probably hardly waited for is: start coding!
It’s time that we showed you how this framework works on the Noom data analyst interview question.
1. Exploring the Dataset
You’re given two tables: signups and transactions.
The first table is a record of the sign-ups and has the following columns.
Some of the important things to note are:
- column signup_id – we will assume this is the table’s primary key
- columns signup_start_date and signup_stop_date – formatted as datetime
- column plan_id – represents the plan type and is formatted as an integer
- column location – shows the city of the user, and the values can repeat
You wouldn’t normally have a possibility to preview the data in the interviews. But since we do have, why not use this option?
Here’s sample data from the first table.
It is not that clear what the sign-up start and end date mean. Are they the dates when the customer registered on the platform/left it or the date when they subscribed to a plan/ ended the subscription? When in the interview, this is the perfect chance to pose these questions in the interview. We don’t have this possibility, so we’ll assume the start and the end dates show when the customer subscribed and canceled their plan.
The second table, transactions, contains these columns.
We can take up the following from this.
- column transaction_id – the table’s primary key
- column signup_id – the same column as in the first table, which means this is a foreign key
- column transaction_start_date – this date is, too, formatted as datetime
- column amt – should be an amount relevant to the transaction
Take a look at the table’s preview.
How do the two tables work together? Understanding this will basically unveil how Noom works.
When the customers sign-up, they are assigned a unique signup ID (column signup_id), and an entry is recorded in the signups table. This record also includes the dates they signed up for their plan and canceled it (columns signup_start_date and signup_stop_date), the type of plan they subscribed to (column plan_id), and their city (column location).
As Noom provides its services to the customer and the customer pays it, the transaction occurs. This transaction is logged in the transactions table. There, each transaction gets a unique id (column transaction_id) that references the customer’s signup ID from the first table (column signup_id). There’s also a date (column transaction_start_date) and the amount charged for the transaction (column amt).
For subscription-based businesses like Noom, the customer is typically charged on a regular basis, e.g., monthly. What does this mean for the records in the question dataset? You should expect multiple transactions per signup. In other words, there is a relationship between the signups and the transactions table: one customer can have multiple transactions.
Check this with your interviewer! The counterpart to the interviewer on our platform is writing a simple code to check what we just said.
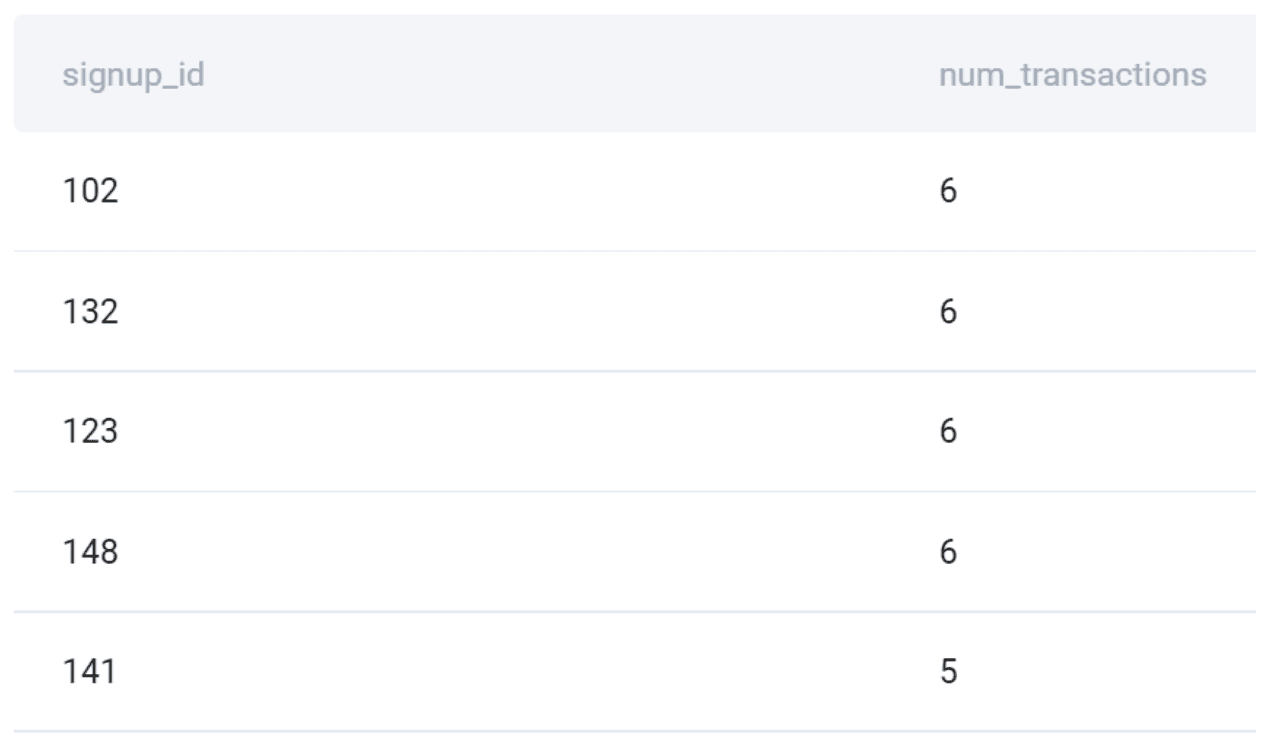
Run the code in the widget to see that there are multiple entries per signup ID.
SELECT
    signup_id,
    COUNT(transaction_id) AS num_transactions
FROM transactions
GROUP BY signup_id
ORDER BY 2 DESC;
Going back to how the subscriptions work, when the customer decides to end their subscription, this is reflected in the update of the column signup_stop_date in the table signups.
2. Writing Out the Approach
This Noom data analyst interview question asks you to show the location, average duration, average transaction amount, and a ratio of these two averages.
Now, the averages are not immediately available to you. So before showing the final output with a ratio, you should calculate the average duration and transaction amount per location.
Here are the steps to do that and get to the solution.
1. Calculate average duration per location
Duration is the difference between the sign-up start and end date. In business terms, this is a customer’s lifetime.
You can find all the columns for this calculation in the signups table.
2. Calculate the average transaction per location
To calculate the average transaction per location, you’ll need to use both the transactions and signups table.
These two tables can be joined via the common column signup_id.
3. Join the two calculated tables
You need both averages in the same table to calculate the ratio. Using the INNER JOIN is safe because both calculated tables will have the same locations.
4. Calculate the ratio
Now that all the required data is in one table, you can calculate the ratio. The formula is:
5. Sort the results from the highest to lowest ratio
To sort the output, use the ORDER BY.
It is recommendable to think about the edge cases while writing out the coding approach.
For this question, the edge case might be how to account for the active users, i.e., those who haven’t ended their Noom subscription. How do you write such a query, and does this edge case impact the interpretation of the results?
To answer that, it’s crucial to uncover how the system records the sign-up stop dates for active customers.
There are two possibilities:
1. The sign-up stop dates are blank for active customers.
If this is the case, the steps written above would be erroneous. To avoid this, you should first filter rows where the sign-up stop date is not null, then do the calculations. That way, you’re restricting your analysis only to customers with an established lifetime.
2. A proxy date is used for the active customers’ stop date.
If the current date is set up as a proxy date, then the sign-up stop date is updated daily.
In that case, the average duration also changes daily because the duration of the active users increases.
This is problematic because a customer who signed up yesterday will have a duration of one day, which is a misrepresentation of the customer’s lifetime. We recommend you restrict your analysis to current customers or a historical performance to avoid misrepresentation.
Now that you have all the steps written out, the edge cases considered, and everything checked with the interviewer, you can start coding.
We see from the table preview that the sign-up stop dates are there for every customer. So we’ll write the code assuming the signups table contains only the historical data.
3. Coding the Solution
This framework part simply translates the above steps into an SQL code.
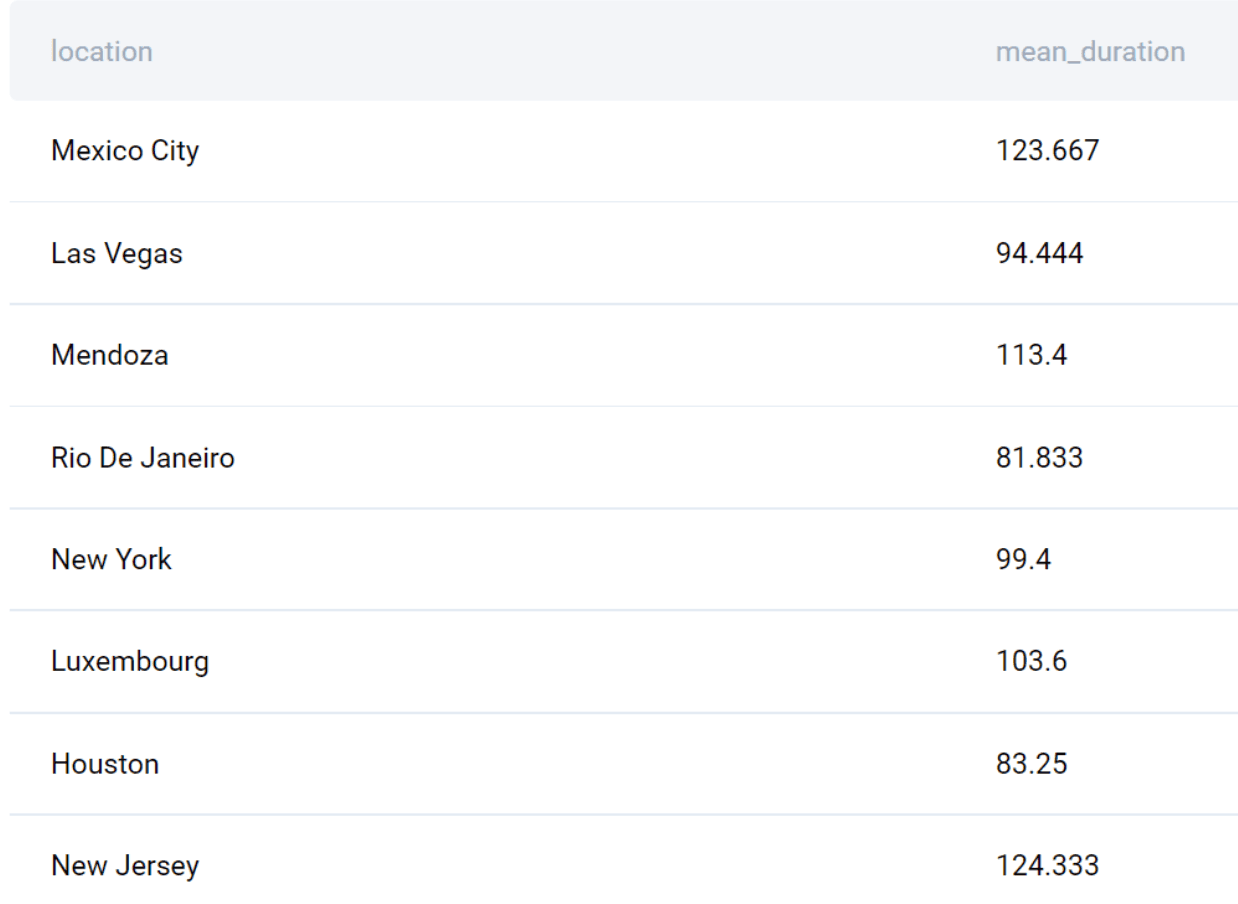
1. Calculate average duration per location
First, find the difference between the start and stop dates. Then, use the AVG() function to get the average duration per location.
SELECT location,
       AVG(signup_stop_date - signup_start_date) AS mean_duration
FROM signups
GROUP BY location;
Remember that we noticed both dates are in the datetime format. That’s why we can directly subtract them.
This query’s output shows all the customers’ locations and the average duration for each location.
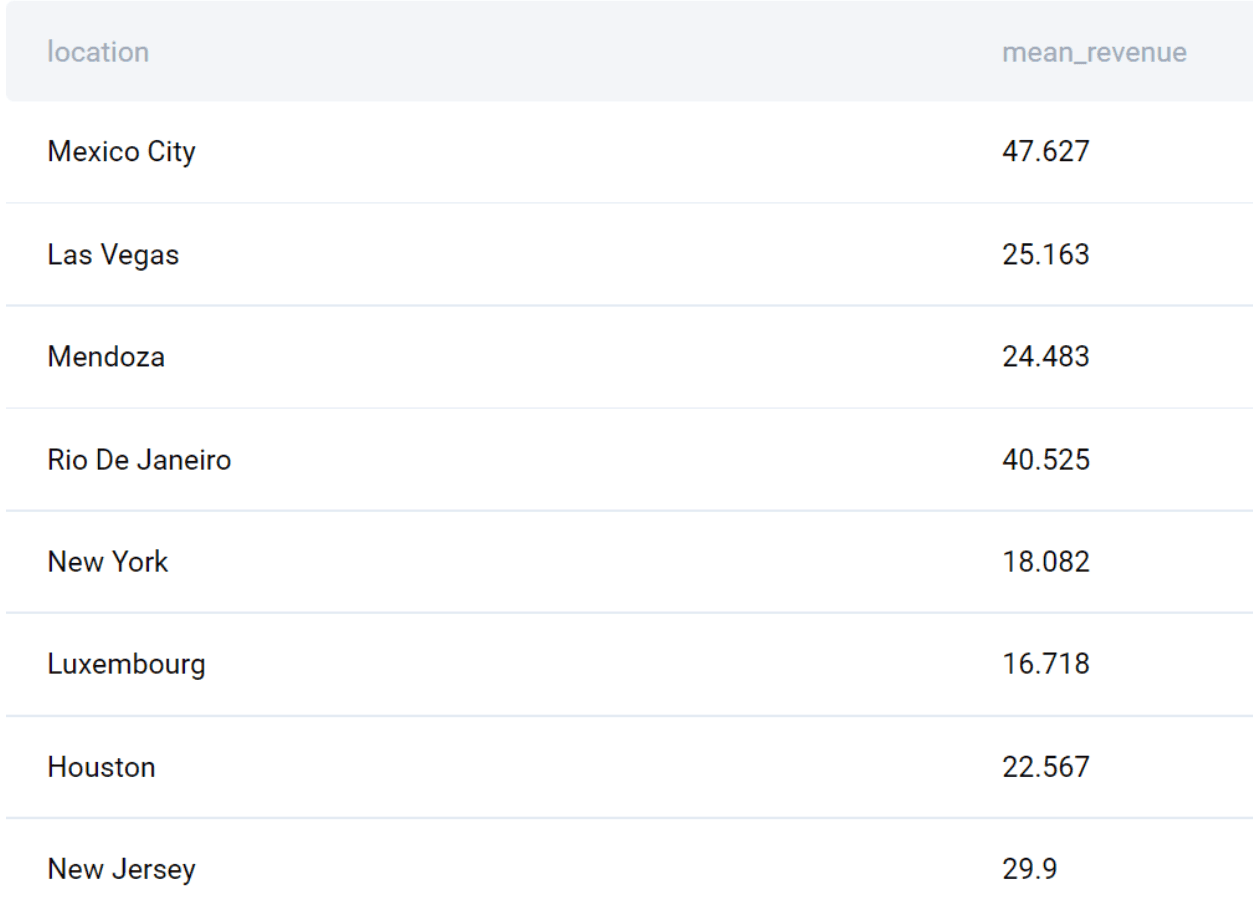
2. Calculate the average transaction per location
This step doesn’t require pre-calculation. All data is already available; you only need to join the two tables.
SELECT location,
       AVG(amt) AS mean_revenue
FROM transactions t
JOIN signups s ON t.signup_id = s.signup_id
GROUP BY location;
These are again locations, but with the average revenue instead of duration.
Now that you have these two averages, you can build your target output.
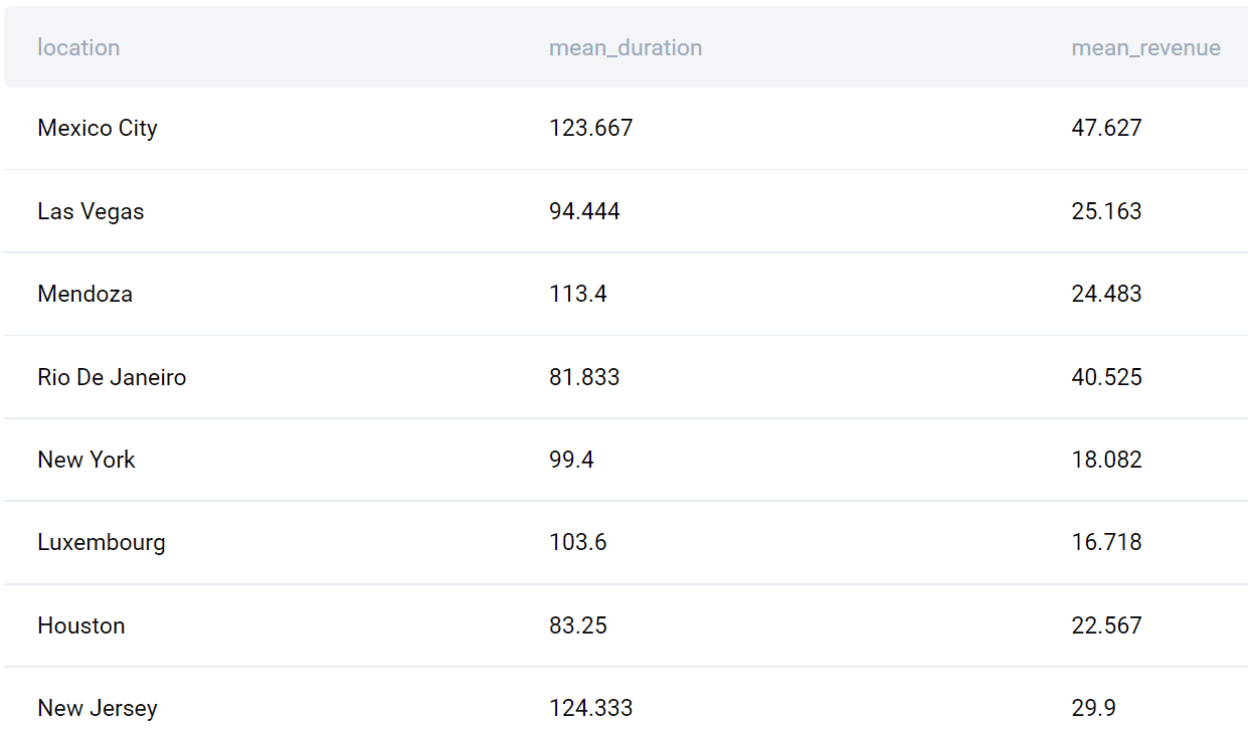
3. Join the two calculated tables
These two tables will be two subqueries joined by INNER JOIN in the FROM clause of the main SELECT statement.
SELECT dur.location,
       mean_duration,
       mean_revenue
FROM
  (SELECT location,
          AVG(signup_stop_date - signup_start_date) AS mean_duration
  FROM signups
  GROUP BY location) AS dur
JOIN
  (SELECT location,
          AVG(amt) AS mean_revenue
  FROM transactions t
  JOIN signups s ON t.signup_id = s.signup_id
  GROUP BY location) AS rev
ON dur.location = rev.location;
The code output has almost everything you need in the final output. You have all the locations and averages in one table. Now you have to use them to calculate the ratio.
4. Calculate the ratio
The ratio is simply the average revenue divided by the average duration. Additionally, convert the division result to a float to get the decimal numbers.
SELECT dur.location,
       mean_duration,
       mean_revenue,
       mean_revenue/mean_duration::float AS ratio
FROM
  (SELECT location,
          AVG(signup_stop_date - signup_start_date) AS mean_duration
  FROM signups
  GROUP BY location) AS dur
JOIN
  (SELECT location,
          AVG(amt) AS mean_revenue
  FROM transactions t
  JOIN signups s ON t.signup_id = s.signup_id
  GROUP BY location) AS rev
ON dur.location = rev.location;
The output is the same as in the previous step, except this one has a ratio per location.
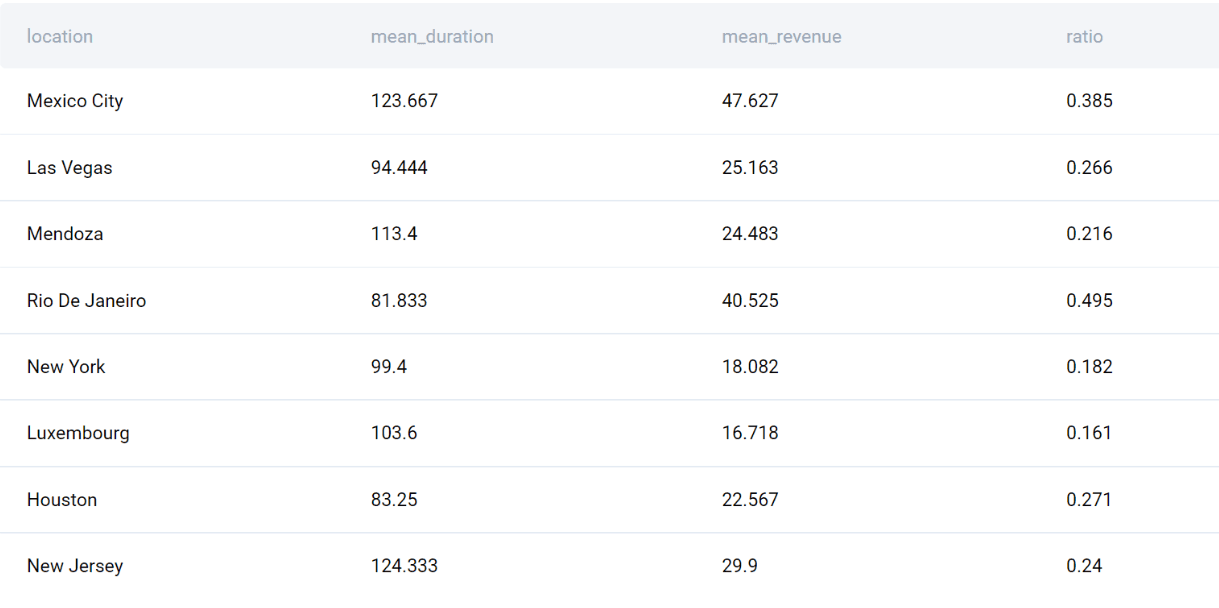
Now the output only has to be sorted the right way.
5. Sort the results from the highest to lowest ratio
The question tells you to sort the output in descending order by ratio. Just add the ORDER BY clause as the last row of the above code.
SELECT dur.location,
       mean_duration,
       mean_revenue,
       mean_revenue/mean_duration::float AS ratio
FROM
  (SELECT location,
          AVG(signup_stop_date - signup_start_date) AS mean_duration
  FROM signups
  GROUP BY location) AS dur
JOIN
  (SELECT location,
          AVG(amt) AS mean_revenue
  FROM transactions t
  JOIN signups s ON t.signup_id = s.signup_id
  GROUP BY location) AS rev
ON dur.location = rev.location
ORDER BY ratio DESC;
By writing this, you’ve written the solution to Noom’s question.
Your analysis shows that the highest revenue per day comes from Rio De Janeiro. The lowest ratio is in Luxembourg. Also, you can see the highest revenue is made in Mexico City, but it is spread out over a longer duration.
| location | mean_duration | mean_revenue | ratio |
|---|---|---|---|
| Rio De Janeiro | 81.83 | 40.53 | 0.5 |
| Mexico City | 123.67 | 47.63 | 0.39 |
| Houston | 83.25 | 22.57 | 0.27 |
| Las Vegas | 94.44 | 25.16 | 0.27 |
| New Jersey | 124.33 | 29.9 | 0.24 |
| Mendoza | 113.4 | 24.48 | 0.22 |
| New York | 99.4 | 18.08 | 0.18 |
| Luxembourg | 103.6 | 16.72 | 0.16 |
Conclusion
We hope you enjoyed solving this Noom data analyst interview question!
We believe it really showcases how interviewers like to use familiar SQL concepts, such as data aggregation and JOINs, to make questions more difficult. Once you internalize the steps for solving the SQL questions and realize that you should use subqueries in this case, writing code becomes more manageable. All the heavy lifting has been done when analyzing the given dataset and formulating your coding approach.
If you liked this Noom question, you could also try and solve another similar problem by Noom here → Noom SQL Interview Questions.
Share