Lyft Data Scientist Interview Question Walkthrough

Categories:
 Written by:
Irakli Tchigladze
A three step solution to an SQL question asked during an interview at the ride-hailing company.
Nearly 20 million people use Lyft to move around their cities. The company’s main product is a user-friendly mobile application that allows users to seamlessly move from point A to point B.
Behind the user friendliness of the smartphone app, Lyft puts a lot of effort into collecting and analyzing data about its users and drivers. This helps them plan and optimize their resources to provide the most efficient inner city transportation considering the price, time, and level of comfort.
Interviewers at Lyft try to ask the right questions to hire capable data scientists. In this article, we will walk you through one of the common data scientist interview questions, where candidates have to calculate driver churn rate based on available data.
Basic to Intermediate Concepts Tested in Lyft Data Scientist Interview
Lyft is looking for data scientists who can help the company by writing efficient and readable SQL queries. To do that, candidates need to thoroughly understand SQL concepts.
Let’s look at some essential SQL concepts which can help you get the data scientist job at Lyft.
COUNT()
When going into a data science interview, it’s important to know how to use all aggregate functions. This includes their syntax, possible arguments, and output values. Reading “The Ultimate Guide to SQL Aggregate Functions” can help you better understand this SQL feature.
To answer this particular question, a candidate needs to understand the COUNT() aggregate function. You should know that the COUNT() function returns the number of rows that have a value in the specified column. If there is a NULL value, the COUNT() function will not add that row to the total.
Other useful operations that a candidate might need to perform include: getting the number of rows with unique values in a specific column, getting the number of total records, getting the number of records with NULL values in a specific column, giving an alias to the result, and so on.
It’s also useful to know how to use the GROUP BY statement to summarize the results of aggregate functions such as COUNT().
In the best-case scenario, you should be familiar with some of the examples of how COUNT() can be used in practice. To arrive at the final answer to this question, we are going to use COUNT() to find the number of rows with a NULL value in the specified column. Then we can find the ratio between this number and the total number of rows in the table.
Another important detail is that the COUNT() aggregate function returns an integer value. In our solution, we divide one output of a COUNT() function by another to get a decimal ratio. To get the desired result, we will need to convert one of the values to a float.
Converting Value Types
When solving a question, it’s important to know what type of values you’re dealing with. If needed, you should be able to convert one type of value into another to perform arithmetic operations and get accurate results.
A candidate should know how to convert a date value to a string, an integer to a float, a string to an integer, or any other combination. One of the most important functions to know is CAST(), but there is also a shorthand syntax for changing the type of value.
In this particular question, we are dealing with the differences between integer division and float division. Finding an answer requires a thorough understanding of the difference between two arithmetic operations. You should also know when they occur and why divisions are of one type or another.
For example, we might need to divide the result of one COUNT() function by another. Both of these are integer values. If we want to get a float value as an answer, we have to perform a float division. For that, we have to convert one of them to a float value.
AS keyword to give alias
Knowing the syntax and practical applications of the AS command can help you write easily understandable code. Descriptive column names can also help others understand available data.
A good candidate should know how to give alias names to table references, subqueries, and even CTEs.
The AS command is often used with other SQL statements, such as WITH and SELECT. Knowing how to combine these statements with the AS command is essential to writing efficient queries.
Ideally, you should know other important details of how the AS keyword works, for example, the fact that an alias only exists for the duration of the query.
Lyft Data Scientist Interview Question Walkthrough

In this question, candidates have to calculate a driver churn rate. This is important for Lyft as it helps the company ensure a steady supply of drivers in any location.
In this question, we are asked to find the driver churn rate for all regions. We don’t have to filter by region or time.
Churn Rate Of Lyft Drivers
Calculate the overall churn rate for Lyft drivers across all years in the dataset. Churn is defined as the percentage of drivers who have stopped driving for Lyft, as indicated by a recorded end_date in the lyft_drivers table. In your answer, express the churn rate as a ratio, instead of a percentage. For example, 0.1 instead of 10%.
Understanding the concept of churn rate is necessary to come up with a formula to calculate it.
Link to the question: https://platform.stratascratch.com/coding/10016-churn-rate-of-lyft-drivers
Available Dataset
lyft_drivers
| index | int |
| start_date | datetime |
| end_date | datetime |
| yearly_salary | int |
Before coming up with an approach, pay attention to types of values in each of these columns.
Data Assumptions
All the available data for this question is contained in the four columns of lyft_drivers table, so there isn’t much to analyze.
Let’s take a look at four columns in this table:
index - The values in this column are consecutive numbers assigned to each driver record. It’s safe to assume that all rows will have a value in this column.
start_date - This value represents the date when the driver first signed up with Lyft. It’s safe to assume that all rows will have a value in this column.
end_date - We need to check the value in this column to find the number of active drivers. We need this number to calculate the churn rate of drivers throughout the years.
yearly_salary - The question does not mention driver earnings, so we can ignore this column.
The fact that there is no driver_id column tells us that we can assume that every record is unique.
Carefully reading the question is necessary to solve any SQL problem. Once you understand the task at hand, looking at the available data is all you need to get the answer.
This question is a prime example of how previewing the data can help you find the answer. If you do look at the data, you’ll see that each row represents one driver.
All records contain a value in the start_date column, but some have an empty end_date column. This could represent the situation when a driver signed up for Lyft and never stopped (an active driver).
On the other hand, the rows that have both start and end values clearly represent the cases when drivers stopped working for Lyft. We will need to find the number of both active and inactive drivers to calculate the churn rate.
Once you logically connect all the dots, you can start writing the query.
Solution Logic
Calculating the driver churn rate means getting the share of drivers who were once driving for Lyft, but stopped for one reason or another.
To find a solution for any SQL challenge, you need to pay attention to the phrasing of the question.
This particular question specifies that the output should be a ratio, which is always going to involve a division of one value (part) by another (total). After looking at the data, you'll realize that we have to divide drivers who quit by the number of all drivers.
The question does not specify a time period for counting the drivers. So there is no need to filter the drivers by sign-up date or the end date.
An important step for solving this Lyft data scientist interview question is to translate an abstract concept like churn rate into a formula. Then you can simply plug the values into that formula to get the answer.
Before writing any SQL code, it’s a good idea to describe broad steps to solve the problem:
- Get the total number of drivers and inactive drivers
- Convert one of the integers to a float to get a decimal value
- Divide the number of inactive drivers by the number of all drivers
Previewing the table can help us identify the drivers who are no longer driving for Lyft. If the end_date column for a driver record is empty, it means that the driver is still active. If the driver has a specific date in the end_date column, it means that driver is no longer active.
Knowing how the COUNT() aggregate function works can help you solve this problem in just a few lines of code. We can use COUNT(*), to get the number of all drivers, and use COUNT(end_date) to get the number of inactive drivers (those that contain a value in the end_date column).
The only problem is that the COUNT() aggregate function returns an integer value, so we will be dividing integer by integer. The result will be 0, instead of a decimal value to represent the ratio. This is because we are doing an integer division, which always returns whole numbers as a result.
We can do a float division by converting one of the values to a float. Then we can calculate a driver churn rate, which is a decimal value.
You can use the CAST() function to turn one of the integers into a float, or use a shorthand double colon syntax to do so.
Running the query will show that the column name for our final output is not descriptive. As a final step, we must use the AS command to give the column a descriptive name, such as ‘driver_churn_rate’.
Solution Approach
Step 1: Get the number of inactive drivers and total drivers
We are going to use the COUNT(end_date) aggregate function to get the number of inactive drivers (rows with a value in the end_date column).
We can also use COUNT(*) to get the total number of drivers. It’s safe to use the asterisk to get the number of all records in the table.
Obviously, we have to specify the table to extract values from.
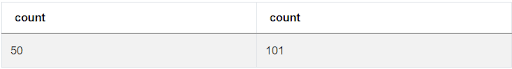
SELECT COUNT(end_date),
       COUNT(*)
FROM lyft_driversIf we run this code, we’ll see the number of inactive drivers, vs the number of ALL drivers:
Step 2: Find the ratio
To find the ratio, we need to divide the number of inactive drivers by the number of all records. Considering both values are integers, first, we need to convert one of them to a float, so the result of the division will be a decimal value.
We can use the shorthand syntax (::) to convert an integer value to a float:
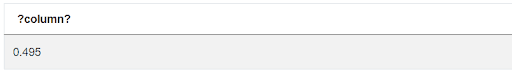
SELECT COUNT(end_date)::float/ COUNT(INDEX)
FROM lyft_driversIf we run the query, it will return an answer:
The only problem left is the column name.
Step 3: Name the column
Now, we just need to name the column to describe what the value represents. For that, we are going to use the AS command in SQL.
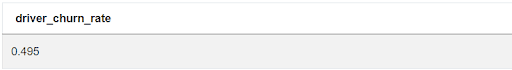
SELECT COUNT(end_date)::float/ COUNT(INDEX) AS driver_churn_rate
FROM lyft_driversNow, when we run this code, the column has a much more understandable name driver_churn_rate
If we check our final solution, it is accepted.
Final Words
Churn rate is an important metric for many companies. Solving this Lyft data scientist interview question will teach you what the concept represents and how to calculate it based on available data.
StrataScratch has everything to prepare you for a data scientist interview. You can check if your solution is correct and look at other people’s solutions to understand different ways to approach the problem.
Our platform allows you to sort through data science interview questions for each data science company, so you can prepare for an interview with your desired employer. It also includes non-technical questions and everything else you need to get a job.
Share