DoorDash SQL Interview Questions

Categories:
 Written by:
Sara Nobrega
DoorDash SQL Interview Questions: delivery timing, order volumes, driver performance, and customer behavior
DoorDash operates a three-sided marketplace connecting customers, restaurants, and Dashers.
That structure shapes every SQL question you'll encounter in their interviews. Queries tend to involve delivery windows, order aggregations across time periods, and operational metrics like late delivery rates or driver performance scores.
What makes DoorDash SQL questions difficult isn't the syntax.
It's that the prompts are deliberately underspecified. "Extremely late" needs a definition. "Bottom 2%" needs a bucketing method. "First-time order" needs a grain decision. Interviewers want to see whether you ask the right clarifying questions and whether your query survives edge cases like nulls, canceled orders, and missing timestamps.
This guide covers real DoorDash interview questions organized by theme, each with a step-by-step solution and interview-specific commentary.

SQL Fundamentals You Need for DoorDash Interviews
Before diving into the questions, here are the SQL concepts that appear most frequently in DoorDash-style interviews. If you want a broader refresher across common patterns companies test, this set of SQL Interview Questions is a useful complement to the DoorDash-specific cases below.
Joins and Filtering
DoorDash datasets typically involve multiple tables: order details joined to merchant tables, or delivery records joined to driver data. Understanding when an INNER JOIN silently drops records versus when a LEFT JOIN is required is critical, especially when some merchants may have zero first-time orders.

Window Functions
FIRST_VALUE(), ROW_NUMBER(), NTILE(), and PERCENTILE_DISC() all appear in this guide. These let you perform per-partition calculations without collapsing rows, which is essential for "first-ever event" and "ranking" problems.
Aggregations and Percentages
Most DoorDash metrics require computing ratios: the percentage of late deliveries, the percentage of drivers with a zero rating. The key habit is casting the numerator to FLOAT or multiplying by 100.0 before dividing so you don't get integer truncation.
CTEs (Common Table Expressions)
CTEs help you decompose complex problems into readable stages. When a DoorDash question asks you to filter, then aggregate, then rank, each stage works best as its own CTE.
Date and Interval Arithmetic
DoorDash timestamps are everywhere. You'll use EXTRACT(EPOCH FROM ...) to convert intervals to total seconds, to_char() to format month labels, and timestamp comparisons to filter within specific date windows.
DoorDash SQL Interview Questions

Orders-Centric Questions
This section focuses on order-level analysis: delivery timing and revenue breakdowns.
DoorDash SQL Interview Questions #1: Extremely Late Delivery
Extremely Late Delivery
Last Updated: June 2022
To remain competitive, the company you work with must reduce the number of extremely late deliveries.
A delivery is flagged as extremely late if the actual delivery time is more than 20 minutes (not inclusive) after the predicted delivery time.
You have been asked to calculate the percentage of orders that arrive extremely late each month.
Your output should include the month in the format 'YYYY-MM' and the percentage of extremely late orders as a percentage of all orders placed in that month.
Data View
The delivery_orders table has one row per order. Three timestamp columns matter here:
order_placed_time, predicted_delivery_time, and actual_delivery_time. Some rows have a null actual_delivery_time, which means those orders were canceled.
Grain: (what one output row means): one row per calendar month.
How This Is Asked in Interviews
In interviews, this question surfaces as "calculate an operational SLA metric over time." The interviewer wants to see whether you define "extremely late" correctly (strictly greater than 20 minutes, not inclusive) and whether you handle canceled orders without being prompted.
A strong candidate immediately asks: "Should canceled orders count as late, or should they be excluded?" The prompt implies excluded, because there is no actual_delivery_time to compare against.
A common follow-up is: "How would the answer change if we included canceled orders as late?"
Common Mistakes
The most frequent mistake is using EXTRACT(MINUTE FROM interval) to compute the delay. EXTRACT(MINUTE ...) returns only the minute component of an interval, so a 90-minute delay would return 30, not 90. The correct approach is to convert the full interval to total minutes using EXTRACT(EPOCH FROM (actual_delivery_time - predicted_delivery_time)) / 60.
Another mistake is forgetting to filter null actual_delivery_time values before computing the delay. If canceled orders are included, the subtraction returns null and those rows silently contribute to the denominator, which understates the late delivery rate.
Solution
1) Filter canceled orders and extract the month
We exclude rows where actual_delivery_time is null, removing canceled orders. We also extract the month in YYYY-MM format using to_char().
SELECT
  to_char(order_placed_time, 'YYYY-MM') AS year_month,
  actual_delivery_time,
  predicted_delivery_time
FROM delivery_orders
WHERE actual_delivery_time IS NOT NULL;
2) Flag extremely late orders
We add a CASE statement that marks each order as 1 if the difference between actual_delivery_time and predicted_delivery_time exceeds 20 minutes. We use EXTRACT(EPOCH ...) to get total elapsed seconds, then divide by 60.
SELECT
  to_char(order_placed_time, 'YYYY-MM') AS year_month,
  CASE
    WHEN EXTRACT(EPOCH FROM (actual_delivery_time - predicted_delivery_time)) / 60 > 20
    THEN 1
    ELSE 0
  END AS is_extremely_late
FROM delivery_orders
WHERE actual_delivery_time IS NOT NULL;
3) Aggregate per month to compute the percentage (final solution)
We group by month and divide the sum of late flags by the total order count, multiplied by 100. Casting to FLOAT prevents integer division.
DoorDash SQL Interview Questions #2: Lowest Revenue Generated Restaurants
Lowest Revenue Generated Restaurants
Last Updated: May 2021
Write a query that returns a list of the bottom 2% revenue generating restaurants. Return a list of restaurant IDs and their total revenue from when customers placed orders in May 2020.
You can calculate the total revenue by summing the order_total column. And you should calculate the bottom 2% by partitioning the total revenue into evenly distributed buckets.
Data View
The doordash_delivery table has one row per order. restaurant_id is the grouping key, order_total is the revenue value, and customer_placed_order_datetime filters to the relevant month.
Grain (what one output row means): one row per restaurant in the bottom 2% revenue bucket.
How "Bottom 2%" Gets Defined
This is a question where clarifying the bucketing method matters. "Bottom 2%" could mean a percentile cutoff computed by PERCENTILE_CONT, or it could mean dividing restaurants into evenly sized buckets using NTILE. The prompt specifies "evenly distributed buckets," which points to NTILE.
With NTILE(50), each bucket represents 2% of the population. Restaurants assigned to bucket 1 are the lowest-revenue 2%.
A senior-sounding observation: "NTILE(50) distributes restaurants as evenly as possible, but with a small dataset it can produce uneven buckets. If there are 49 restaurants, bucket sizes won't all be equal." That awareness of how NTILE behaves on small populations shows depth.
Trade-Offs
An alternative is PERCENT_RANK() or CUME_DIST(), which compute actual percentile positions without requiring a fixed bucket count. These are more precise for small datasets. However, when the prompt explicitly mentions "evenly distributed buckets," NTILE(50) is the expected approach.
Solution
1) Filter to May 2020 and compute total revenue per restaurant
We filter customer_placed_order_datetime to May 2020 and aggregate order_total by restaurant_id. This gives one row per restaurant with their monthly revenue total.
SELECT
  restaurant_id,
  SUM(order_total) AS total_order
FROM doordash_delivery
WHERE customer_placed_order_datetime BETWEEN '2020-05-01' AND '2020-05-31'
GROUP BY restaurant_id;
2) Assign revenue buckets with NTILE and filter to the bottom 2% (final solution)
We wrap the aggregation in a subquery and apply NTILE(50) ordered by total revenue ascending. Restaurants in bucket 1 fall in the bottom 2%. We filter to ntile = 1 and sort by revenue descending.
DoorDash SQL Interview Questions #3: Avg Order Cost During Rush Hours
Avg Order Cost During Rush Hours
Last Updated: May 2021
The company you work for has asked you to look into the average order value per hour during rush hours in the San Jose area. Rush hour is from 15H - 17H59 inclusive.
You have also been told that the column order_total represents the gross order total for each order. Therefore, you'll need to calculate the net order total.
The gross order total is the total of the order before adding the tip and deducting the discount and refund.
Use the column customer_placed_order_datetime for your calculations.
Data View
Grain (what one output row means): one row per hour (15, 16, 17), restricted to San Jose orders only.
Interview Framing (How It’s Asked + Typical Follow-Ups)
In interviews, this comes up as "AOV by hour" or "rush-hour performance."
Common follow-ups:
- "Is rush hour inclusive of 17:59?" (Yes: hours 15, 16, 17.)
- "Which timestamp should we use?" (Prompt specifies
customer_placed_order_datetime.) - "Do we compute AOV on gross or net?" (Prompt requires net, and defines how.)
Trade-Offs / Decision Rules (Why This Approach vs Alternatives)
The clean pattern is:
- Compute net order value in a CTE so the definition is explicit and reusable.
- Filter down to the right region and hour window.
- Group by
EXTRACT(HOUR ...)and computeAVG().
This keeps the business logic (metric definition) separate from the reporting logic (time window + aggregation), which makes the query easier to audit.
Solution
1) Compute net (final) order value for San Jose orders
 SELECT
 customer_placed_order_datetime,
 order_total + tip_amount - (discount_amount + refunded_amount) AS final_order_value
 FROM delivery_details
 WHERE delivery_region = 'San Jose';
2) Final query: average net order value by hour during rush hours (15–17)
User & Retention Questions

This section focuses on customer behavior and how first-order patterns distribute across merchants.
DoorDash SQL Interview Questions #4: First Time Orders
First Time Orders
Last Updated: February 2022
The company you work with wants to find out what merchants are most popular for new customers.
You have been asked to find how many orders and first-time orders each merchant has had.
First-time orders are meant from the perspective of a customer, and are the first order that a customer ever made. In order words, for how many customers was this the first-ever merchant they ordered with?
Note: Recently, new restaurants have been registered on the system; however, because they may not have received any orders yet, your answer should exclude restaurants that have not received any orders.
Your output should contain the name of the merchant, the total number of their orders, and the number of these orders that were first-time orders.
Data View
The order_details table has one row per order with customer_id, merchant_id, and order_timestamp. The merchant_details table holds merchant names.
Grain (what one output row means): one row per merchant, with total order count and first-time order count.
What Interviewers Are Actually Testing
This question is about correctly defining "first-time order." It does not mean the first time a customer ordered at this specific merchant. It means the first order a customer ever placed, across all merchants. We need to identify each customer's earliest order_timestamp globally and then find which merchant received that order.
The follow-up question interviewers often ask is: "What if a customer placed two orders at exactly the same timestamp?" In that case, FIRST_VALUE() ordered by order_timestamp alone produces a tie, and the result is non-deterministic. A prepared candidate acknowledges this and suggests a tiebreaker, such as ORDER BY order_timestamp, id.
Common Mistakes
A frequent mistake is interpreting "first-time orders" as "orders from customers who are new to this merchant." That conflates "first order at merchant X" with "first order ever placed." The correct definition uses a global earliest timestamp per customer, regardless of which merchant was involved.
Another mistake is using MIN(order_timestamp) in a GROUP BY to find the first order, then joining back on both customer_id and order_timestamp. That approach is fragile: if two orders share the same timestamp for the same customer, the join multiplies rows.
Solution
1) Find each customer's first-ever merchant using FIRST_VALUE
We apply FIRST_VALUE(merchant_id) partitioned by customer_id and ordered by order_timestamp. This tags every row for a given customer with the merchant they first ordered from, globally.
WITH first_order AS (
  SELECT
    customer_id,
    FIRST_VALUE(merchant_id) OVER (
      PARTITION BY customer_id
  	ORDER BY order_timestamp
	) AS first_merchant
  FROM order_details
)
SELECT *
FROM first_order;
2) Count total orders and first-time orders per merchant
We join order_details to first_order on merchant_id = first_merchant. For each merchant, we count distinct customer_id values from first_order as first-time orders and distinct id values from order_details as total orders. The LEFT JOIN ensures merchants with zero first-time orders still appear.
WITH first_order AS (
  SELECT
    customer_id,
    FIRST_VALUE(merchant_id) OVER (
      PARTITION BY customer_id
  	ORDER BY order_timestamp
	) AS first_merchant
  FROM order_details
),
number_of_customers AS (
  SELECT
    d.merchant_id,
    COUNT(DISTINCT f.customer_id) AS first_time_orders,
    COUNT(DISTINCT d.id) AS total_number_of_orders
  FROM order_details d
  LEFT JOIN first_order f ON d.merchant_id = f.first_merchant
  GROUP BY 1
)
SELECT *
FROM number_of_customers;
3) Join to merchant_details to get merchant names (final solution)
We join to merchant_details on merchant_id to replace IDs with names. The output contains each merchant's name, total order count, and first-time order count.
Delivery Windows & Dasher Metrics
This section covers operational metrics: delivery time correlations and arrival time distributions.
DoorDash SQL Interview Questions #5: Delivering and Placing Orders
Delivering and Placing Orders
Last Updated: May 2021
You have been asked to investigate whether there is a correlation between the average total order value and the average time in minutes between placing an order and having it delivered per restaurant.
You have also been told that the column order_total represents the gross order total for each order. Therefore, you'll need to calculate the net order total. This is done by adding the tip_amount and subtracting both the discount_amount and refunded_amount from the order_total.
Make sure correlation is rounded to 2 decimals.
Data View
The delivery_details table has one row per order. We need four numeric columns for net order value (order_total, tip_amount, discount_amount, refunded_amount) and two timestamps for delivery duration (customer_placed_order_datetime, delivered_to_consumer_datetime).
Grain (what one output row means): one scalar value, the correlation between restaurant-level averages.
Edge Cases Worth Raising
Some rows in delivery_details have a null delivered_to_consumer_datetime, which indicates an incomplete or canceled delivery. These rows produce a null delivery duration and are silently excluded from AVG(). In an interview, it's worth stating: "We'll assume null delivery timestamps mean the order wasn't completed. AVG() will exclude them automatically, but this affects which restaurants appear in the correlation."
Also worth noting: net order value can technically go negative if discount_amount + refunded_amount exceeds order_total + tip_amount. Whether to clip those to zero is a business decision that a senior candidate raises before writing the query.
Solution
1) Calculate net order value per order
We compute order_total + tip_amount - discount_amount - refunded_amount as final_order_value for each row, and carry the timestamps needed for delivery duration.
WITH order_value AS (
  SELECT
    restaurant_id,
    order_total + tip_amount - (discount_amount + refunded_amount) AS final_order_value,
    customer_placed_order_datetime,
    delivered_to_consumer_datetime
  FROM delivery_details
)
SELECT *
FROM order_value;
2) Aggregate per restaurant and compute the correlation (final solution)
We aggregate to restaurant level, computing average net order value and average delivery minutes. EXTRACT(EPOCH FROM ...) converts the timestamp interval to seconds, divided by 60 for minutes. Then corr() computes the Pearson correlation across all restaurants.
DoorDash SQL Interview Questions #6: Actual vs Predicted Arrival Time
Actual vs Predicted Arrival Time
Last Updated: October 2022
Calculate the 90th percentile difference between Actual and Predicted arrival time in minutes for all completed trips within the first 14 days of 2022.
Data View
The trip_details table has one row per trip. Key columns are predicted_eta, actual_time_of_arrival, status, and request_at.
Grain (what one output row means): one scalar value, the 90th percentile delay in minutes across qualifying trips.
Interview Framing
This question tests whether you know PERCENTILE_DISC(), a PostgreSQL ordered-set aggregate.
Candidates who only know SQL window functions often get stuck here because PERCENTILE_DISC() is not used with an OVER() clause. It uses WITHIN GROUP (ORDER BY ...) instead.
A common follow-up is: "What's the difference between PERCENTILE_DISC and PERCENTILE_CONT?" PERCENTILE_DISC returns an actual value that exists in the dataset. PERCENTILE_CONT interpolates between two adjacent values when the percentile falls between data points.
For this question, either is reasonable, but PERCENTILE_DISC is the more common interview answer because it produces a clean value from the real data.
Edge Cases
Two edge cases are worth mentioning.
First, negative differences occur when the driver arrived before the predicted time. Depending on the business definition, you might floor these at zero. The prompt doesn't specify, so noting the assumption is the right move.
Second, for the date filter, "first 14 days of 2022" means request_at >= '2022-01-01' and request_at < '2022-01-15' (January 1 through January 14 inclusive). A common mistake is using <= '2022-01-14' with a timestamp column, which excludes trips that occurred on January 14 after midnight.
Solution
1) Filter completed trips in the first 14 days of 2022 and compute delay in minutes
We filter to status = 'completed' and the correct date range. EXTRACT(EPOCH FROM ...) converts the interval between actual_time_of_arrival and predicted_eta to seconds, divided by 60.0 for minutes.
SELECT
  EXTRACT(EPOCH FROM (actual_time_of_arrival - predicted_eta)) / 60.0 AS diff_min
FROM trip_details
WHERE status = 'completed'
  AND request_at >= TIMESTAMP '2022-01-01 00:00:00'
  AND request_at <  TIMESTAMP '2022-01-15 00:00:00';
2) Apply PERCENTILE_DISC to get the 90th percentile delay (final solution)
We wrap the filtered result in a subquery and apply PERCENTILE_DISC(0.9) WITHIN GROUP (ORDER BY diff_min) to return the 90th percentile value from the actual dataset.
Product & Funnel SQL Cases
This section covers driver-level funnel analysis: first-delivery performance and rating distributions.

DoorDash SQL Interview Questions #7: First Ever Ratings
First Ever Ratings
Last Updated: June 2022
The company you work for is looking at their delivery drivers' first-ever delivery with the company.
You have been tasked with finding what percentage of drivers' first-ever completed orders have a rating of 0.
Note: Please remember that if an order has a blank value for actual_delivery_time, it has been canceled and therefore does not count as a completed delivery.
Data View
The delivery_orders table has one row per delivery attempt. Not all rows represent completed deliveries. A blank actual_delivery_time means the order was canceled and should not count as a completed delivery.
Grain (what one output row means): one scalar value, the percentage of drivers whose first-ever completed delivery was rated 0.
Evaluation Criteria
A strong answer does three things cleanly: filters out canceled orders before running any window function, uses FIRST_VALUE() partitioned by driver_id to identify the first-ever delivery rating, and counts distinct driver_id values in both numerator and denominator to avoid double-counting.
An okay answer gets the logic right but uses integer division, which produces 0 instead of 60 for a 60% result. A weak answer includes canceled deliveries in the window function, corrupting which delivery counts as "first" for each driver.
Validation
A quick check: the denominator in the final ratio should equal the number of distinct drivers who have at least one completed delivery. If the percentage seems unexpectedly high or low, verify that null actual_delivery_time rows were excluded before the window ran, not after.
Solution
1) Filter canceled orders and tag each row with the driver's first-ever delivery rating
We filter WHERE actual_delivery_time IS NOT NULL to remove canceled deliveries before the window function runs. Then we apply FIRST_VALUE(delivery_rating) partitioned by driver_id and ordered by actual_delivery_time to tag every row with that driver's first-ever rating.
WITH first_ratings AS (
  SELECT *,
    FIRST_VALUE(delivery_rating) OVER (
      PARTITION BY driver_id
  	ORDER BY actual_delivery_time
	) AS first_rating
  FROM delivery_orders
  WHERE actual_delivery_time IS NOT NULL
)
SELECT *
FROM first_ratings;
2) Compute the percentage of drivers whose first rating was 0 (final solution)
We count distinct driver_id values where first_rating = 0 as the numerator, and count all distinct drivers in first_ratings as the denominator. Multiplying by 100.0 ensures decimal output.
Tips for DoorDash SQL Interviews

How to Frame Answers
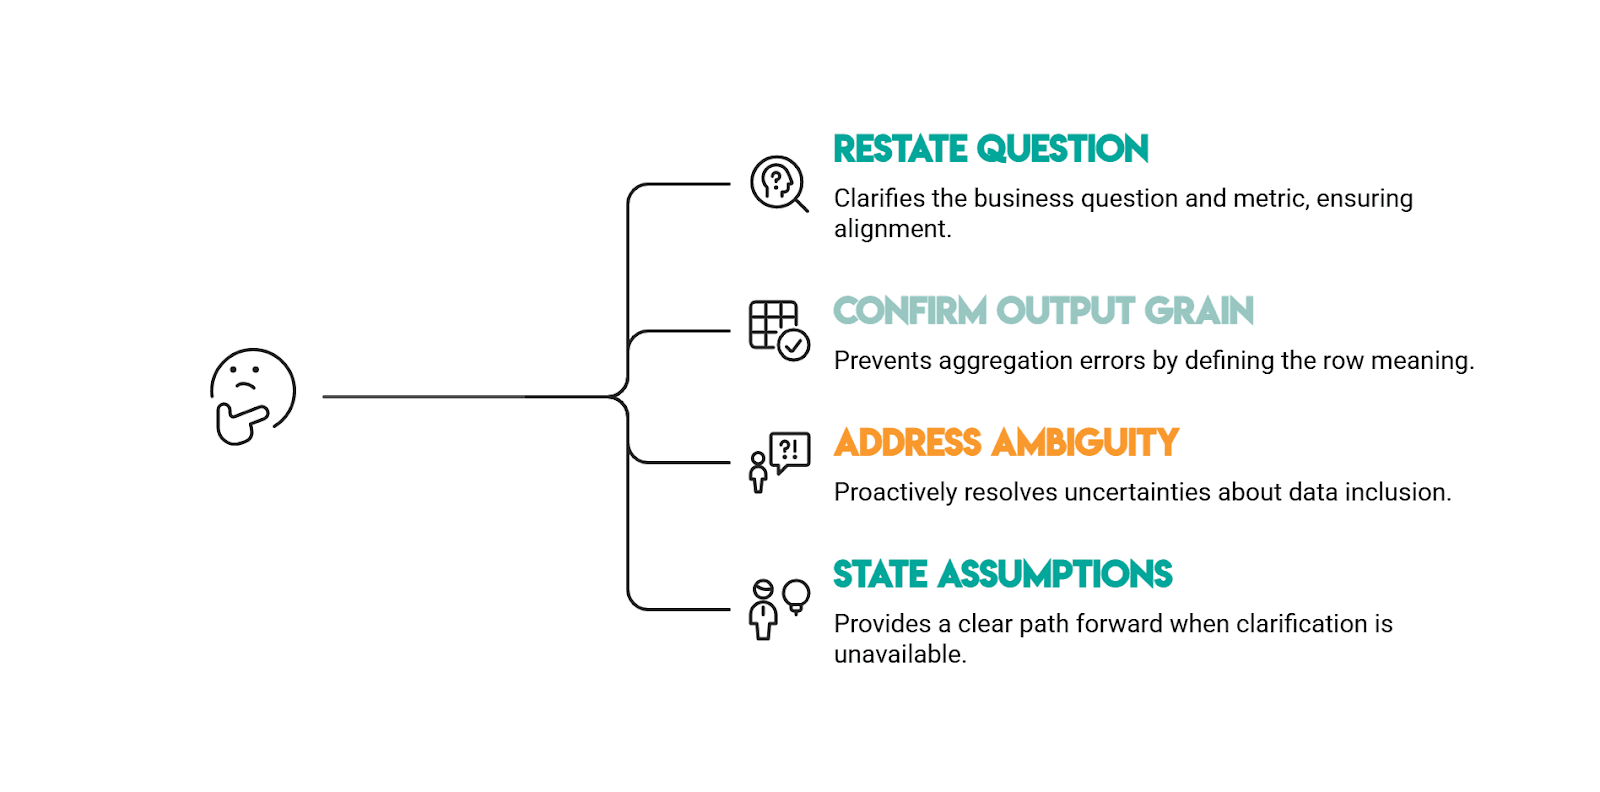
DoorDash SQL prompts are rarely complete on purpose. Before you write SQL, show the interviewer you can turn a vague business question into a precise metric and a defensible query.
1) Restate the question in your own words (with the metric).
Say what you’re solving for and how it will be measured. For example, “extremely late” needs an explicit threshold and whether it’s strict or inclusive.
2) Confirm the output grain (what one row means).
Lock this in early: one row per month, one row per restaurant, one scalar correlation, etc. If you can say the grain clearly, you’ll avoid the most common failure mode: correct logic at the wrong level of aggregation.
3) Call out the biggest ambiguity and ask one clarifying question.
DoorDash datasets often include canceled/incomplete records (null timestamps) and prompts often imply a business rule without stating it. Ask the “should we include/exclude?” question up front, especially around canceled orders and missing timestamps.
4) State your assumptions explicitly (then proceed).
If the interviewer doesn’t clarify, narrate what you’ll assume and why. Example: “I’ll exclude rows where actual_delivery_time is null because those represent canceled orders.”
Best Practices for SQL in Product Analytics Interviews
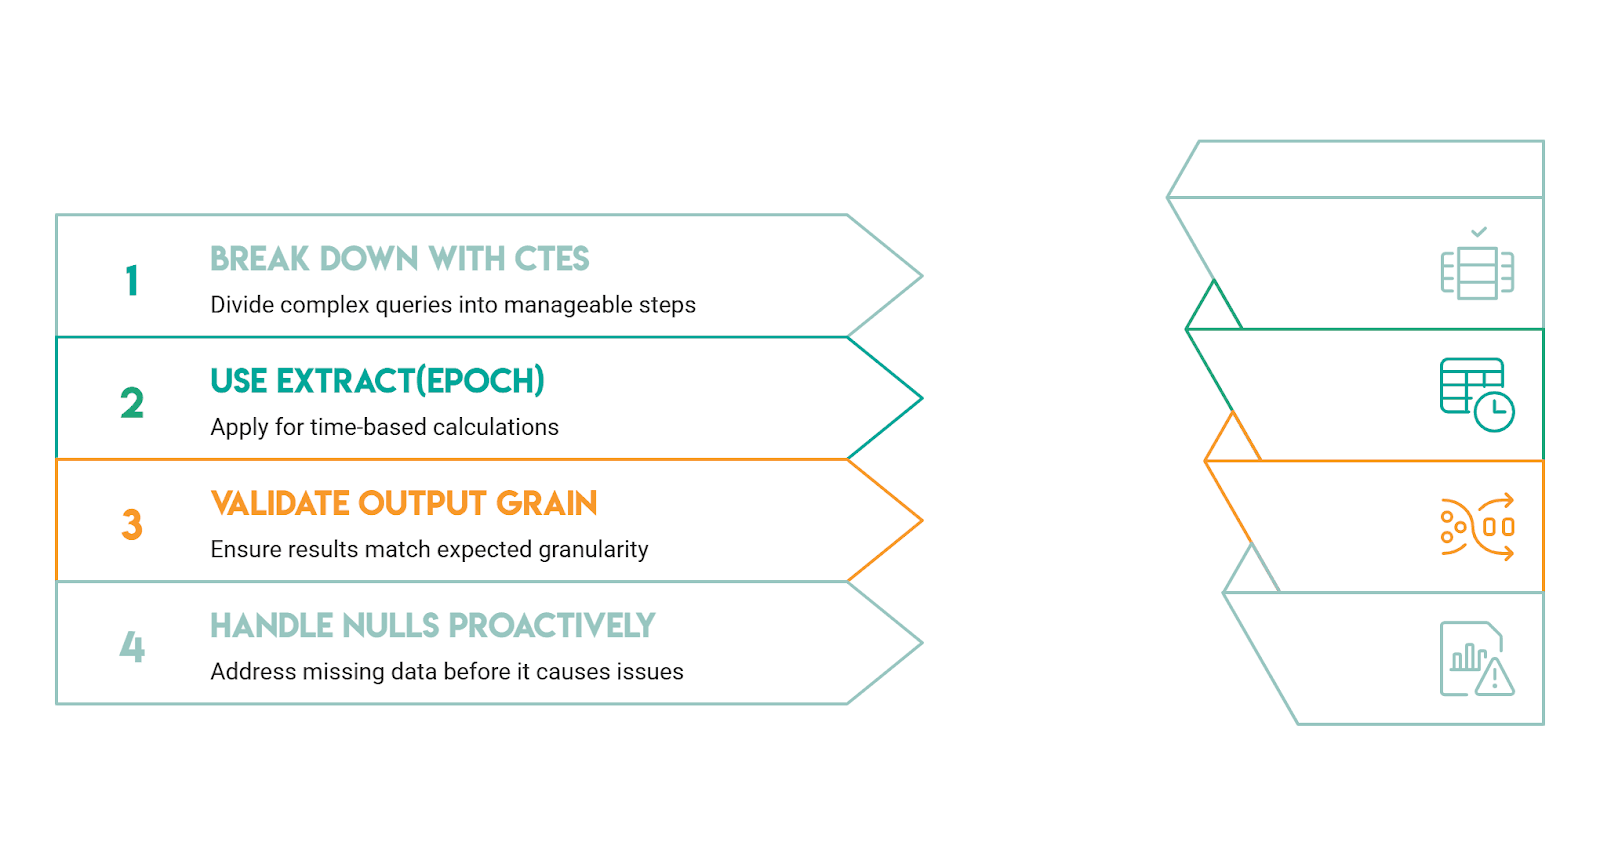
Break the Problem Into Stages With CTEs
Every question in this guide is easier when decomposed into stages: filter, aggregate, rank, then output. CTEs let you show your reasoning step by step, which is exactly what interviewers want to follow. A query that is two CTEs plus a final select is almost always clearer than an equivalent nested subquery.
Know When EXTRACT(EPOCH) Is the Right Tool
DoorDash questions frequently involve interval arithmetic. EXTRACT(MINUTE FROM interval) returns only the minute component, so EXTRACT(MINUTE FROM '01:35:00'::interval) returns 35, not 95. When you need total minutes from an interval, use EXTRACT(EPOCH FROM interval) / 60. This distinction catches candidates consistently in DoorDash-style questions.
Validate Your Output Grain
If the prompt asks for one row per month, count your output rows. If the prompt asks for a single correlation value, your final select should return exactly one row. Grain mismatches from incorrect joins are the most common source of wrong answers.
Raise Null Handling Proactively
Interviewers reward candidates who surface this without being asked. "Should we treat null delivery times as canceled, or count them as infinite delay?" is a better signal of experience than silently assuming either way.
Conclusion
DoorDash SQL interviews test your ability to translate marketplace analytics questions into clean, defensible SQL. The patterns repeat: filter incomplete records, aggregate at the right grain, and choose the correct window function for the job.
The questions in this guide cover the full range: time-based percentage metrics, revenue bucketing, first-event identification using window functions, correlation analysis across aggregated groups, percentile computation, and ratio metrics with careful null handling.
Across all of them, the strongest answers share a common structure: state the grain, identify the trap, build the query in stages, and validate the result.
If you’re also prepping for broader analytics/product roles, review these product analyst interview questions next.
Share