Data Analyst Interview Questions and Answers

Categories:
 Written by:
Nathan Rosidi
In this article, we will discuss top data analyst interview questions and required skills from recent data analyst interviews at top companies.
The interview process for data analysts can be intimidating for those new to the position. The interviews typically cover a wide range of skills involving SQL, python, relational databases, statistics, probabilities, and business case analysis. While which skills companies require differs from industry to industry and company to company, having a well-rounded technical skillset will raise you considerably above the competition. One of the best ways to improve your data skills for interview questions is to leverage the interactive StrataScratch platform to practice real interview challenges and engage with a community of other data analysts.
In this article, we’ll cover some of the most important skills for data analysts and work through some data analyst interview questions on StrataScratch requiring these skills.
The Data Analyst Interviews
During the data analyst interview process, you’ll more than likely encounter technical problems where you’ll need to answer questions in a variety of formats whether they be technical or verbal. As such, it is crucial to prepare for your interviews by practicing similar questions in advance. For context, a data analyst interview may involve questions related to:

- SQL Skills
- Python and Packages
- Conceptual/Business Case Problems
- “How Do You Think” Type Questions
- Probability
- Statistics
Since the best way to internalize many of these skills is through practicing real data analyst interview questions, we’re going to cover all these concepts by answering interview questions from top companies.
Data Analyst Coding Interview Questions

SQL Coding Questions
The most important skill you’ll need to know to succeed in any data analyst interview is SQL. Therefore, we’re going to start by covering a few questions which show a broad application of common SQL abilities such as grouping, filtering, aggregating, joining, ranking, sorting, cleansing, mathematics, and subqueries.
Data Analyst Interview Question #1: Submission Types
Using GROUP BY, WHERE, HAVING, DISTINCT, and Aggregation Functions
This question by Credit Karma is a great practice example for SQL since it requires understanding the use of GROUP BY, WHERE, HAVING, DISTINCT, and aggregation functions.
Submission Types
Last Updated: January 2021
Write a query that returns the user ID of all users that have created at least one ‘Refinance’ submission and at least one ‘InSchool’ submission.
Link to the question: https://platform.stratascratch.com/coding/2002-submission-types
Ultimately, this question asks us to return which users have created at least one ‘Refinance’ and ‘InSchool’ submission for loans. We receive only one table loans which gives us a list of loans, their types, statuses, and users associated with them.
We know we’ll only need the user_ids associated with the two types of loans ‘Refinance’ and ‘InSchool’, so we’ll use a WHERE clause to filter for only these types of loans.
SELECT user_id
FROM loans
WHERE TYPE in ('Refinance', 'InSchool')
However, this doesn’t give us a unique user_id. Rather, it gives us a row for each loan having either the ‘Refinance’ or ‘InSchool’ types. In order to grab a unique user_id, we’ll GROUP BY the user_id to narrow the table down to unique user_ids. This GROUP BY will be useful later in our calculation when we need to count how many loans exist for any given user_id.
SELECT user_id
FROM loans
WHERE TYPE in ('Refinance', 'InSchool')
GROUP BY user_id
Now we only have user_ids associated with users who have either created a ‘Refinance’ or an ‘InSchool’ or both, and we need to narrow it down to users who have created at least one of both. We’ll need to use another filter for this, so we’ll use the HAVING() clause to avoid querying over our code and permitting us to leverage the count aggregation function within it. Furthermore, inside our count aggregation, we’ll use DISTINCT to ensure we’re grabbing user_ids associated with both types instead of any possible user_ids associated with the two of the same type of loan.
SELECT user_id
FROM loans
WHERE TYPE in ('Refinance', 'InSchool')
GROUP BY user_id
HAVING (count(DISTINCT TYPE) = 2)| user_id |
|---|
| 108 |
As a data analyst, you’ll often have to find unique values of data, organize them, and filter them, so the SQL functions shown in this problem make a useful addition to your skillset.
Data Analyst Interview Question #2: Activity Rank
Ranking and Sorting Data
This interview question by Google requires us to leverage the rank window functions and have a good understanding of how to order results in SQL.
Activity Rank
Last Updated: July 2021
Find the email activity rank for each user. Email activity rank is defined by the total number of emails sent. The user with the highest number of emails sent will have a rank of 1, and so on. Output the user, total emails, and their activity rank.
• Order records first by the total emails in descending order. • Then, sort users with the same number of emails in alphabetical order by their username. • In your rankings, return a unique value (i.e., a unique rank) even if multiple users have the same number of emails.
Link to the question: https://platform.stratascratch.com/coding/10351-activity-rank
This Google data analyst interview question requires a very specific presentation of your results in that you must rank the activity of all email-sending users but also order them by number of emails. Furthermore, if we encounter a set of users with the same rank, we must then sort the ties in alphabetical order.
For our analysis, we have one table google_gmail_emails of which only the from_user value is relevant since we can count over it to get the total emails. We’ll begin by counting the occurrences of each from_user (which also requires us to GROUP BY the from_user) to get a total_emails by user count.
SELECT from_user,
       count(*) AS total_emails
FROM google_gmail_emails
GROUP BY from_user
Next, we need to present a rank and order the results to give the correct answer. There is a catch, this is actually two distinct ordering steps. First, we must order by the count and the from_user within our rank window function. We use the SQL rank window function row_number() to apply a unique rank to each count in descending order without skipping ranks.
The second ordering step involves, at the end of the query, using another ORDER BY clause for the descending count and then the from_user to list it alphabetically. If we ignore either of these orderings, we’ll end up either assigning the wrong ranks to users or presenting our results in the wrong order.
SELECT from_user,
       count(*) AS total_emails,
       row_number() OVER (
                          ORDER BY count(*) DESC, from_user ASC)
FROM google_gmail_emails
GROUP BY from_user
ORDER BY 2 DESC,
         1
| from_user | total_emails | row_number |
|---|---|---|
| 32ded68d89443e808 | 19 | 1 |
| ef5fe98c6b9f313075 | 19 | 2 |
| 5b8754928306a18b68 | 18 | 3 |
| 55e60cfcc9dc49c17e | 16 | 4 |
| 91f59516cb9dee1e88 | 16 | 5 |
| 6edf0be4b2267df1fa | 15 | 6 |
| 7cfe354d9a64bf8173 | 15 | 7 |
| cbc4bd40cd1687754 | 15 | 8 |
| e0e0defbb9ec47f6f7 | 15 | 9 |
| 8bba390b53976da0cd | 14 | 10 |
| a84065b7933ad01019 | 14 | 11 |
| e22d2eabc2d4c19688 | 13 | 12 |
| 850badf89ed8f06854 | 12 | 13 |
| aa0bd72b729fab6e9e | 12 | 14 |
| 2813e59cf6c1ff698e | 11 | 15 |
| 5dc768b2f067c56f77 | 11 | 16 |
| 5eff3a5bfc0687351e | 11 | 17 |
| 75d295377a46f83236 | 11 | 18 |
| 157e3e9278e32aba3e | 10 | 19 |
| d63386c884aeb9f71d | 10 | 20 |
| 406539987dd9b679c0 | 9 | 21 |
| 6b503743a13d778200 | 9 | 22 |
| 114bafadff2d882864 | 8 | 23 |
| 47be2887786891367e | 6 | 24 |
| e6088004caf0c8cc51 | 6 | 25 |
As a data analyst, you’ll often need to present ordered and ranked data, so knowing how to use the rank window functions and the ORDER BY clause is very practical for acing the interview.
Data Analyst Interview Question #3: Highest Energy Consumption
Joining Tables and Using Subqueries
The question comes from an interview at Facebook (Meta) and has us leverage joins and subqueries.
Highest Energy Consumption
Last Updated: March 2020
Find the date with the highest total energy consumption from the Meta/Facebook data centers. Output the date along with the total energy consumption across all data centers.
Link to the question: https://platform.stratascratch.com/coding/10064-highest-energy-consumption
We’re given three datasets consisting of energy consumption data from three geographically distributed data centers. We’ll need to join them, aggregate energy consumption by date, rank them, and filter them to get the highest total energy consumption.
To start, we’ll use a UNION ALL to join the tables. The reason we’re not using other types of JOINs is due to the fact our datasets give us different sets of dates, so we want to combine them all without removing any rows. Otherwise, our later calculations will be missing crucial input data.
SELECT *
FROM fb_eu_energy
UNION ALL
SELECT *
FROM fb_asia_energy
UNION ALL
SELECT *
FROM fb_na_energy
Next, we must query over this combined data to get a sum of energy consumption and GROUP BY date. At this point, we can also use the rank window function to apply a rank to each energy aggregation. Similar to the previous problem, we need to ORDER BY a descending order of the energy consumption sums to rank correctly.
Keep in mind when you close a subquery to query over it, you need to give it a name. We call ours fb_energy in this case.
SELECT date, sum(consumption) AS total_energy,
             RANK() OVER (
                          ORDER BY sum(consumption) DESC) AS r
FROM
  (SELECT *
   FROM fb_eu_energy
   UNION ALL SELECT *
   FROM fb_asia_energy
   UNION ALL SELECT *
   FROM fb_na_energy) fb_energy
GROUP BY date
Since we need to filter for just the first rank we’ll again need to query over our existing code then apply a WHERE filter for only rank 1.
SELECT date, total_energy
FROM
  (SELECT date, sum(consumption) AS total_energy,
                RANK() OVER (
                             ORDER BY sum(consumption) DESC) AS r
   FROM
     (SELECT *
      FROM fb_eu_energy
      UNION ALL SELECT *
      FROM fb_asia_energy
      UNION ALL SELECT *
      FROM fb_na_energy) fb_energy
   GROUP BY date) fb_energy_ranked
WHERE r = 1As a data analyst, you’ll often have to leverage subqueries and joins to combine datasets and perform calculations on them you couldn’t otherwise perform on a single table.
Data Analyst Interview Question #4: Growth of Airbnb
Time Series Analysis and Mathematics
This interview question from Airbnb lets us see how we can use SQL window functions for time series analysis.
Growth of Airbnb
Last Updated: February 2018
Calculate Airbnb's annual growth rate using the number of registered hosts as the key metric. The growth rate is determined by:
Growth Rate = ((Number of hosts registered in the current year - number of hosts registered in the previous year) / number of hosts registered in the previous year) * 100
Output the year, number of hosts in the current year, number of hosts in the previous year, and the growth rate. Round the growth rate to the nearest percent. Sort the results in ascending order by year.
Assume that the dataset consists only of unique hosts, meaning there are no duplicate hosts listed.
Link to the question: https://platform.stratascratch.com/coding/9637-growth-of-airbnb
Here we need to estimate the rate of growth for Airbnb according to their specific growth formula. We’re given one table airbnb_search_details which gives us all the host data we need to calculate the growth rate.
We’ll begin by counting the numbers of hosts by year since we extract this year from date values. Note we’re using the date cast to get only the date from datetime data in host_since, and then we use the extract function to only grab the year from this date data.
SELECT extract(YEAR
               FROM host_since::date) AS YEAR,
       count(id) AS current_year_host
FROM airbnb_search_details
WHERE host_since IS NOT NULL
GROUP BY extract(YEAR
                 FROM host_since::date)
ORDER BY YEAR ASC
Next, we have to get a count for the hosts for the previous years in each row to calculate the growth rate. The LAG() function lets us grab specific data from preceding rows, and in this case we grab the previous year’s host count with it, so we have it next to the current year’s host count. We apply this by querying over our existing code to leverage its existing calculations.
SELECT YEAR,
       current_year_host,
       LAG(current_year_host, 1) OVER (
                                       ORDER BY YEAR) AS prev_year_host
FROM
  (SELECT extract(YEAR
                  FROM host_since::date) AS YEAR,
          count(id) AS current_year_host
   FROM airbnb_search_details
   WHERE host_since IS NOT NULL
   GROUP BY extract(YEAR
                    FROM host_since::date)
   ORDER BY YEAR ASC) a
Now we query over current year’s and previous year’s host data and apply the growth rate calculation. This will require some basic algebra and the round() function to present it in the way the question demands. Notice how we also float cast the results of our division to get a more accurate rate with which to round.
SELECT YEAR,
       current_year_host,
       prev_year_host,
       round(((current_year_host - prev_year_host)/prev_year_host:: FLOAT*100)) AS rate_of_growth
FROM
  (SELECT YEAR,
          current_year_host,
          LAG(current_year_host, 1) OVER (
                                          ORDER BY YEAR) AS prev_year_host
   FROM
     (SELECT extract(YEAR
                     FROM host_since::date) AS YEAR,
             count(id) AS current_year_host
      FROM airbnb_search_details
      WHERE host_since IS NOT NULL
      GROUP BY extract(YEAR
                       FROM host_since::date)
      ORDER BY YEAR ASC) a) b
| year | current_year_host | prev_year_host | estimated_growth |
|---|---|---|---|
| 2009 | 2 | ||
| 2010 | 4 | 2 | 100 |
| 2011 | 9 | 4 | 125 |
| 2012 | 10 | 9 | 11 |
| 2013 | 30 | 10 | 200 |
| 2014 | 33 | 30 | 10 |
| 2015 | 33 | 33 | 0 |
| 2016 | 28 | 33 | -15 |
| 2017 | 11 | 28 | -61 |
While lag doesn’t specifically apply to time series data, we see how useful it can be when you must perform some time series calculations. As a data analyst, you’ll often have to look at the growth or decline of data over a period of time, so it’s important to understand window functions like lag and lead.
Data Analyst Interview Question #5: DELETE and TRUNCATE
Data Cleansing
Here’s a question from Southwest Airlines that tests our knowledge of the DELETE and TRUNCATE statements both of which you may use before analyzing your date during the cleansing phase.

Link to the question: https://platform.stratascratch.com/technical/2084-delete-and-truncate
While this question requires knowledge of SQL code, it doesn’t actually require us to code a solution. The big difference between the two is the scope with which they apply and how the database would log them.
DELETE applies to a table to delete some or all of the rows and requires a WHERE clause in the latter case to specify which rows. Every row it applies to will show in the database log as an activity.
TRUNCATE, however, is faster than DELETE and deletes the whole table to which you apply it. This counts as only one action in the log.
As a data analyst, you’ll often have to work with either duplicate or irrelevant data or tables, so knowing when to use TRUNCATE or DELETE can make your pre-analysis cleansing efforts more efficient.
Python Coding Questions
Another important language to know as a data analyst is Python and its libraries. The most frequent library you’ll encounter is Pandas, so we’re going to look at some Python Pandas example interview questions related to frequency analysis and probabilities.
Data Analyst Interview Question #6: Find the number of times each word appears in drafts
Frequency Analysis
This Google data analyst interview question not only benefits from Python Pandas code but also lets us perform frequency analysis which is a pretty common task for a data analyst.
Count Occurrences Of Words In Drafts
Find the number of times each word appears in the contents column across all rows in the google_file_store dataset. Output two columns: word and occurrences.
Link to the question: https://platform.stratascratch.com/coding/9817-find-the-number-of-times-each-word-appears-in-drafts
We only have one table google_file_store at which to look which contains files and their text contents. Conceptually, we’ll need to parse the content for occurrences of each word in a draft and count them.
First, remember to import pandas before you begin coding.
import pandas as pdThen we’ll proceed by filtering for only filenames including the draft string.
draft = google_file_store[google_file_store['filename'
                          ].str.contains('draft')]
Next, we need to parse the contents by splitting them. We use expand=True within our split statement to assign each unique word to a column, so we end up with a row for each draft and a column for each word. We then stack these columns into a single column to more easily count them for a frequency analysis. We apply value_counts() to count through the rows and sum the occurrences of each discrete value. Finally, we apply reset_index() to place our counts next to the word. Our complete solution looks like this:
import pandas as pd
draft = google_file_store[google_file_store['filename'
                          ].str.contains('draft')]
result = draft.contents.str.split('\W+', expand=True).stack().value_counts().reset_index()
- The dataset has already been loaded as a pandas.DataFrame.
- print() functions and the last line of code will be displayed in the output.
- In order for your solution to be accepted, your solution should be located on the last line of the editor and match the expected output data type listed in the question.
| index | count |
|---|---|
| a | 3 |
| market | 3 |
| stock | 2 |
| exchange | 2 |
| predicts | 2 |
| The | 2 |
| bull | 2 |
| which | 2 |
| would | 2 |
| make | 2 |
| many | 2 |
| investors | 2 |
| happy | 2 |
| 2 | |
| of | 2 |
| but | 1 |
| analysts | 1 |
| warn | 1 |
| possibility | 1 |
| too | 1 |
| much | 1 |
| optimism | 1 |
| and | 1 |
| that | 1 |
| in | 1 |
| fact | 1 |
| we | 1 |
| are | 1 |
| awaiting | 1 |
| bear | 1 |
As a data analyst, you’ll need to know how to perform frequency analysis on disparate data to get total counts for your results, so the pandas operations in this example will come in handy in these cases.
Data Analyst Interview Question #7: Find the percentage of rides for each weather and the hour
Using Pandas to Calculate Probabilities
Lyft asked an interview question to find the percentage of rides based on weather and hour combinations.
Find the fraction of rides for each weather and the hour
Last Updated: February 2020
Find the fraction (percentage divided by 100) of rides each weather-hour combination constitutes among all weather-hour combinations. Output the weather, hour along with the corresponding fraction.
Link to the question: https://platform.stratascratch.com/coding/10019-find-the-probability-of-ordering-a-ride-based-on-the-weather-and-the-hour
We’re asked to calculate percentages for hour-weather combinations and receive one table lyft_rides to compute them. Really, we’ll only need the index, weather, and hour when we build out our solution.
Again, start by importing pandas. Then, we’ll proceed by calculating rides by weather and hour. We’ll group by both the weather and hour to get these combinations and count how many times each unique combination of weather and hour appears while turning our gasoline cost column into the count.
import pandas as pd

out_df = lyft_rides[['weather', 'hour', 'gasoline_cost'
                    ]].groupby(by=['weather', 'hour'],
                               as_index=False).count().rename(columns={'gasoline_cost': 'count'
        })
With the count, we can calculate the percentage by taking our counts and dividing them by the total amount of Lyft rides.
out_df['percentage'] = out_df['count'] / len(lyft_rides)Finally, we format our output using sort_values to sort first by weather and then by hour.
out_df = out_df[['weather', 'hour', 'percentage'
                ]].sort_values(by=['weather', 'hour'])
Ultimately, our solution looks like this:
import pandas as pd

out_df = lyft_rides[['weather', 'hour', 'gasoline_cost'
                    ]].groupby(by=['weather', 'hour'],
                               as_index=False).count().rename(columns={'gasoline_cost': 'count'
        })

out_df['percentage'] = out_df['count'] / len(lyft_rides)
out_df = out_df[['weather', 'hour', 'percentage'
                ]].sort_values(by=['weather', 'hour'])
out_df
- The dataset has already been loaded as a pandas.DataFrame.
- print() functions and the last line of code will be displayed in the output.
- In order for your solution to be accepted, your solution should be located on the last line of the editor and match the expected output data type listed in the question.
| weather | hour | probability |
|---|---|---|
| cloudy | 0 | 0.01 |
| cloudy | 1 | 0.01 |
| cloudy | 2 | 0.01 |
| cloudy | 3 | 0.02 |
| cloudy | 4 | 0.02 |
| cloudy | 5 | 0.01 |
| cloudy | 6 | 0.02 |
| cloudy | 7 | 0.03 |
| cloudy | 8 | 0.02 |
| cloudy | 9 | 0.01 |
| cloudy | 10 | 0.01 |
| cloudy | 11 | 0.02 |
| cloudy | 12 | 0.02 |
| cloudy | 13 | 0.02 |
| cloudy | 14 | 0.02 |
| cloudy | 15 | 0.02 |
| cloudy | 16 | 0.01 |
| cloudy | 17 | 0.02 |
| cloudy | 18 | 0.01 |
| cloudy | 19 | 0.01 |
| cloudy | 20 | 0.03 |
| cloudy | 21 | 0.02 |
| cloudy | 22 | 0.02 |
| cloudy | 23 | 0.02 |
| rainy | 0 | 0.01 |
| rainy | 1 | 0.02 |
| rainy | 2 | 0.02 |
| rainy | 3 | 0.01 |
| rainy | 4 | 0.01 |
| rainy | 5 | 0.01 |
| rainy | 6 | 0.01 |
| rainy | 7 | 0.02 |
| rainy | 8 | 0.01 |
| rainy | 9 | 0.01 |
| rainy | 10 | 0.01 |
| rainy | 11 | 0.01 |
| rainy | 12 | 0.01 |
| rainy | 13 | 0.01 |
| rainy | 14 | 0.02 |
| rainy | 15 | 0.02 |
| rainy | 16 | 0.02 |
| rainy | 17 | 0.02 |
| rainy | 18 | 0.02 |
| rainy | 19 | 0.01 |
| rainy | 20 | 0.02 |
| rainy | 21 | 0.02 |
| rainy | 22 | 0.01 |
| rainy | 23 | 0.01 |
| sunny | 0 | 0.01 |
| sunny | 1 | 0.02 |
| sunny | 2 | 0.01 |
| sunny | 3 | 0.01 |
| sunny | 4 | 0.01 |
| sunny | 5 | 0.01 |
| sunny | 6 | 0.01 |
| sunny | 7 | 0.01 |
| sunny | 8 | 0.01 |
| sunny | 9 | 0.01 |
| sunny | 10 | 0.01 |
| sunny | 11 | 0.01 |
| sunny | 12 | 0.01 |
| sunny | 13 | 0.01 |
| sunny | 14 | 0.02 |
| sunny | 15 | 0.01 |
| sunny | 16 | 0.01 |
| sunny | 17 | 0.01 |
| sunny | 18 | 0.01 |
| sunny | 19 | 0 |
| sunny | 20 | 0.01 |
| sunny | 21 | 0.01 |
| sunny | 22 | 0.01 |
| sunny | 23 | 0.01 |
As a data analyst, oftentimes, you’ll need to calculate probabilities or percentages from real data instead of conceptually as we’ll see later. Pandas can be very useful for these calculations which are, in many cases, a natural extension of the frequency analysis like we performed in the previous question.
Data Analyst Non-Coding Interview Questions

We’ve already seen with some of the previous coding examples how knowing SQL and Python techniques isn’t sufficient for most data analyst roles - you have to also be able to understand conceptually what the problem asks of you and how to present your results correctly. As such, many data analyst interviews will prompt you with questions about data which don’t require any knowledge of code but rather require you to display your knowledge of analytical processes, probabilities, and statistics.
We’re going to cover a few examples of the non-coding data analyst interview questions. We’ll look at questions related to determining how you think, outliers, missing data, probabilities, and statistics.
Data Analyst Interview Question #8: McD's Big Macs
How Do You Think?
While there are several different categories of questions meant to reveal your thought process, we’re going to focus on one of the most common types of these “How Do You Think” questions called sizing. Basically, a sizing question asks you to estimate the frequency of some event with little background about it. Remember these can be particularly tricky but knowing in advance about these questions can prime you to identify which type you hear in an interview, so you can answer it formulaically.
This sizing example from Facebook asks us to estimate how many Big Macs McDonald’s can sell each year in the US.

Link to the question: https://platform.stratascratch.com/technical/2002-mcds-big-macs
The most reasonable place to start would be with a rounded estimate for the United States’ population. Keep in mind answers here don’t need to be too precise but need to follow a logical analysis. As a population estimate, you could say, perhaps, 300 million people.
Then we can narrow this down to target audiences who are more likely to purchase Big Macs. Given younger and older people tend to eat less, we could narrow it down to college students, families, and those looking for a large, cheap meal. Now you break these target audiences down further to get a Big Macs per year for each of them to sum afterwards for the result.
We can assume college students make up 10% of the population, and they go to Mcdonald’s once per week. They won’t buy a big mac every time, though, and may instead purchase one a third of the time. So 10% * 300M * ⅓ = 10 million Big Macs per week * 52 weeks = 520 million Big Macs per year for the college student population subset.
Two-thirds of the population may consist of families of two or more people. They tend to buy for the entire household but with differing preferences between individual family members. Given Big Mac’s appeal, we’ll assume one member of a four person household purchases a Big Mac, and the family eats McDonalds once per month. ¼*⅔*300Million*12 =600M Big Macs per year for the family population subset.
For those looking for a cheap, large meal, maybe 5% of the population eats McDonald’s once per week given all their other restaurant options. We may also say they have about a third chance of choosing a Big Mac when they go to McDonald’s: .05*300M*⅓*52 = 260M big macs per year for the subset of the population looking for a cheap, large meal.
With figures for each of our population subsets, we sum our segments, 520M + 600M + 260M = 1380M Big Macs sold a year in the US.
In most cases, this would be a sufficient thought process to answer this question even if your answer is way off. Make sure to walk through it verbally with the interviewer, so they understand how you arrive at your solution. You could even mention periodic promotions such as discounts or how economic influences such as stimulus and tax rebates affect purchases for even more of an impact.
As a data analyst, you’ll often have to understand the business case behind the data and what you need to conclude from it. These “How Do You Think?” questions show you can think beyond the numbers, and, as a result, are very popular during interviews. Make sure to practice a wide variety of these questions to best prepare yourself.
Data Analyst Interview Question #9: New Observation is Outlier
Handling Outliers
This non-coding question is a Microsoft interview question related to identifying outliers.

Link to the question: https://platform.stratascratch.com/technical/2231-new-observation-is-outlier
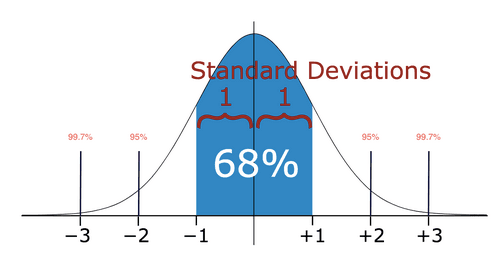
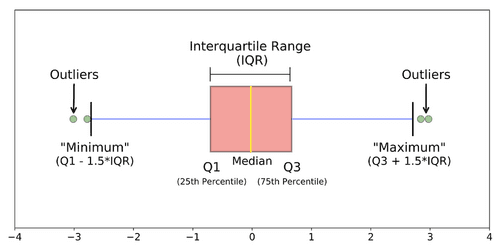
This is fundamentally a statistical question since you have to know the measure of spread to make conclusions about outliers in the dataset. Ultimately, we’ll need to look at a distribution of the data. If we use a normal distribution, we have an outlier if the data point is greater than 3 standard deviations from the mean. If we use a boxplot, we can identify an outlier if it is above or below the maximum or minimum respectively.
As a data analyst, you’ll want to present the strongest conclusion possible about your data, but outliers can severely sway your results. Therefore, before any calculations, it’s often very helpful to look at your data, find if there are any outliers, and determine if you should keep them or not for your analysis.
Data Analyst Interview Question #10: Impute Missing Information
Missing Data
During an Airbnb interview, a question surfaced about how to impute missing data.

Link to the question: https://platform.stratascratch.com/technical/2158-impute-missing-information
To answer this question with no other context, it’s important we bring up measures of center. If we have numerical data and a small part of it has missing values, we can fill in missing values with the median or mean of the data.
To determine which measure of center to use for imputation, you need to look at the distribution first. If there are many outliers in the dataset, then you’d want to use the median since it’s a more accurate measure of the center whereas the mean would bias towards the outliers. If the distribution has relatively few outliers, you can use the mean instead.
In the case of non-numerical, categorical data, you can impute the missing data with the mode, which, in these cases, means you can fill in the missing values with the most frequent categories appearing in the data.
The data you receive as a data analyst will not always be perfectly clean. You’ll typically have some missing or null values related to other variables or values you don’t want to discard, so knowing how to impute missing data can be particularly useful.
Data Analyst Interview Question #11: P-value
Hypothesis Testing
State Farm asked about p-values in one of their data analyst interview questions.

Link to the question: https://platform.stratascratch.com/technical/2043-p-value
A p-value is the probability an observed difference is due to random chance. When testing a hypothesis about some data, there are statistical calculations you can perform to calculate the p-value and determine the likelihood your hypothesis is correct or not.
The size of a dataset has no bearing on how you interpret a p-value. Regardless of dataset size, the lower the p-value, the more evidence you can reject the null hypothesis of there being no relationship between variables. However, if you have a larger dataset, the standard error would be smaller, and the p-value will typically be more robust. In other words, you can be more confident you can or can’t reject the null hypothesis with more data.
A data analyst will often have to determine if there exist a causal relationship between features of data, so you have to understand the p-value and what it tells you about your hypothesis.
Data Analyst Interview Question #12: Different Card
Probability
A Facebook interviewer asked a candidate to calculate the probability of pulling cards in a certain order.

Link to the question: https://platform.stratascratch.com/technical/2001-different-card
We’ll cover two ways to solve this probability based problem.
We’ll start with cases. We know we have to draw two cards one after the other, so there are 52P2 = 52x51 = 2652 possible card combinations.
Now, we can identify favorable cases. It’s actually easier to calculate unfavorable cases in this example, two of the same suit or same color, and subtract them from the possible cases to get the favorable cases.
From a logical standpoint, we can reduce the unfavorable cases criteria down. To start, it’s any two cards which have the same suit or the same color. However, cards of the same suit will always have the same color, so it’s easier to identify two cards of the same suit.
To calculate, first find a suit which will match 4C1 = 4 ways. Then, draw two cards from each suit of 13 cards for 13P2 = 13x12 = 156 ways. Finally, combine the two to get unfavorable cases 4x156 = 625 unfavorable cases.
Subtracting our unfavorable cases from our possible cases gets us 2652-624 = 2028 ways. Our favorable cases over our possible cases then yields our probability 2028/2652 = 13/17.
For an alternative and simpler solution, we can only match after the second card is drawn which means there are 51 cards possible to cause this match. There are 12 possible cards in the same suit which could lead to a match, so the favorable cards reduces down 51 - 12 = 39. Our probability is our favorable cards over the possible cards 39/51 = 13/17
Conclusion
In conclusion, there is a wide variety of skills and analytical techniques a data analyst must know including SQL, python, probability, statistics, and more. While we covered a broad amount of topics in this article, it’s important to continue practicing more interview questions to hone your skills and gain confidence for your data analyst interview. On the StrataScratch platform, you can take a look at more SQL interview questions, Python Interview Questions, Pandas interview questions, interview questions about probability and statistics, and other data science interview questions from top companies. Beyond these examples, there’s an active group of users who leave solutions you can use as inspiration or who can critique any solutions you publish.
Share