What is Unsupervised Learning in Machine Learning?

 Written by:
Nathan Rosidi
Unsupervised learning helps machines find patterns in unlabelled data, useful for tasks like anomaly detection, market segmentation, and image recognition.
How can machines learn from the data without being explicitly told how to perform any task?
Unsupervised learning is one of the robust techniques designed to let machines recognize what a sample of unlabelled data might be.
In this one, we will focus on Unsupervised Learning, characteristic algorithms, and some real-world examples.
Machine Learning Techniques
The techniques of machine learning can be classified under this section. We will go in-depth with each one.
Unsupervised Learning
This is a type of machine learning where an algorithm increases the understanding and knowledge about interesting characteristics hidden within data labeled as unlabelled. This indicates that the data to be provided is unclassified, with no labels for category outcomes. The algorithm searches for patterns and relationships in the data itself.
As a simple example, consider having a collection of images of possibly different animals without knowing which image contains which animal. The unsupervised learning algorithm will sort the images based on their features (such as size, shape, or color) without knowing what each animal actually is.
Supervised Learning
Supervised learning refers to a class of techniques in which the algorithm is trained on labeled data. In this case, they are paired, and each data point has an output label, so the algorithm builds a relationship to understand and predict.
Consider a dataset of animal images, where each image is accompanied by the name of the animal it represents (e.g., "cat," "dog," or "rabbit"). The algorithm uses this labeled data to learn how to identify an object in another image.
Unsupervised & Supervised Learning
The main change is in the labels. Training Data: The label on which the algorithm is trained in Supervised Learning. i.e., these will be training labels for our correct answer or target variable that we should have during training.
When an algorithm learns without labels, it is called unsupervised learning, and the algorithm works independently to understand the inherent structure of data.
If you want to know more about their comparison, check “Supervised vs Unsupervised Learning”.
Algorithms in Unsupervised Learning
Some of the core unsupervised learning algorithms are sold to seek patterns in data. Here, I will break down a few of the more basic algorithms.
K-Means Clustering
It is like sorting a pile of Mixed Candy into proper Groups according to their colors. The algorithm does this by grouping similar data points together into clusters.
These groups are termed as clusters, and the idea is that data points in the same cluster have higher similarities among them than with data points belonging to some other group.
Terms:
- Cluster: A set of similar data points.
- Centroid: The middle point within a group.
Example: Segment customers to deliver marketing campaigns to real-life Group customers based on purchasing behavior. Let's use the previous example.
Pros: capable of grouping data based on their similarities; hence, this algorithm is widely used in various applications to make data understanding easier.
When to Use: When we have unlabelled data points and need to find out which data point belongs in the same group or category without any notion of labels.
Hierarchical Clustering
Think of a hierarchical cluster as how you would organize files on your computer. You begin with individual files and later classify them into folders based on similarity. They can be put inside folders, which are inside other folders.
Terms:
- Dendrogram: A tree-like diagram depicts the partitions within the clusters.
- Use Case: Family trees, document organization by topic.
Pros: This may provide additional information than the flat clusters because it illustrates a hierarchy among clusters.
When to Use? : To examine various levels of similarity in which data points can be grouped.
Principal Component Analysis (PCA)
PCA is an integral part of unsupervised learning techniques, which can be really time-saving and quick to implement in most cases.
PCA is a way of reducing high-dimensional data to a more meaningful representation while keeping the big picture in perspective, just like downgrading the color depth of an image with a high-resolution image. It minimizes a dataset's dimension (number of features) while preserving the most important data.
Terms:
- PCA: The new axes are the principal components representing data in lower dimensionality.
- Dimensionality reduction is the process of reducing the number of random variables.
Example: Reducing the complexity of genomics or financial datasets for patterns.
Advantages: Results in more visible data and lower computational costs
When to Use?: When you have data with many features and want (a more accessible version), but not a 1:1 Times when fundamentally important info is required.
t-Distributed Stochastic Neighbor Embedding (t-SNE)
t-SNE is creating a map over terrain, displaying close points on the original plane that are also closer to each other or show a closer distance between translated vectors. It decreases high-dimension data into two or three dimensions for visualization.
Terms:
- High-Dimensional Data: A large amount of data with lots of features.
- Embedding: Mapped high-dimensional data to low dimensions.
Real-Life Example: Clustering a group of genes in biology or customer segments within the marketing world would be an example of this.
Pros: It helps you to understand and visualize the structure of high-dimensional data.
When to Use?: To plot complex, high-dimensional data to derive patterns or clusters.
Generative Adversarial Networks (GANs)
This is almost like having two artists — one who designs fake paintings and another artist to identify if those are real or part of a fake painting. Both will get better at their tasks as time goes by. Generative adversarial networks (GANs) are based on two neural networks: a generator that may produce the data and a discriminator that evaluates it.
Terms:
- Generator: It produces counterfeit data concerning real.
- Discriminator: This classifies the data as real (from the real dataset) or fake (produced by the generator).
Example: Wow, I could use it for photorealistic renders or videos. Rolling my own version of Photoshop was a huge point that made me decide.
Pros: A model can generate very realistic synthetic data and is helpful in training other models.
When to use?: Generate new data from the same distribution as a given dataset (e.g., image synthesis or data augmentation)
If you want to learn more about Machine Learning types, check it here “Machine Learning Types”.
Applications of Unsupervised Learning
Unsupervised learning algorithms can solve multiple real-world problems. This can be done with Python, and we will now go through some of these applications.
Anomaly Detection
In a nutshell, anomaly detection involves identifying items or events that do not corroborate with the norm. Algorithms like K-Means Clustering can achieve this.
Below is an example of IsolationForest in scikit-learn that can help find anomalies in a dataset. First, we create some fake data with a few outliers. The fit_predict() function returns the labels of outliers in our dataset.
Let’s see the code.
from sklearn.ensemble import IsolationForest
import numpy as np
import matplotlib.pyplot as plt

# Generate sample data
X = np.random.rand(100, 2)
X = np.concatenate([X, np.array([[0.1, 0.1], [0.9, 0.9]])])  # Add some anomalies

# Apply Isolation Forest for anomaly detection
clf = IsolationForest(contamination=0.05)
y_pred = clf.fit_predict(X)

# Plot the results
plt.scatter(X[:, 0], X[:, 1], c=y_pred, cmap='coolwarm')
plt.title('Anomaly Detection with Isolation Forest')
plt.show()
Here is the output.
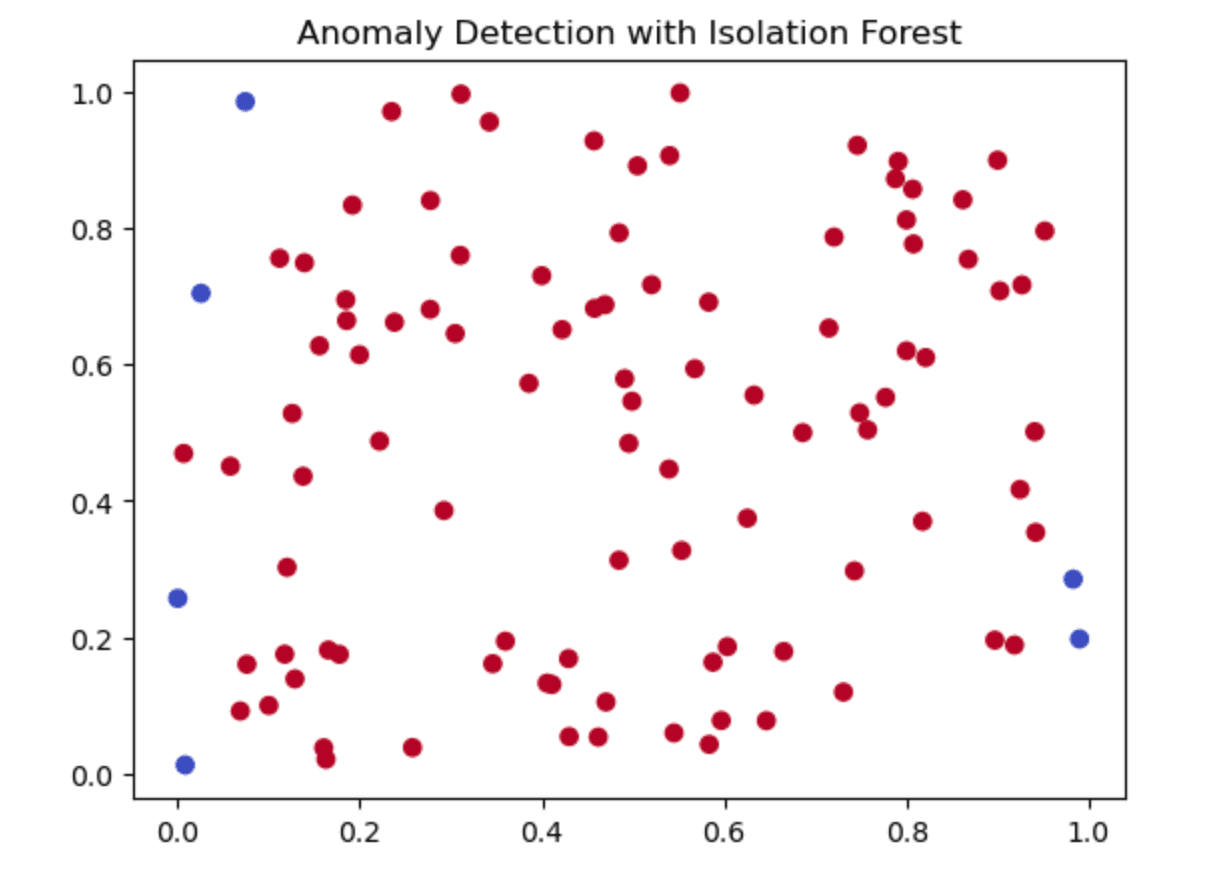
Individual data points are colored on the following output plot into two categories:
- Red dot: the algorithm has classified it as a “normal” data point.
- Blue points — anomalies detected by the algorithm
From the plot, the Isolation Forest algorithm has correctly detected some data points as anomalies (blue).
These are, as expected, significantly different from the rest of the data. This is also an example of how the algorithm can detect potential anomalous data points or unforeseen patterns within a dataset, which is very useful for many applications such as fraud detection, network security, and manufacturing.
Market Segmentation
Market segmentation involves dividing a broad consumer or business market into sub-groups based on shared characteristics. This can be done using K-Means Clustering.
Here, we use KMeans from scikit-learn to segment a market. We generate random data points representing customers and apply K-Means to group them into three clusters. The fit_predict function assigns each point to a cluster.
from sklearn.cluster import KMeans
import matplotlib.pyplot as plt
import numpy as np

# Generate sample data
X = np.random.rand(100, 2)

# Apply K-Means Clustering
kmeans = KMeans(n_clusters=3)
kmeans.fit(X)
y_kmeans = kmeans.predict(X)

# Plot the clusters
plt.scatter(X[:, 0], X[:, 1], c=y_kmeans, cmap='viridis')
centers = kmeans.cluster_centers_
plt.scatter(centers[:, 0], centers[:, 1], c='red', s=200, alpha=0.75)
plt.title('Market Segmentation with K-Means')
plt.show()
Here is the output.
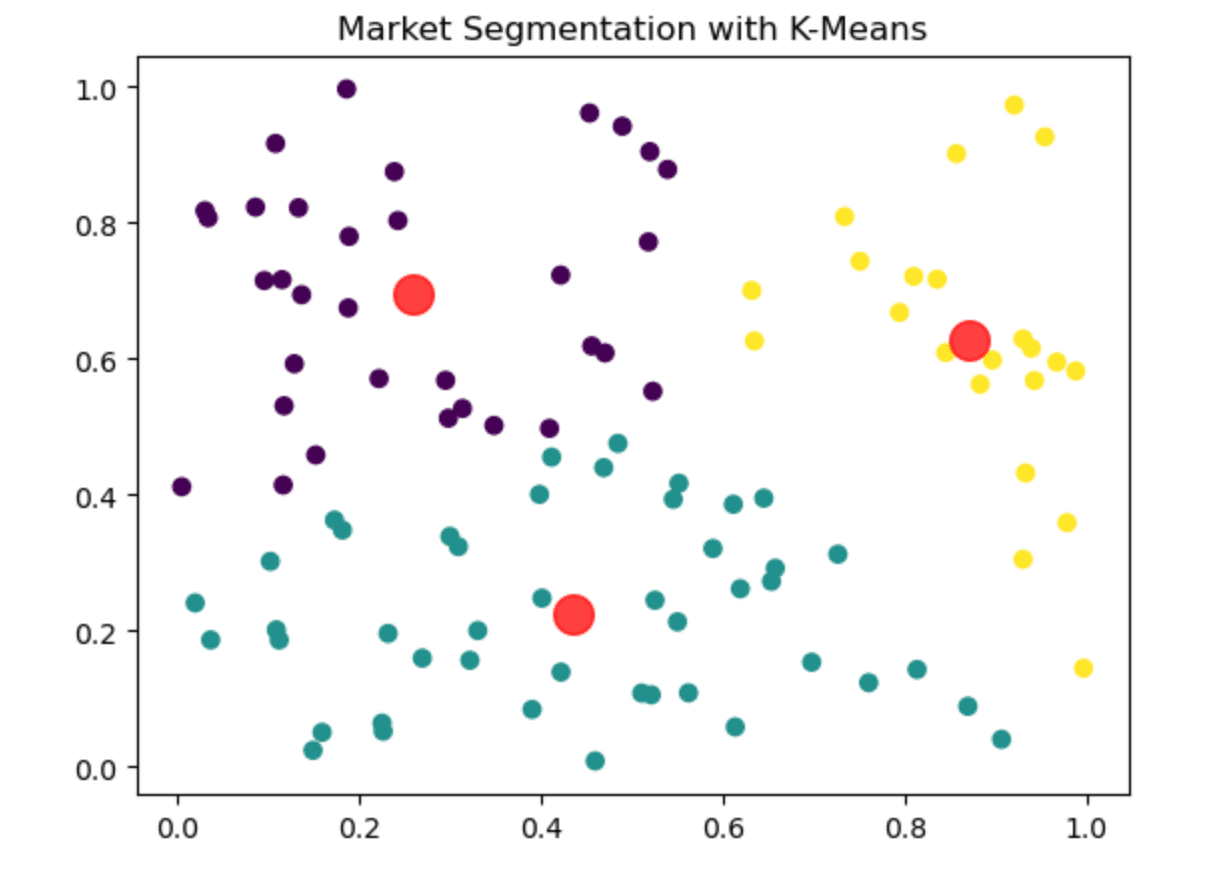
These are the data points; each point is colored according to its cluster.
- Different colored points: The K-Means algorithm identifies Points of various colors.
- Red points: Cluster centers.
Note that the K-Means algorithm has clustered the data points accurately. The red points are the centers of each cluster.
The example above shows how the algorithm segments a market by separating customers according to their buying behavior, supporting targeted marketing strategies.
Image and Speech Recognition
A powerful feature extraction tool, transforming image and speech data in a lower dimension space than the original dataset.
An example of using PCA is to reduce the dimensionality of digits.
from sklearn.decomposition import PCA
import matplotlib.pyplot as plt
from sklearn.datasets import load_digits

# Load the dataset
digits = load_digits()
X = digits.data
y = digits.target

# Apply PCA
pca = PCA(n_components=2)
X_reduced = pca.fit_transform(X)

# Plot the results
plt.scatter(X_reduced[:, 0], X_reduced[:, 1], c=y, cmap='viridis')
plt.title('PCA for Image Recognition')
plt.xlabel('Principal Component 1')
plt.ylabel('Principal Component 2')
plt.show()
Here is the output.
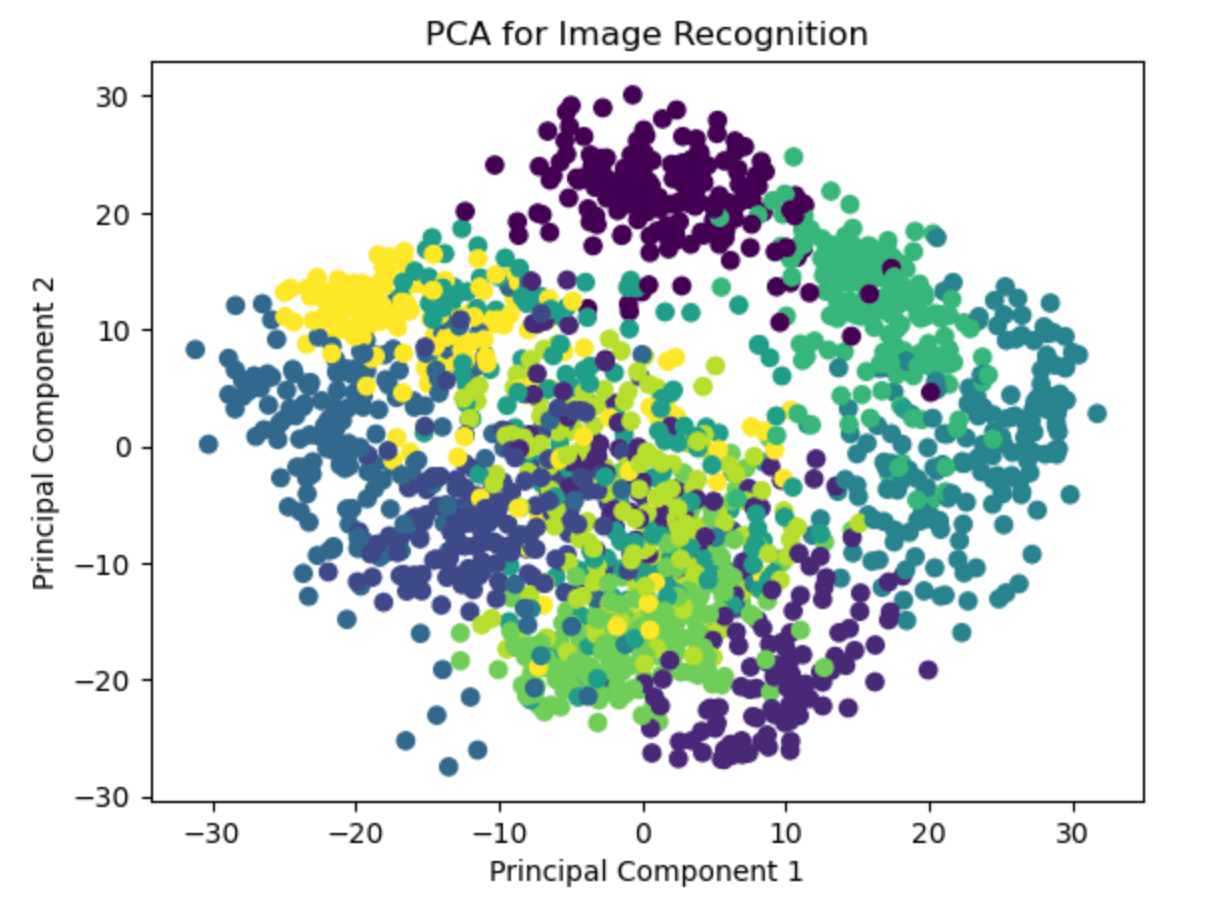
It graphs data points in different colors to represent the class images, but as they are reduced to 2 principal components, the colored dots almost overlap. To prevent the overlapping of any dot over another, a small amount is added to both x and y values, which does not ruin the relative difference between two or more components.
- The above plot shows how PCA reduces the data dimension to aid visualization and interpretation.
- The closer we get to the spectrum of a certain color, it all belongs to the same class of images, and similarly for every other color.
The PCA algorithm does a good job of taking high-dimensional image data and visualizing it in 2D space to understand the underlying structure and identify patterns for any kind of image recognition task.
Recommendation Systems
For example, a recommendation system might use algorithms such as Nearest Neighbors to form clusters of similar items or users and recommend from within the cluster.
Let's create a simple recommendation system from sci-kit-learn: NearestNeighbours here. To do this, we make some pseudo-random data for the user-item interactions and then utilize neighbors to discover a predefined number of nearest neighbors (in our case, similar items) for each user.
from sklearn.neighbors import NearestNeighbors
import numpy as np

# Generate sample data
X = np.random.rand(100, 5)  # Example user-item interaction matrix

# Apply Nearest Neighbors
nbrs = NearestNeighbors(n_neighbors=5, algorithm='ball_tree').fit(X)
distances, indices = nbrs.kneighbors(X)

# Print recommendations for the first user
print("Recommended items for the first user:")
print(indices[0])
Here is the output.

The output shows the recommended items for the first user:
- The array [0, 18, 80, 22, 34] represents the indices of the items recommended for the first user.
- These recommendations are based on the Nearest Neighbors algorithm, which finds the items most similar to those the user has already interacted with.
Here, you can observe how a recommendation system finds the most relevant items for users. This can increase the end-user experience applications offer, such as online shopping and content streaming.
If you want to learn more about unsupervised learning, check “Overview of Machine Learning Algorithms: Unsupervised Learning”.
What are the common pitfalls to avoid while applying the Unsupervised Learning Algorithm?
When applying unsupervised learning algorithms, there are several common pitfalls to avoid. Understanding and avoiding these can improve the effectiveness of your models.
Poor Data Quality
Unsupervised learning is very dependent on the input data. Just as you wouldn't expect a human to deduce useful information from an image so poor that even what it depicts in the first place needs to be clarified, no model can effectively use disparate data.
If the data is too noisy or if it contains irrelevant features, then this model may identify wrong patterns.
How to Escape? Clean and normalize your data; this is called data preprocessing. If you miss it, you may face noise, and the algorithm cannot recognize all associated or related features.
Choosing the Wrong Algorithm
Unsupervised learning algorithms can perform more complex processing tasks than supervised learning and are particularly useful for multi-dimensional or harder-to-define data types. If required, different unsupervised learning methods are best suited for different types of data. Better choice of algorithm
How to Escape?: Learn the pros and cons of every algorithm. K-Means for clustering (provided you know the number of clusters) and Hierarchical Clustering when you intend to see data hierarchy.
Incorrect Number of Clusters
This can lead to lousy grouping for clustering algorithms like K-Means.
How to Escape?: Find the correct number of clusters using the elbow method or silhouette score.
Overfitting
Overfitting is the problem of being too specific to the training set and performing poorly in generalization. Unsupervised learning algorithms still need to answer this topic.
How to Escape?: Prevent Overfitting with Cross-Validation and Dimensionality Reduction.
Ignoring Interpretability
The results of unsupervised learning can sometimes take a lot of work to interpret, especially on complex algorithms such as t-SNE or GANs.
How to Escape?: Only use algorithms that give interpretability for your problem. Tip: Plot your output to make sure it passes the smell test for your specific problem
Not Validating Results
Validation of the results is not easy because, in an unsupervised learning scenario, we need labeled data to understand clusters.
How to Escape?: Domain knowledge is critical and should be needed to verify whether algorithm-found clusters or patterns are valid. Whenever you can, collect expert opinions or confirm what you have found with other data sources
Conclusion
In this one, we’ve discovered unsupervised learning among its algorithms, including applications like Anomaly Detection, Market Segmentation, and more. Last but not least, we touched on the common pitfalls and the precautions you must take to avoid them.
Research is essential for applying what you learn. By doing data projects, you will solidify your knowledge in machine learning and data science, which will help you land the job you want in that field.
Share