Uber Data Scientist Interview Questions


Categories:
 Written by:
Vivek Sankaran
In this article, we have discussed in detail the step-by-step approach to solving the real-life Uber Data Scientist interview questions.
On a cold winter evening in Paris, Travis Kalanick and Garrett Camp could not get a ride. That is when the idea for Uber was born. Uber has now grown to become a USD 89 Billion publicly listed company operating across 900 different locations in over 60 different countries. Each day Uber completes over 10 million trips and has till date completed over 10 billion. Uber is the poster child for the gig economy and has been consistently ranked as one of the best places to work.
In this article, we discuss real-life Uber Data Scientist interview questions with detailed solutions. We look at the process behind solving these questions, and some tips on how to solve similar questions. Find more real-life data scientist questions from Uber and other top tech companies here "data scientist interview questions".
Data Science Role at Uber
Data Science & Analytics teams at Uber handle multiple functions as one would expect from a large multinational corporation. There are dedicated teams that cover various aspects of the business –
- Safety and Insurance
- Rides
- Risk
- Eats
- Policy
- Platform
- Marketing
There are different roles in these functions ranging from Product Analyst, Data Analyst, Data Scientist and Leadership.
Technical Concepts Tested in Uber Data Scientist Interview Questions
- Aggregation / Sorting
- Subqueries
- Lag and Lead
- Window Functions
- CTE
Uber Data Scientist Interview Questions
Here you can practice real-life interview questions asked by Uber in their interviews for the data scientist position.
Uber Data Scientist Interview Question #1: Maximum Number of Employees Reached
Last Updated: June 2021
Write a query that returns every employee that has ever worked for the company. For each employee, calculate the greatest number of employees that worked for the company during their tenure and the first date that number was reached. The termination date of an employee should not be counted as a working day.
Your output should have the employee ID, greatest number of employees that worked for the company during the employee's tenure, and first date that number was reached.
You can solve this question here: https://platform.stratascratch.com/coding-question?id=2046&python=
Dataset
Assumptions
This step not only gives you thinking time, but also showcases your ability to visualize data, understand the business and plot a way to the solution. This also saves a lot of time later should you make an error and end up on the wrong path. Since you typically will not have access to the underlying data in the interview, you will have to ensure that your solution boundaries are reasonably well defined.
What are the assumptions on the data and the table?
first_name, last_name and id: These three seem to be employee name and ID fields. While you can expect id to be the unique identifier, you can confirm that an employee who left the organization and joined it again had a different id. This will tell you if you need to deduplicate the data or aggregate it.
salary field can be ignored as that is not needed in the query at all.
You confirm your assumption that if the employee is still with the organization, then the termination date is null or if any special dates are posted on the system like 31 Dec 2199.
Logic
Let us break this problem down.
1. To find out the number of employees anyone worked with, it would be simple if we had a table where we had the number of employees each day starting from the inception of the company to present date. Something like this –

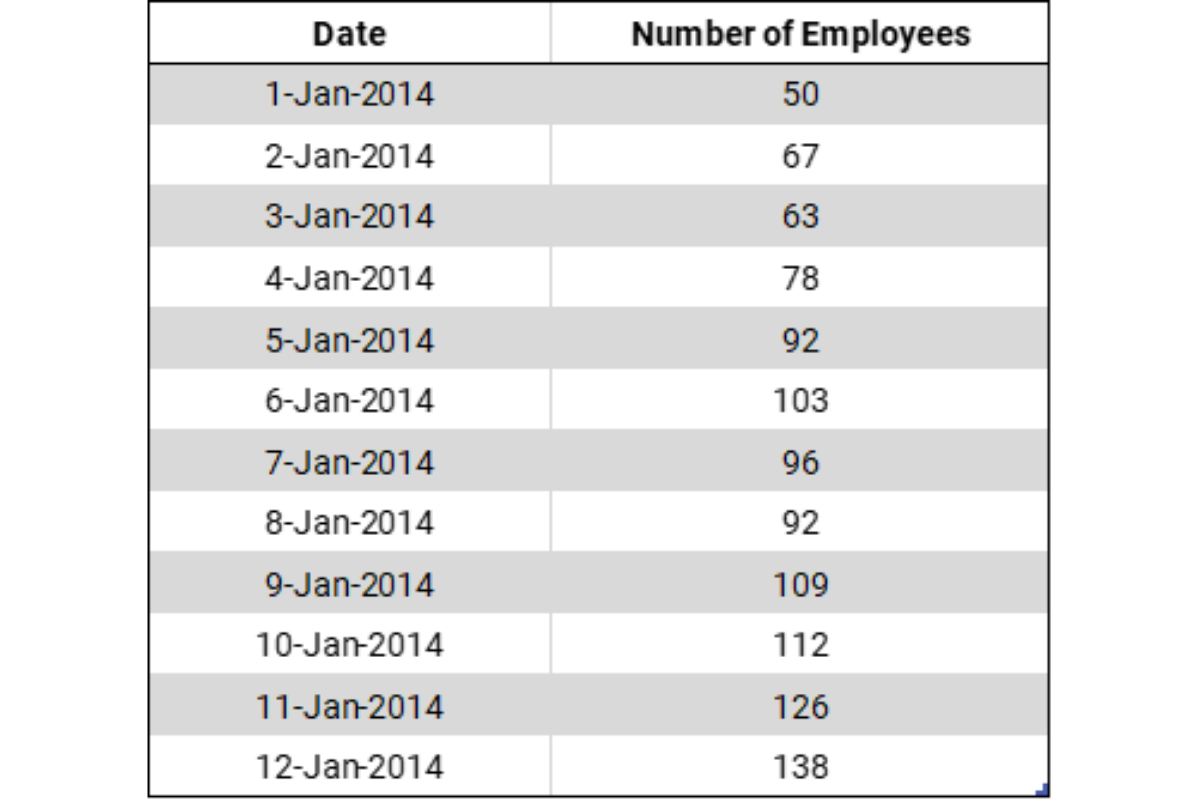
2. Then we can query the number of employees for each employee based on the hire_date and the termination_date and manipulate this sub table to get the maximum number of employees and the date when this maximum number was reached.
The table however represents snapshot data – the situation as on a particular date. If tomorrow Joe Jarod (id 2) leaves the company, the termination_date will not be updated. So, we need to transform this table.
If we combine the hire_date and termination_date fields and a counter 1 for hiring and -1 for termination, we can convert this into a daily transaction type data. Once we have that, we can query in the aforementioned manner, and get the output.
At this point, you might want to check with the interviewer if they agree with your approach. They might provide you with some edge case that you might want to incorporate to get the final output. Once you have agreed on the logic, let's begin coding.
Coding - Solution
We can do this in a step-by-step manner.
Step 1- Tag each hiring and termination date with a count (1 in case of hire and -1 in case of termination):
SELECT hire_date AS dt, 1 AS num_emp FROM uber_employees
UNION ALL
SELECT termination_date AS dt, -1 AS num_emp FROM uber_employees WHERE termination_date IS NOT NULL
Step 2- Calculate the cumulative sum of employees for each date using a window function:
SELECT dt, SUM(num_emp) OVER (ORDER BY dt) AS num_emp
FROM (
    -- Step 1 code here
) d
This step calculates the cumulative sum of employee counts for each date, giving the total number of employees working under a given employee up to that date.
Step 3- Join the main table with the cumulative employee count table:
FROM uber_employees e
JOIN (
    -- Step 2 code here
) d2
ON d2.dt >= e.hire_date AND d2.dt < COALESCE(e.termination_date, current_date)
This step joins the main table (uber_employees) with the cumulative employee count table based on the employee's hire date and termination date (or the current date if the termination date is NULL).
Step 4 - Filter the results based on the maximum number of employees working under each employee during their tenure:
WHERE d2.num_emp = (
    SELECT MAX(num_emp)
    FROM (
        -- Step 2 code repeated here
    ) d3
    WHERE d3.dt >= e.hire_date AND d3.dt < COALESCE(e.termination_date, current_date)
)
This step keeps only the rows where the employee count is equal to the maximum employee count under each employee during their tenure.
Step 5 - Deduplicate the results to get each employee's ID, maximum employees, and the first date when they had the maximum employees working under them:
SELECT DISTINCT ON (e.id) e.id, d2.num_emp, d2.dt
-- Steps 3 and 4 code here
ORDER BY e.id, d2.dt
This final step deduplicates the results based on the employee's ID and sorts the output by the employee's ID and the date, showing each employee's ID, the maximum number of employees they had working under them, and the first date when they had that maximum count.
Here is the full code.
FROM uber_employees e
JOIN (
    SELECT dt, SUM(num_emp) OVER (ORDER BY dt) AS num_emp
    FROM (
        SELECT hire_date AS dt, 1 AS num_emp FROM uber_employees
        UNION ALL
        SELECT termination_date AS dt, -1 AS num_emp FROM uber_employees WHERE termination_date IS NOT NULL
    ) d
) d2
ON d2.dt >= e.hire_date AND d2.dt < COALESCE(e.termination_date, current_date)
WHERE d2.num_emp = (
    SELECT MAX(num_emp)
    FROM (
        SELECT dt, SUM(num_emp) OVER (ORDER BY dt) AS num_emp
        FROM (
            SELECT hire_date AS dt, 1 AS num_emp FROM uber_employees
            UNION ALL
            SELECT termination_date AS dt, -1 AS num_emp FROM uber_employees WHERE termination_date IS NOT NULL
        ) d
    ) d3
    WHERE d3.dt >= e.hire_date AND d3.dt < COALESCE(e.termination_date, current_date)
)
ORDER BY e.id, d2.dt;
And there we have our desired output.
Optimization
An extremely popular follow-up data science question is -- Can you optimize the code?
What should you look out for? The main thing is condensing CTEs and subqueries or removing JOINs and using a CASE statement instead. Those are the low hanging fruits.
So, for our solution:
- Let us take a look at all the queries to see if we can condense/collapse some.
- Can we condense the identification of users that were first viewers? You can’t because you need to find their 1st streams regardless of if they were streamers or viewers. Then you need to create another query to work on top of your view. So you need to have these subqueries within subqueries.
- What are other ways to write this? You can use a CTE or a temp table.
- You then might get asked, which one performs better?
- https://dba.stackexchange.com/questions/13112/whats-the-difference-between-a-cte-and-a-temp-table/13117#13117
- Temp tables if you are going to use this for other queries.
- Temp tables can be indexed so this itself can make the query faster.
Uber Data Scientist Interview Question #2: Days Without Hiring/Termination
Last Updated: June 2021
Write a query to calculate the longest period (in days) that the company has gone without hiring anyone. Also, calculate the longest period without firing anyone. Limit yourself to dates inside the table (last hiring/termination date should be the latest hiring /termination date from table), don't go into future.
You can solve this Uber data scientist interview question here https://platform.stratascratch.com/coding/2045-days-without-hiringtermination
Dataset
This dataset is identical to the one we discussed above. This is one of the Uber Data Scientist interview questions that test your understanding of Lag and Lead functions. You can solve this interview question using CTE as well, although it is not needed here as a sub-query will suffice.
Approach:
- Get the difference in days between two consecutive hiring dates using the lag / lead functions.
- Get the maximum of this difference.
- Repeat the process with termination dates as well.
Uber Data Scientist Interview Question #3: Employees' Without Annual Review
Last Updated: June 2021
Return all employees who have never had an annual review. Your output should include the employee's first name, last name, hiring date, and termination date. List the most recently hired employees first.
You can solve this Uber data scientist interview question here - https://platform.stratascratch.com/coding/2043-employees-without-annual-review
Dataset
This additional dataset contains the date of review by employee id. Note: The emp_id field needs to be used to join with the uber_employees table, not the id field.
This question from a real-life Uber Data Scientist interview is relatively simple. It tests your SQL data manipulation skills using joins, sorting and subsetting using the select statement.
Approach
- Remove all employees with an annual review using a subquery and join.
- You can then output the required fields sorted by hire_date
Uber Data Scientist Interview Question #4: Percentage Of Revenue Loss
Last Updated: June 2021
For each service, calculate the percentage of incomplete orders along with the percentage of revenue loss from incomplete orders relative to total revenue.
Your output should include:
• The name of the service • The percentage of incomplete orders • The percentage of revenue loss from incomplete orders
You can solve this problem here - https://platform.stratascratch.com/coding/2048-percentage-of-revenue-loss
Dataset
Besides the order_date field, all the other fields will be needed in this problem.
While the dataset is straightforward, the problem is a little lengthy because of the metrics that need to be calculated. This is one of the medium difficulty level Uber Data Science interview questions that test your skills with SQL Conditional calculations. This question can be solved using multiple approaches - using a CTE, FILTER or CASE WHEN statements.
Approach
- To solve this we first need to calculate the Value per order for each service_name for Completed orders.
- Using this average, we need to assign these averages to the Cancelled orders and estimate the loss.
- Finally calculated the Revenue loss basis of the value of Cancelled orders as a % of the total possible value (Completed + Cancelled)
Uber Data Scientist Interview Question #5: Total Monetary Value Per Month/Service
Last Updated: June 2021
Find the total monetary value for completed orders by service type for every month. Output your result as a pivot table where there is a column for month and columns for each service type.
You can solve this Uber data scientist interview question here - https://platform.stratascratch.com/coding/2047-total-monatery-value-per-monthservice
Dataset
This problem uses the same uber_orders dataset used in the previous problems.
This problem is arguably easier than the previous problem with the same dataset. This real-life Uber Data Scientist interview question can be solved with CASE WHEN or FILTER functions in SQL.
Approach
- We start with Completed orders
- Then we get the month and year from the order_date field.
- Finally using conditionals CASE WHEN or FILTER functions we can get the Total Monetary Value for each service_name and aggregate them on a monthly basis.
Uber Data Scientist Interview Question #6: Total Order Per Status Per Service
Last Updated: June 2021
Uber is interested in identifying gaps in their business. Calculate the count of orders for each status of each service. Your output should include the service name, status of the order, and the number of orders.
You can solve this Uber data scientist interview question here - https://platform.stratascratch.com/coding/2049-total-order-per-status-per-service
Dataset
This problem too uses the uber_orders dataset used in the previous two problems
This problem is perhaps the easiest of the lot and a nice way to round off the practice problems. This real-life Uber Data Scientist Interview question can be solved with a simple SUM + GROUP BY combination.
Approach
Simply Sum the number_of_orders grouped by service_name and status_of_order
Conclusion
In this article, we have discussed in detail the approach to solving the real-life Uber Data Scientist interview questions. You can use a similar step-by-step approach to solving more complex problems.
Problems like this separate those with a passing knowledge of SQL from those who can understand the intricacies of data. The key to solving this problem lay in creating the transaction type sub-table. If you're wondering what other SQL interview questions are out there you might be asked in Uber interviews, check out our post Uber SQL interview questions.
Share