Uber Data Scientist Interview Question Walkthrough


Categories:
 Written by:
Nathan Rosidi
In this post, we will take a close look at a difficult data scientist interview question from Uber and walk you through a solution in Python.
In this post, we will take a close look at a difficult data scientist interview question from Uber and walk you through a solution in Python.
Uber is a relatively young company compared to other tech giants of today. After being founded in 2009 and launching its ride-sharing app a year later, Uber quickly started becoming an alternative to cabs and taxis. Today, the services of the company are available in over 500 cities worldwide.
Within its corporate branch, Uber has a dedicated Data Science and Analytics department, further divided into teams that specialize in Safety & Insurance, Rides, Risks, Policy, Platform or Marketing. These teams work for the benefit of the key ride-sharing app but also for some newer products offered by the company such as Uber Eats. The department is always on the lookout for new data scientists and product analysts and the opportunities are available in multiple locations around the globe.
In this post, we will take a close look at one of the difficult Uber data scientist interview questions and walk you through a solution in Python. It turns out that after finding just a few simple, yet clever steps, this Uber data scientist interview question becomes easier to solve.
Uber Data Scientist Interview Question
Last Updated: June 2021
Write a query that returns every employee that has ever worked for the company. For each employee, calculate the greatest number of employees that worked for the company during their tenure and the first date that number was reached. The termination date of an employee should not be counted as a working day.
Your output should have the employee ID, greatest number of employees that worked for the company during the employee's tenure, and first date that number was reached.
Link to the question: https://platform.stratascratch.com/coding/2046-maximum-number-of-employees-reached?python=1
The title of this Uber data scientist interview question is Maximum Number of Employees Reached and we are being asked to write a query that returns every employee that has ever worked for the company. Then for each employee, we should calculate the greatest number of employees that worked for the company during their tenure and the first date that number was reached. It’s decided that the termination date of an employee should not be counted as a working day.
The question also specifies that the output should have the employee ID, greatest number of employees that worked for the company during the employee's tenure, and first date that number was reached.
This is one of the hard data scientist interview questions because it involves manipulating the dates and, in essence, investigating how the number of employees changes in time.
In order to attempt to solve this Uber data scientist interview question, let’s stick to the general framework for solving data science problems. The idea is to first understand the data, then formulate the approach by writing a few general steps that can lead us to a solution, and finally, write the code based on the high-level approach.
Understand your data
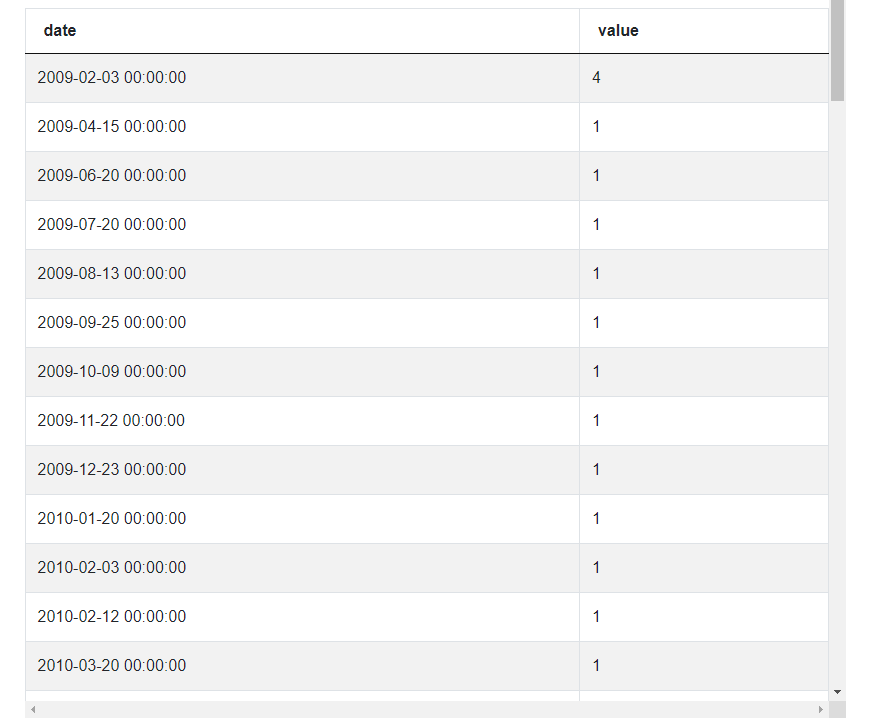
Let’s begin by looking at the data that are provided for this interview question. Usually, at an interview you won’t be given any actual records, instead, you’ll see what tables or data frames are there and what are the columns and data types in these tables. Here, however, we can preview an example of how that data may look like.
In this case, there is only one table named uber_employees and it seems to be rather simple. The table name, as well as the column names, suggest that this is a list of employees of some company and each row corresponds to one employee. Then for each of them, we are given a first name, last name, an ID, which as we can see is an integer. There are also the dates when an employee was hired and when their contract was terminated, both being the datetime data type, as well as an employee’s salary.
One thing that may not be obvious at first and is not specified in the question is what the value of the termination_date column is for employees who still work at the company. We can make an assumption about this, for example, that in these cases, the termination_date would be empty or would have a NULL value. Such an assumption would also result in us assuming that every time the termination_date column is empty or has a NULL value, the corresponding employee is still working there today.
Since no explanation is given by the question, we are allowed to make such assumptions at an interview and solve the question sticking to them, as long as we communicate these assumptions clearly to an interviewer. This first step of analysing the data is exactly the time when we should make and communicate the assumptions.
Formulate Approach
The next step, once we explored the data, is to formulate the high-level steps for solving this Uber data scientist interview question. What we will aim to do is to convert the hire and termination dates into the total number of employees on each date when it changes.
- To achieve this, the first step may be to list all dates from the hire_date column and add a new column where each row will have a value of 1. This will simply mean that on these dates, when it’s some employee’s hire date, the company gets 1 new employee, hence the value 1.
- We can do the similar thing for the termination_date column - let’s list all the dates from this column and create a new column filled with values ‘-1’. The same as previously the value 1 meant the company getting a new employee, in this case on each date being some employee’s termination date, the company is losing one employee.
- Next, we can concatenate the two lists together. In other words, we will take the list of hire_dates and append the list of termination_dates at the end. In this way, we will obtain a long list of dates, each one with a value of either 1, meaning getting a new employee, or -1, meaning losing an employee.
- As the fourth step, let’s aggregate, or group, this list we obtained by date while summing the 1 or -1 values. We’re doing this because there may have been several employees employed on the same date. Or maybe one day some employees were hired and some had their contracts terminated. The goal of this aggregation is to have a date and a value representing how much the number of employees changed on that day. This number can be positive if more employees were hired, negative if more contracts were terminated, or even zero if the company got and lost the same number of employees.
- Having the list of how the number of employees changes on different days, we will be able to calculate a cumulative sum to get the total number of employees in the company at any point in time - exactly what we were looking for. However, before doing it, it’s crucial to sort our list from the oldest to latest dates for the cumulative sum to make sense.
- Now, we have the overview of how the number of employees changes in time and we still have the dates on which any changes to this number happen. This is not far from solving the interview question. But before we can create the final answer, there’s still a small issue to solve - some employees, the ones still working in the company, don’t have any value in the termination_date column. To make further operations easier, we can replace the NULL value with today's date.
- The next step is where we actually solve this Uber data scientist interview question. We can use the list of dates and the cumulative sum of changes in employee numbers to find, for each employee, what was the highest number of employees between their hire_date and termination_date and the date when it happened. Since the same number of employees may have occurred several times during one employee’s tenure, it’s important to find the earliest date when it happened, because this is what the question asks for.
- After this step, we will already have the solution to the interview assignment so the final step will be to adjust the output to the specification from the question - to output the employee ID, the corresponding highest number of employees and the first date when that number was reached.
Code Execution
Having defined the general and high-level steps, we can now use them to write the code to solve this Uber data scientist interview question. We need to start by importing some Python libraries that I’ll be using in the code. The most important one is Pandas which is the library for manipulating data and allows to perform various operations on tables of data, similar to SQL. Another library is called datetime and I’ll use it once we need today’s date.
1 Completion Certificate from Apicius + National
Certificate from TESDA + 1 Membership certificate
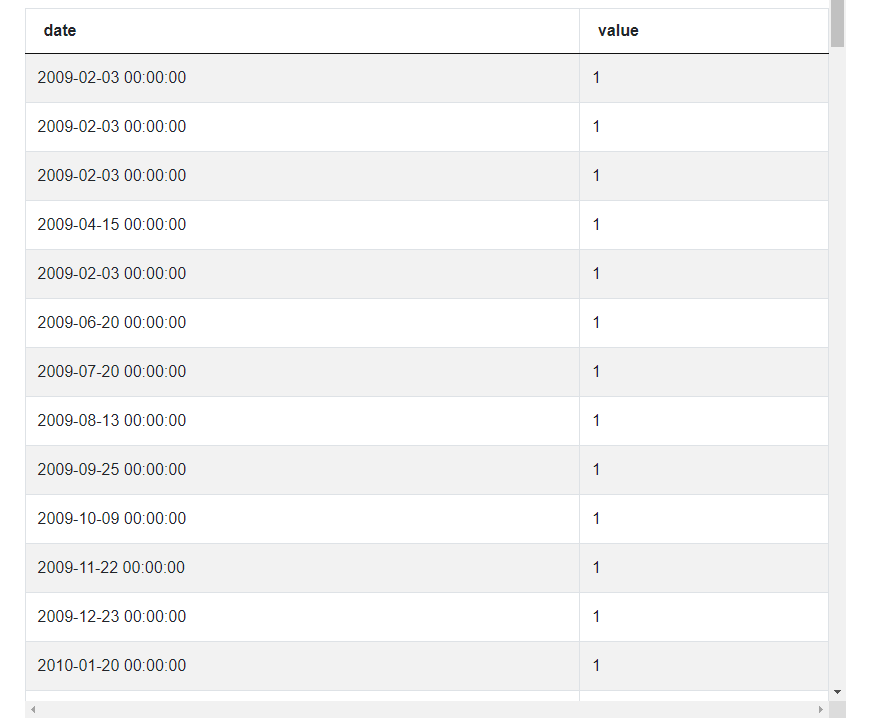
from American Culinary Federation (ACF)The first step is to list all hire_date dates and add a column with value 1. Listing the dates is not difficult because these already exist in the original table, so we can take the column ‘hire_date’ from the table uber_employee and create a new Pandas DataFrame with only this column. Let’s call this new DataFrame hired_dates
hired_dates = pd.DataFrame(uber_employees['hire_date'].rename('date'))And then to add a column filled with 1s is also quite straightforward, let’s call this new column ‘value’ and it’s enough to write that this column equals 1.
hired_dates['value'] = 1
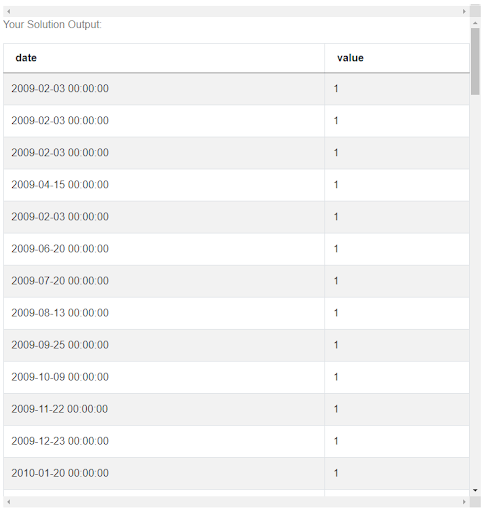
This is the result, each row in this table basically means that on this date we get one new employee. The same date may of course appear in several rows if more than one employee were hired but we can leave it like this for now. The second step, list all termination_date dates and add a column with value -1, can be solved in the same way. Creating a new DataFrame called terminated_dates based on the 'termination_date' column and creating a new column, also called ‘value’, this time filled with -1s.
terminated_dates = pd.DataFrame(uber_employees['termination_date']
.rename('date'))
terminated_dates['value'] = -1
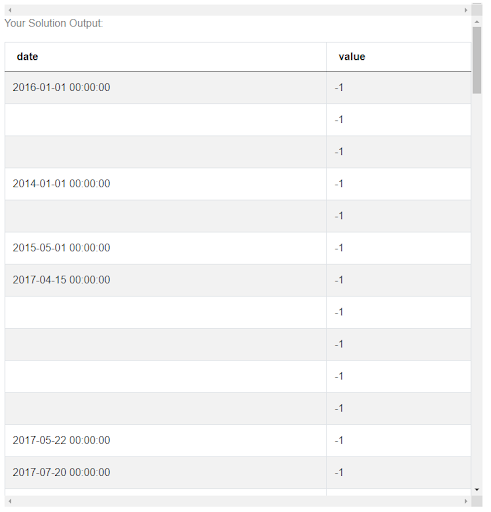
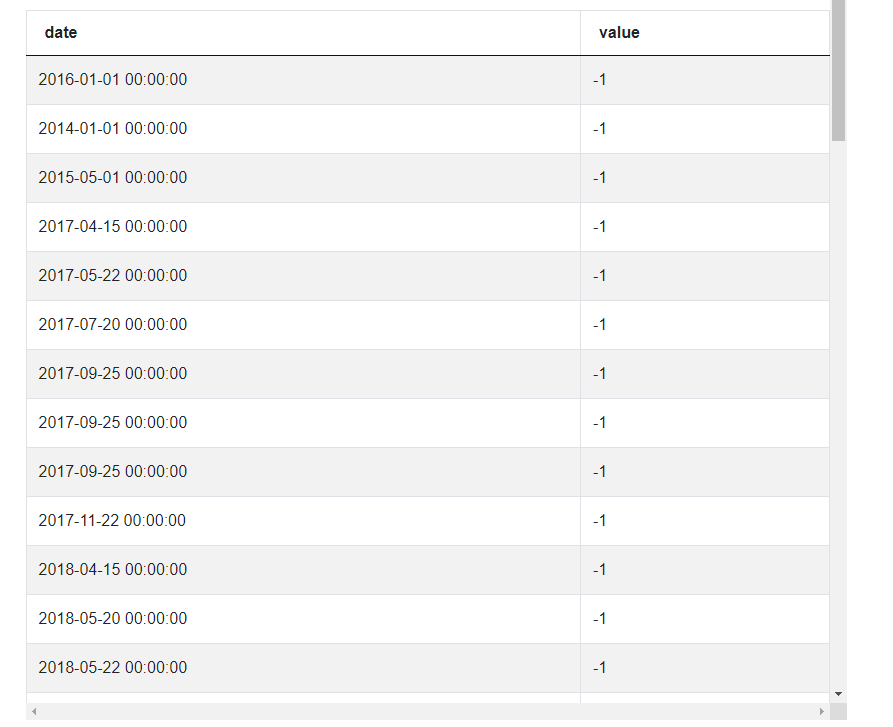
The results look similar to the previous case, but as you can see quite a lot of rows have no date. That’s because not all employees have a termination date if they still work for the company. To clean it up a bit, we can use a Pandas function .dropna() where na stands for null values, to get rid of all the rows with NULL instead of a termination_date.
terminated_dates = terminated_dates.dropna()
This looks much better and similar to the previous case, each row means that on a certain date the company loses one employee, and again, these dates may be duplicated but this is fine, we’ll take care of it later. For now, let’s move on to the third step that is ‘concatenate the lists of dates’. What we want to achieve is a single list with all the dates in one column and values of either 1 or -1 in the seconds column. In other words, we’ll be taking the hired_dates DataFrame and sticking the terminated_dates DataFrame at the bottom of it. To achieve this, let’s use the Pandas concat function.
all_dates = pd.concat([hired_dates, terminated_dates],
ignore_index=True)
We said that hired_dates and terminated_dates should be concatenated together and set the ignore_index parameter as true. This parameter tells Pandas to reset the index in the resulting DataFrame. Without it, what was the first row of hired_dates would have index 0 but what was the first row of terminated_dates will also have the same index. If we ignore or reset the index, then each row gets a unique index again. In this case, it won’t change much but it’s a good practice to set ignore_index to true in such situations.

The format of this new table all_dates is exactly as we wanted it to be. It’s time to move to the next step: aggregate the list by date. The aggregation can be performed using a Pandas groupby() function and specifying by which column the data should be aggregated.
all_dates = all_dates.groupby('date')But in addition to just aggregating, we should also specify the aggregate function that should be applied to other values in the table. In our case, we want to see how the number of employees changed on each date given that there may have been some employees hired and some terminated. The function that will help us achieve this is a SUM() function because we want to add together all the 1 and -1 values for each date.
all_dates = all_dates.groupby('date').sum()Now, the column with dates disappears from the output because it became an index of the table and the index is not shown to us right now. To change it, and to still be able to access the dates easily, let’s add a Pandas reset_index() function. It works similarly to the igonre_index parameter we saw earlier but now it’s much more important to actually use it. In general, when aggregating data in Pandas it’s a good practice to always apply the reset_index() function to the result.
all_dates = all_dates.groupby('date').sum().reset_index()
Looking at the results, we can see that there are no longer duplicates of dates. These values represent the change in number of employees on each day. For example, on February 3rd 2009, the company got 4 more employees and on April 15th there was 1 more employee than a day before. On July 20th 2013 the same number of employees were hired and terminated, so the change is 0. And it can also be negative if on some day more contracts were terminated than new employees hired.
Moving on to the next step, it is time to order the list by date and apply cumulative sum. Ordering is rather simple - it can be done using a Pandas function sort_values() and specifying which column should be sorted. This function will sort the value in ascending order, or from oldest to latest, by default, so there is no need to add any other parameters.
all_dates = all_dates.sort_values('date')And calculating the cumulative sum is also rather straightforward because once again, there exists a Pandas function that will do it for us. We just need to apply it to the ‘value’ column and let’s store the results in a new column called ‘emp_count’ for employees count.
all_dates['emp_count'] = all_dates['value'].cumsum()
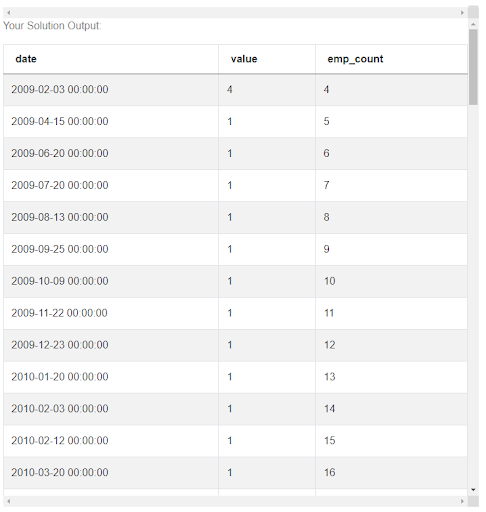
Now, apart from just a change in the number of employees, we can also see the actual number of employees on a given day. And it follows the previous values which specify by how much it increases, or decreases, or sometimes stays the same.
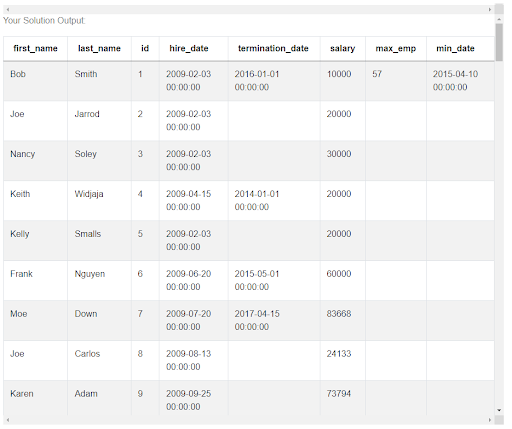
Having prepared the overview of the number of employees in time, we can now look at each employee separately and use our list to extract the necessary information for them, namely the maximum number of employees during their tenure and the date when it occurred. To make things easier to explain, let’s only do it for the first employee in the table for now, so the employee with index 0.
The first thing to do is to check if this employee has a termination_date and, if not, replace the NULL value with today’s date. And it doesn’t really matter if this first employee has termination_date or not, we will write an IF statement that will cover us in both cases. To check what is the value of the termination_date column for an employee with index 0, we can use a Pandas .at attribute like that:
if uber_employees.at[0, 'termination_date']And now we want to say that if this value is NULL, then we want to do something. Since this value is in a Pandas DataFrame, we will need to use a Pandas null value for comparison by writing pd.NaT:
if uber_employees.at[0, 'termination_date'] is pd.NaT:What do we do when an employee doesn’t have a termination_date? We want to switch this NULL value to today’s date. Let’s create a new variable, called end_date and let’s use the datetime library to get the date of today. We write dt.datetime.today() because we're using a library datetime that was imported in the beginning with an alias ‘dt’, then the module datetime of this library, the same name, and finally its function today().
if uber_employees.at[0, 'termination_date'] is pd.NaT:
    end_date = dt.datetime.today()
This is what happens when an employee has no termination_date, but if they have one, then the end_date variable should just be equal to this termination_date, so we can say that else, and use the .at attribute again the same way as before.
if uber_employees.at[0, 'termination_date'] is pd.NaT:
    end_date = dt.datetime.today()
else:
    end_date = uber_employees.at[0, 'termination_date']
We can run this code and see what the end_date variable has become and it’s January 1st 2016 because it’s the termination_date of the first employee in the table. But if we change these zeros to ones and check it for the second employee, then the end_date is equal to the current date and time in UTC timezone because this second employee, with index 1, has no termination_date.
Before we continue, let’s also create a new variable for start_date equal to hire_date, so that we can easily access it the same way as the end_date. We assume that all employees have some hire_date, so no IF statement is necessary.
start_date = uber_employees.at[0, 'hire_date']Creating this variable is not mandatory but we’ll need to use the hire_date of employees a few times and without this variable, we’d need to write the whole uber_employees.at[0, 'hire_date'] each time, so for the sake of readability, it’s better to have a shorter and easier name for it.
The next step is to find the maximum in the cumulative sum between their hire_date and termination_date and we’re still doing it only for the first employee. We can start by saying that we want to get a portion of the all_dates table, such that the column date of the all_dates table should be between the start_date and end_date - the two variables that we defined.
max_emp_count = all_dates[all_dates['date'].between
(start_date, end_date)]
This will give us the entire all_dates table but only dates between 2009 when this first employee was hired and January 2016 when their contract was terminated. And from this, we need to extract the maximum employee count. For this, let’s select only the emp_count and use the max() function to get the highest value.
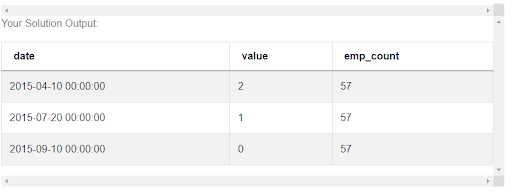
max_emp_count = all_dates[all_dates['date'].between
(start_date, end_date)]['emp_count'].max()
It appears that the number is 57. If we come back to the original table, we can see that the values go up to 57. The value 58 also appears in the data but only after January 2016 when this employee stopped working for the company, so the value 57 is correct in this case. Let’s add it to the uber_employees table so that it’s associated with this employee, in a new column called max_emp.
uber_employees.at[0, 'max_emp'] = max_emp_count
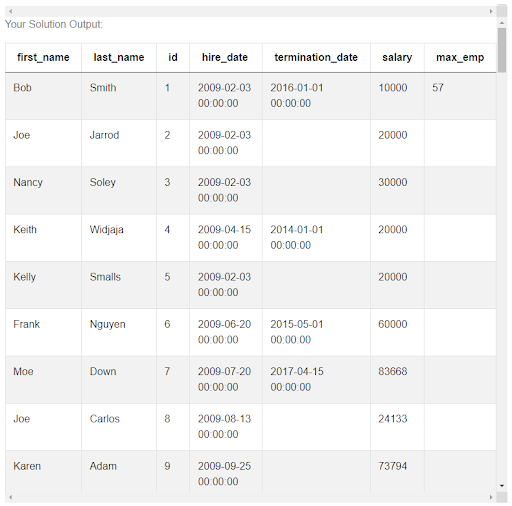
And looking at the uber_employees table, we can see that this value has been saved for this first employee. But there’s still one thing to do, namely find the earliest date corresponding to this maximum number of employees. Clearly, we can do it by filtering the all_dates table as before by saying that we want this portion of the table where the emp_count column of the all_dates table is equal to the max_emp_count value that we found.
earliest_date = all_dates[(all_dates['emp_count'] == max_emp_count)]
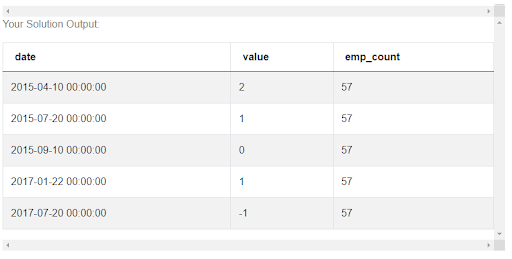
But this is not enough. As you can see this returned a number of dates, including some dates from when this employee was not working in the company anymore. So let’s add one more condition to say that apart from column emp_count being equal to max_emp_count, at the same time the column ‘date’ of all_dates table, needs to be between start_date and end_date. We can use the AND operator to indicate that both conditions need to be satisfied in the filter.
earliest_date = all_dates[(all_dates['emp_count'] == max_emp_count)
& (all_dates['date'].between(start_date, end_date))]
Now we’re left with dates when the number of employees became 57 and that happened during the tenure of the first employee. But there are still 3 dates. The question tells us that we should return the earliest date. To obtain it, we can select only the ‘date’ column from this result and apply a min() function to it that will return the smallest value a.k.a. the earliest date.
earliest_date = all_dates[(all_dates['emp_count'] == max_emp_count)
& (all_dates['date'].between(start_date, end_date))]['date'].min()
Again, same as with the maximum number of employees, we can store this date in the uber_employees table in a column min_date.
uber_employees.at[0, 'min_date'] = earliest_date
Looking once again at the uber_employees table, we can see that it worked and for the first employee we have both the maximum number of employees and the earliest date when it happened. But before we can move on to the final step, we still need to get these values for all the other employees. Luckily, we can use the code that we’ve just written and put it in a loop. Let’s put a FOR loop opening statement before the IF statement and everything from the IF statement up until the end will be inside the loop by adding a tabulation - that’s how we indicate an inside of a loop in python.
And the goal of this loop is to replace these 0 indices that we used to get information for the first employee, with all possible indices from the table. Let’s create a variable i that will be switching a value with each loop iteration. This i needs to take values from 0 to the last index of the uber_employees table. To get the last index, or the length of the uber_employees table, we can use the shape attribute.
uber_employees.shapeIt returns [100, 8] meaning that this table has 100 rows and 8 columns. This means that the indices also go up to 100 so we’re only interested in this first value. This [100, 8] is a list so we can select the first value like that.
uber_employees.shape[0]But when initiating the loop, it’s not enough to say that the variable i should be able to, in this case, a number 100. We need to turn this 100 into all numbers from 0 to 100. We can use a Python range() function for that. This will create a list of values between 0 and 100 and to define the loop we can say that i should be in this range.
for i in range(uber_employees.shape[0]):And the last thing to do is changing all these zeros that we used to get data about the first employee, to this variable i that will change its value with each iteration of the loop, thus repeating the same process for every employee. Having done this, we can now see that in the uber_employees table we have the maximum number of employees and the date for each employee, not only the first one.

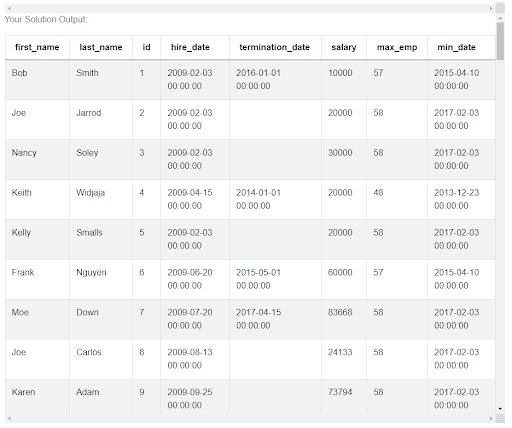
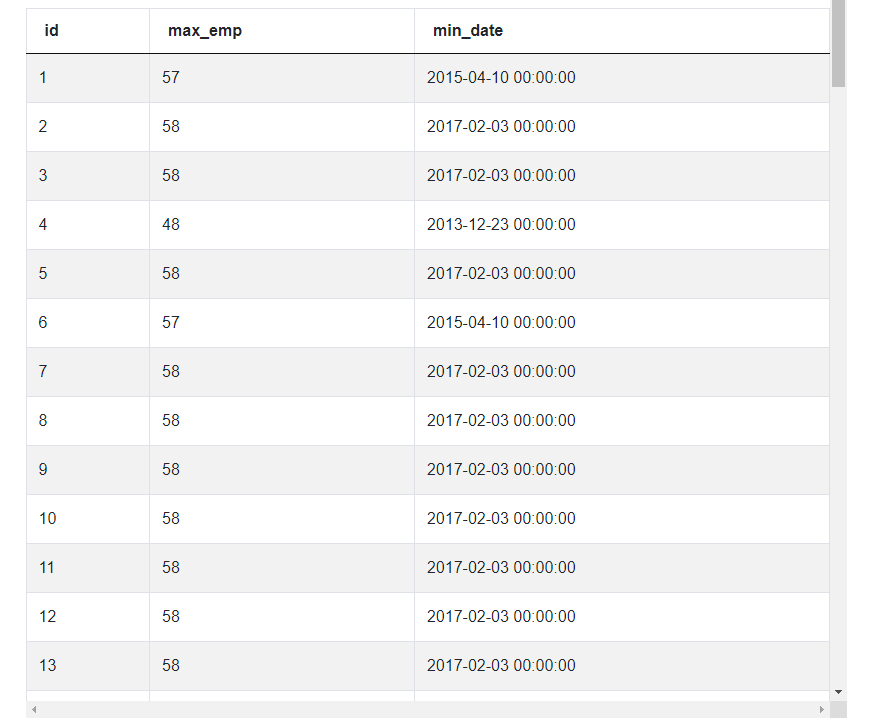
But we can also see that this table still has quite a few columns. That’s why we have this last step in which we adapt the output to what is expected by the question. We are being asked to output the employee ID, the corresponding highest number of employees and the date, so we can filter the table leaving only id, max_emp and min_date columns.
result = uber_employees[['id', 'max_emp', 'min_date']]
And this is it, the complete and correct solution for this interview question.
import pandas as pd
import datetime as dt

hired_dates = pd.DataFrame(uber_employees['hire_date'].rename('date'))
hired_dates['value'] = 1

terminated_dates = pd.DataFrame(uber_employees['termination_date'].
rename('date'))
terminated_dates['value'] = -1
terminated_dates = terminated_dates.dropna()

all_dates = pd.concat([hired_dates, terminated_dates], ignore_index=True)
all_dates = all_dates.groupby('date').sum().reset_index()
all_dates = all_dates.sort_values('date')
all_dates['emp_count'] = all_dates['value'].cumsum()


for i in range(uber_employees.shape[0]):
    if uber_employees.at[i, 'termination_date'] is pd.NaT:
        end_date = dt.datetime.today()
    else:
        end_date = uber_employees.at[i, 'termination_date']

    start_date = uber_employees.at[i, 'hire_date']

    max_emp_count = all_dates[all_dates['date'].between(start_date, end_date)]
['emp_count'].max()

    uber_employees.at[i, 'max_emp'] = max_emp_count

    earliest_date = all_dates[(all_dates['emp_count'] == max_emp_count)
& (all_dates['date'].between(start_date, end_date))]['date'].min()

    uber_employees.at[i, 'min_date'] = earliest_date

result = uber_employees[['id', 'max_emp', 'min_date']]
Conclusion
In this post, you could see the explanation and learn how to solve one of the difficult Uber data scientist interview questions using Python. This is one possible solution to this problem, but there are also other approaches and solutions. The good advice is to practice answering the interview questions by constructing solutions to them but always try to think of other ways to solve them, maybe you’ll come up with a more efficient or more elaborate approach. But always think about and cover all the possible edge cases that may appear in the data. Check out our previous post "Uber Data Scientist Interview Questions" to find more questions from the Uber company. Also, if you want a comprehensive overview of the types of Python interview questions asked in Data Science Interviews at top companies like Amazon, Google, Microsoft, etc., check out this "Top 30 Python Interview Questions" post.
Share