Types of Window Functions in SQL and Questions Asked by Airbnb, Netflix, Twitter, and Uber

Categories:
 Written by:
Nathan Rosidi
What are window functions in SQL and their types? Questions related to SQL window functions asked by Airbnb, Netflix, Twitter, and Uber.
What are Window Functions in SQL?
Window functions in SQL are a group of functions that performs calculations across a set of rows that are related to your current row. They are also considered as advanced SQL functions and are often asked in data science interviews. A data scientist or business analyst uses these functions on a daily basis to solve many different types of data problems.
Let’s summarize the 4 most popular types of window functions in SQL and cover the ‘why’ and ‘when’ you can use them.
4 Types of Window Functions in SQL
- Regular Aggregate Functions: (i) Aggregates like AVG, MIN/MAX, COUNT, SUM, (ii) These functions are used to aggregate your data and group it by another column like month or year
- Ranking Functions: (i) ROW_NUMBER, RANK, RANK_DENSE, (ii) These are the functions that help you rank your data. You can either rank your entire dataset or rank them by groups like by month or country, (iii) Extremely useful to generate ranking indexes within groups
- Generating Statistics: (i) These are useful if you want to generate simple statistics like NTILE (percentiles, quartiles, medians), (ii) This can be used for your entire dataset or by group
- Handling Time Series Data: (i) A very common window function in SQL especially if you need to calculate trends like a month-over-month rolling average or a growth metric, (ii) LAG and LEAD are the two functions that allow you to do this.
For a video tutorial on window functions in SQL and how to work through each example of these window functions, head over to this Youtube video:
1. Regular Aggregate Functions
Regular aggregate functions are the functions like average, count, sum, min/max that are applied to columns. The goal of these functions is to apply the aggregate function if you want to apply aggregations to different groups in the dataset, like month.
This is similar to the type of calculation that can be done with an aggregate function that you’d find in the SELECT clause, but unlike regular aggregate functions, window functions do not group several rows into a single output row, they are grouped together or retain their own identities, depending on how you find them.
Sum() Function Example:
Let’s take a look at one of the sum() window functions in SQL examples implemented to answer a data analytics question. You can view the SQL question on the Sum function by Uber and write your code.
This is a perfect example of using a SQL window function and applying a sum() to a month group. Actually, there are two examples.
In the first one, we are trying to calculate the total distance by month. The result is divided by the output of the second window function example. This one calculates the total cost by month.
This is hard to do in SQL without the sum() window function. We have applied the sum() window function to the 3rd column, where we have found the distance-to-cost ratio for every month-year in the dataset.
| request_mnth | dist_to_cost | monthly_dist_to_cost |
|---|---|---|
| 2020-01 | 10.76 | 5.61 |
| 2020-01 | 4.12 | 5.61 |
| 2020-02 | 4.5 | 5.81 |
| 2020-02 | 7.66 | 5.81 |
| 2020-03 | 3.48 | 5.95 |
Let's write the code now to implement the SQL window function:
SELECT request_mnth,
       ROUND(AVG(mean_deviation), 2) AS difference
FROM
  (SELECT request_mnth,
          ABS(dist_to_cost-monthly_dist_to_cost)::DECIMAL AS mean_deviation
   FROM
     (SELECT TO_CHAR(request_date::DATE, 'YYYY-MM') AS request_mnth,
             distance_to_travel/monetary_cost AS dist_to_cost,
             SUM(distance_to_travel) OVER (PARTITION BY TO_CHAR(request_date::DATE, 'YYYY-MM')) / SUM(monetary_cost) OVER (PARTITION BY TO_CHAR(request_date::DATE, 'YYYY-MM')) AS monthly_dist_to_cost
      FROM uber_request_logs) a) b
GROUP BY request_mnth
2. Ranking Functions
Ranking functions are an important utility for data scientists. You always rank and index your data to better understand which rows are the best in your dataset. Window functions in SQL give you three ranking utilities - RANK(), DENSE_RANK(), ROW_NUMBER() - depending on your exact use case. These ranking functions will help you list your data in order and groups based on what you desire.
Rank() Function Example:
Now, let’s take a look at one ranking() window function example to see how we can rank data within groups using window functions in SQL. Follow along interactively with this interview question on Ranking functions by Twitter.
In this example, we have to find the top salaries by department, and we can’t just find the top 3 salaries without a window function because it will just give us the top 3 salaries across all departments. So, we need to rank the salaries by departments individually. This can be done by rank() and partitioned by the department. From there, it’s easy to filter for the top 3 across all departments.
| department | salary | rank_id |
|---|---|---|
| Audit | 110000 | 1 |
| Audit | 100000 | 2 |
| Audit | 70000 | 3 |
| Management | 250000 | 1 |
| Management | 200000 | 2 |
Let's write the code to output the final table.
SELECT department,
       salary
FROM
  (SELECT department,
          salary,
          RANK() OVER (PARTITION BY a.department ORDER BY a.salary DESC) AS rank_id
   FROM
     (SELECT distinct department,
             salary
      FROM twitter_employee
      ORDER BY department, salary) a
   ORDER BY department, salary DESC)b
WHERE rank_id < 4
3. Generating Statistics - NTILE
NTILE is a very useful window function for data analysts, business analysts, and data scientist. When there is a deadline with statistical data, you often need to create robust statistics such as quartile, quintile, median, decile in your daily job, and NTILE makes it easy to generate these outputs.
NTILE function takes an argument of the number of bins (or basically how many buckets you want to split your data into), and then creates this number of bins by dividing your data into that many number of bins. You set how the data is ordered and partitioned, if you want additional groupings.
NTILE(100) Example:
In this example, we will learn how to use NTILE to categorize the data into percentiles. Follow along interactively through the interview question using NTILE.
Here you have to identify the top 5 percent of claims based on a score an algorithm outputs. But you can’t just find the top 5% and do an ORDER BY because you want to find the top 5% by state. So, we have one way to do this and that is using an NTILE() ranking function and then PARTITION by the state. You can then apply a filter in the WHERE clause to get the top 5%.
| policy_num | state | claim_cost | fraud_score | percentile |
|---|---|---|---|---|
| ABCD1027 | CA | 2663 | 0.99 | 1 |
| ABCD1079 | CA | 4224 | 0.96 | 2 |
| ABCD1016 | CA | 1639 | 0.96 | 3 |
| ABCD1081 | CA | 1080 | 0.95 | 4 |
| ABCD1021 | CA | 4898 | 0.95 | 5 |
Here’s the code to get output the entire table above.
SELECT policy_num,
       state,
       claim_cost,
       fraud_score,
       percentile
FROM
  (SELECT *,
          NTILE(100) OVER(PARTITION BY state
                          ORDER BY fraud_score DESC) AS percentile
   FROM fraud_score) a
WHERE percentile <=5
4. Handling Time Series Data
LAG and LEAD are two SQL window functions that are useful for dealing with time series data. LEAD() is similar to LAG() but the only difference between LAG and LEAD window functions is whether you want to grab from the previous rows or following rows, almost like sampling from previous data or future data.
You can use LAG and LEAD window functions to calculate month-over-month growth or rolling averages. As a data scientist and business analyst, you always need to deal with time-series data and creating the time metrics.
LAG() Example:
In this example, we have to find the percentage growth year-over-year, which is a very common question that data scientists and business analysts deal with on a daily basis. The problem statement, data, and SQL editor is in the following link, we suggest you to try to code the solution on your own: SQL interview question on Time Series Data
What is hard about this problem is the data is set up -- you need to use the previous row’s value in your metric. But SQL isn’t built to do that. SQL is built to calculate anything you want as long as the values are on the same row. So we can use the lag() or lead() window function which will take the previous or subsequent rows and put it in your current row which is what this question is doing.
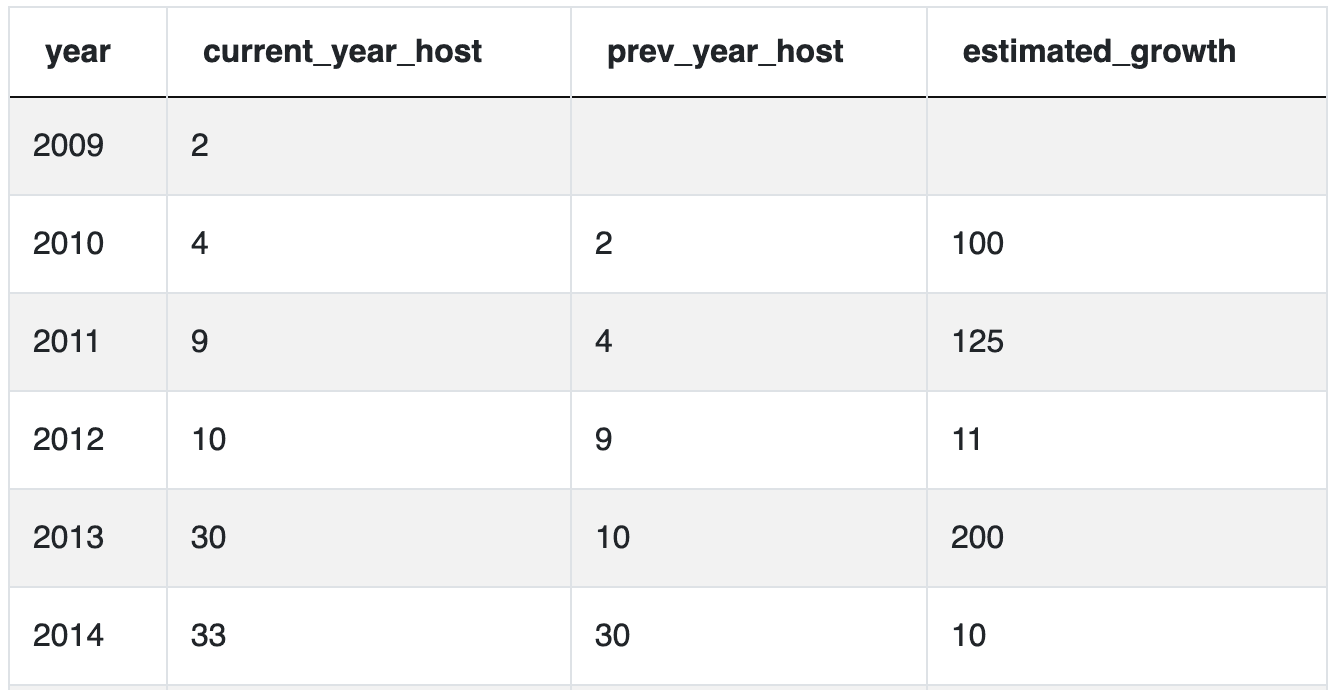
Here’s the code to output this table.
SELECT year,
       current_year_host,
       prev_year_host,
       round(((current_year_host - prev_year_host)
       /(cast(prev_year_host AS numeric)))*100) estimated_growth
FROM
  (SELECT year,
          current_year_host,
          LAG(current_year_host, 1) OVER (ORDER BY year)
          AS prev_year_host
   FROM
     (SELECT extract(year
                     FROM host_since::date) AS year,
             count(id) current_year_host
      FROM airbnb_search_details
      WHERE host_since IS NOT NULL
      GROUP BY extract(year
                       FROM host_since::date)
ORDER BY year) t1) t2Conclusion
Window functions in SQL are very useful as a data scientist on your daily job and are often asked by the interviewers in interviews. These SQL window functions are used to solve rankings and calculating growth problems and these window functions in SQL make those problems much easier than if you didn’t have these functions. Also, check out our Ultimate Guide to SQL Window Functions which is a complete overview of the types of SQL window functions, their syntax and real-life examples of how to use them in queries.
Share