The 10 Most Useful Data Analysis Tools for Data Scientists

Categories:
 Written by:
Zulie Rane
All of these data analysis tools will help you do your job better and potentially move forward on your journey to becoming a data scientist.
Data analysis is a catchall word for any kind of poking, prodding, or manipulating of data you might do. Wikipedia helpfully defines data analysis as “a process of inspecting, cleansing, transforming, and modeling data with the goal of discovering useful information, informing conclusions.”
So, you know, poking and prodding.
Quick note: Data analysts are often on the data science career path, which is why their job roles sound similar. A lot of these data analysis tools will help you develop data scientist skills, too. So if you want to know how to become a data scientist, this article will be useful!
How data analysis tools can help you in your data science career path
Back in the day, data analysis was much easier because the amount of data you were working with would be much smaller. Today, you need data analysis tools to get to grips with what you’re looking at. Alongside applying your data analyst technical skills, you should also rely on these data analysis tools to help you make sense of the masses of data flowing at you.
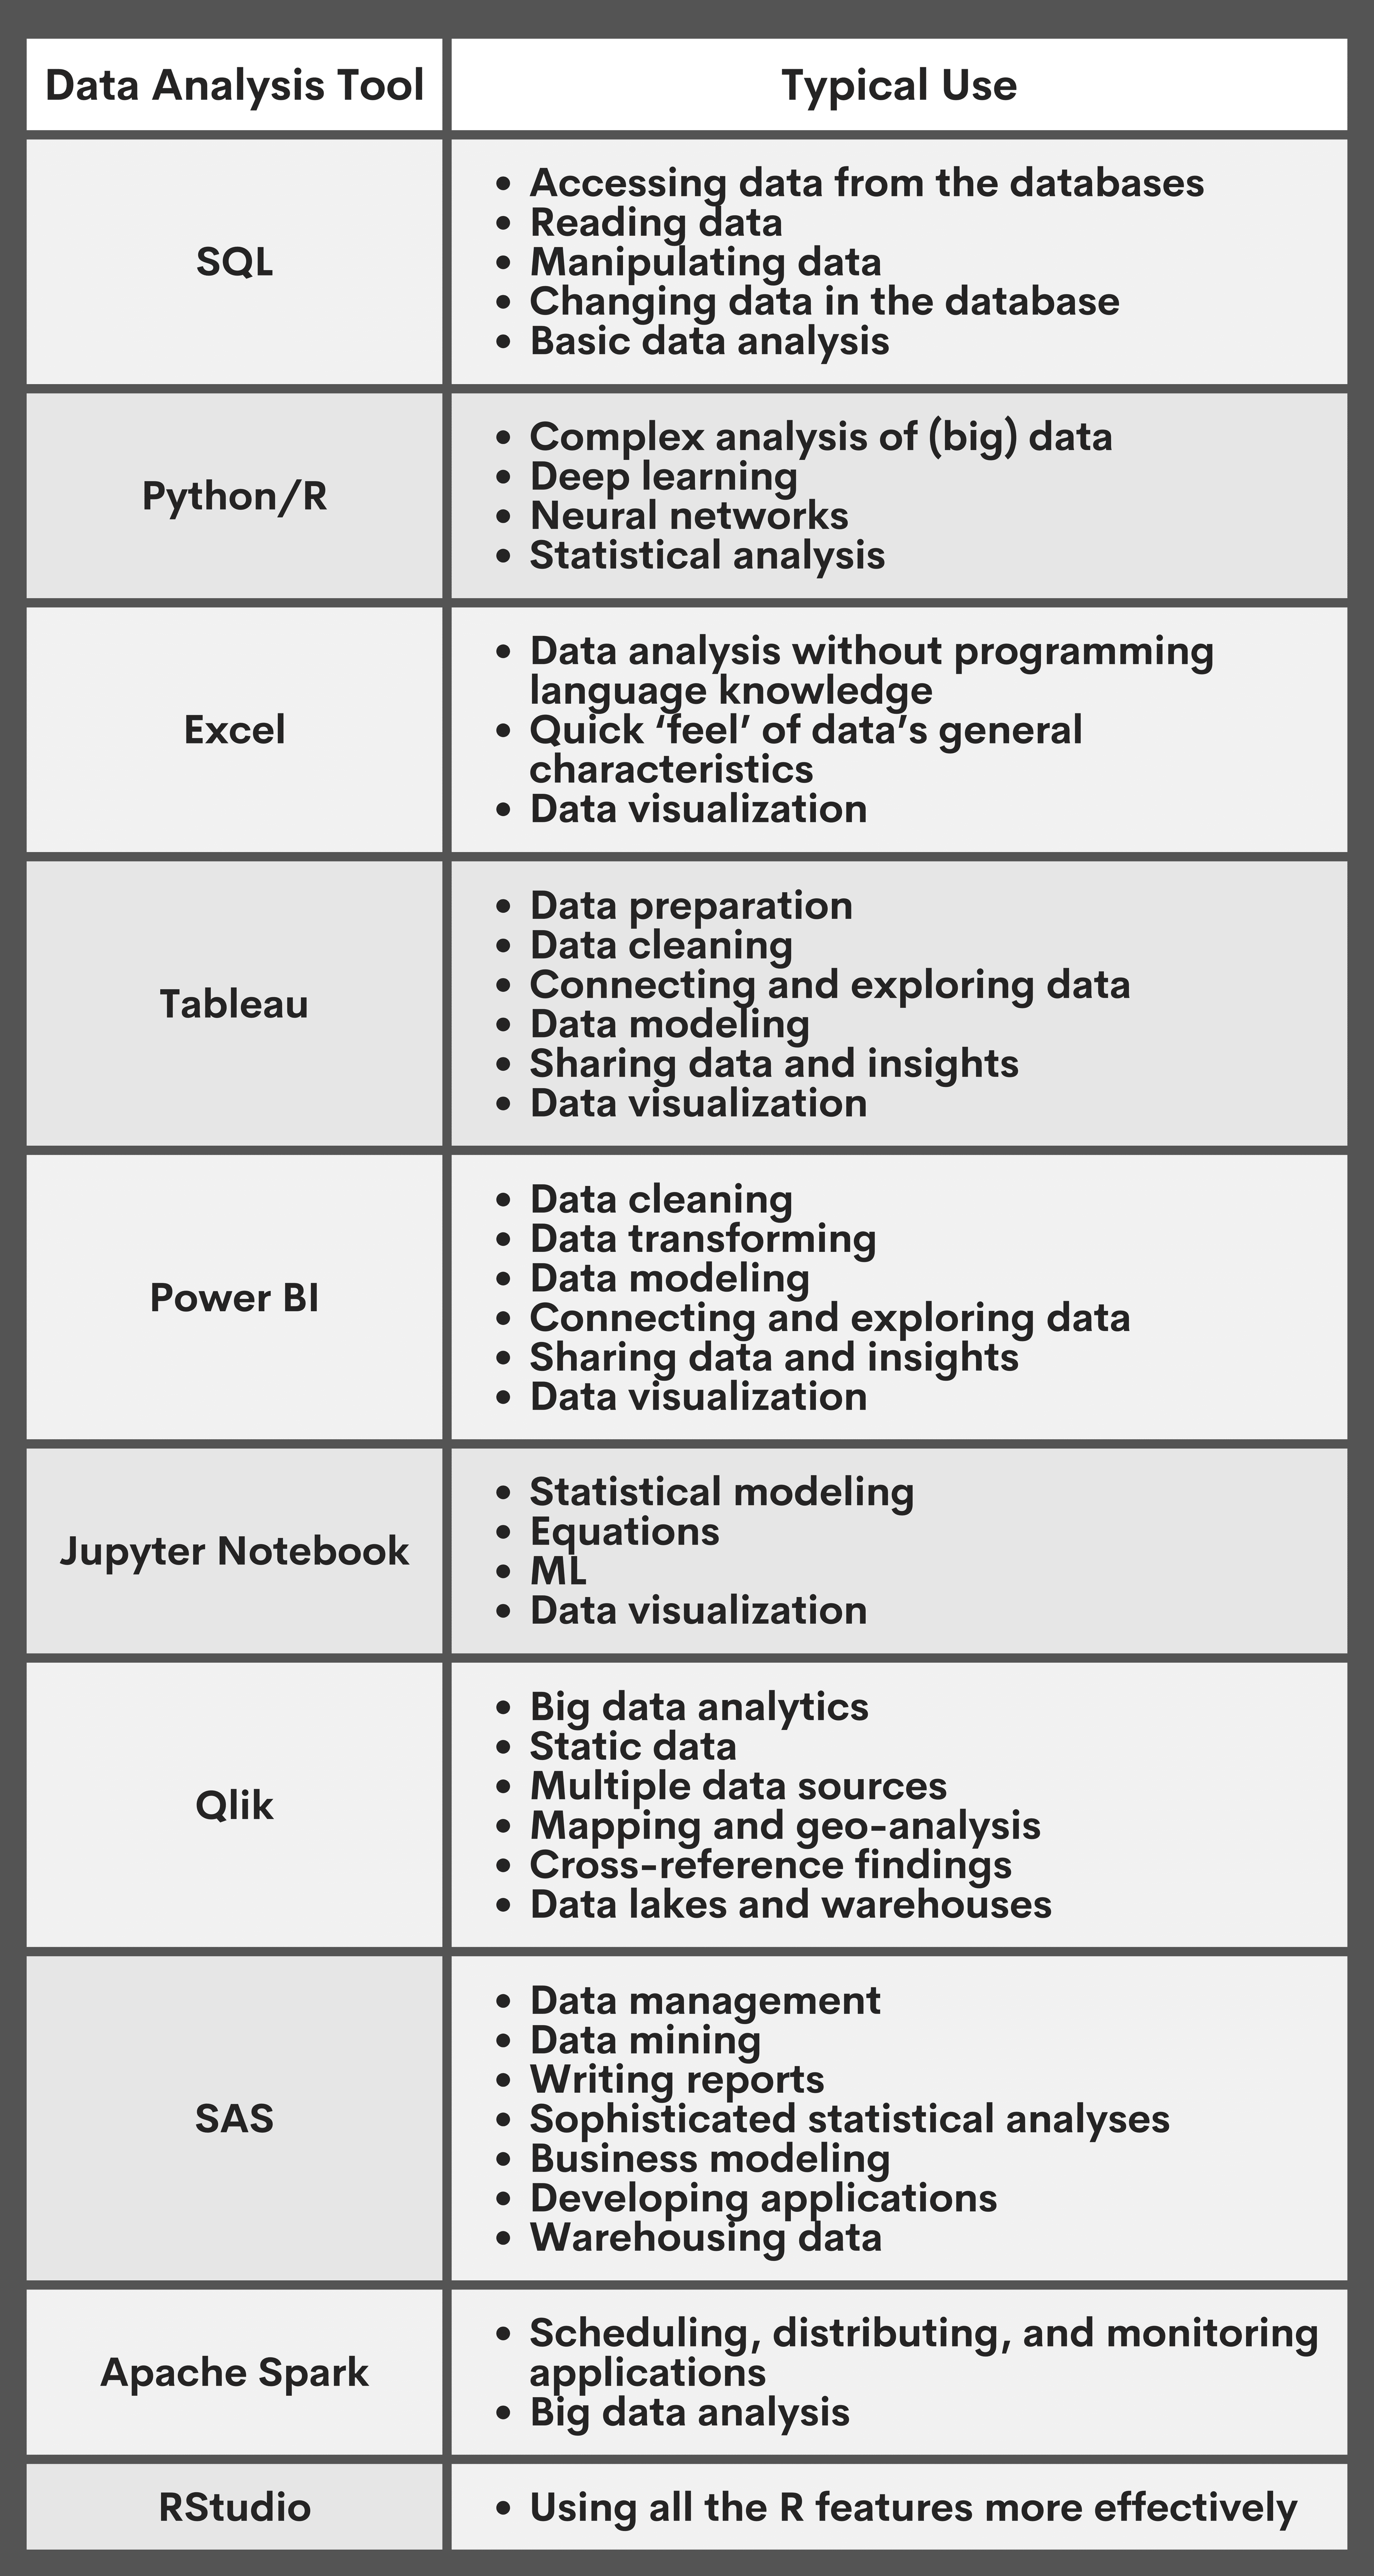
Top 10 Data Analysis Tools for Data Scientists
I’ll cover a few different types of tools here – there will be some open-source programming languages, some drag-and-drop interfaces, and some that are more geared toward business decisions. All of these tools will help you do your job better and potentially move forward on your journey to becoming a full stack data scientist.
1. SQL
SQL, which stands for Structured Query Language, is stop number one. It’s extremely popular with developers – nearly half (49.4%) of all developers replying to StackOverflow’s annual survey reported using it, more than Python (48%).
However, it’s also very popular with data analysts and data scientists because it’s so semantically easy to pick up. I found that even as a total SQL novice, I was able to read and even write basic queries within a few minutes.
Through queries, you can read, manipulate, and change data. It can be used to access huge amounts of data directly where that data is stored, so you don’t need to copy data into other applications. And, unlike Excel (which also has a mention on this list!), it's easy to audit and replicate. So if something goes wrong, you don’t have to spend ten hours looking for the typo in your VLOOKUP formula.
SQL is good for the kind of basic data analysis work you’d do every day – cleaning, looking, and accessing. It’s a great place to get started when learning about data analytics tools.
2. Python and R
Second on the list are my personal favorite tools: R and Python.
They’re grouped together because they do the same thing: they’re good for analyzing big data, they’re open-source programming languages, they’re both pretty easy for beginners to pick up, and they’re often used together.
They’re both super versatile, powerful, and honestly fun to use. Python has some of the best libraries for data science, including deep learning and neural networks. R, meanwhile, is amazing for statistics and data viz.
3. Microsoft Excel
Ah, my old frenemy Microsoft Excel. This was the only tool I debated leaving on this list for several reasons: it’s not open source, meaning you can’t easily share and replicate your results, and it’s proprietary software. It’s clunky to use, and can often be slow, especially compared to a tool like SQL. And don’t get me started on the date format issues.
But ultimately, it had to merit inclusion. It’s the perfect tool for those who are just getting started. The formulas are easy to look up and apply. You don’t have to know any programming languages to get started. You can paste in a bunch of numbers and do some very basic data analysis within seconds.
Plus, so many companies still rely on it. If you’re looking to get into data analysis, Excel is a good tool to learn – but be ready to move on to more exciting and useful data analysis tools soon.
4. Tableau
Here’s another useful data analysis tool: Tableau. It’s very popular, with 33% of the market share among data analytics and viz tools. It’s one of the drag-and-drop interfaces I mentioned, which makes it super easy to use. It’s versatile too, as you can work with almost every kind of data within Tableau.
What I like about it is how approachable it is, which was built into its DNA back in 2003. It was created by three Stamford students who wanted to make data understandable to regular, ordinary people who might not know how to code very much yet.
Tableau is great for data analysis because it’s so easy. The user interface is very intuitive to use. It’s commonly used to do data prep and cleaning, connecting and exploring data, allowing other non-technical users to connect with and explore the data themselves, and make some pretty cool data visualizations. You do have to pay to use it, but it’s free to learn on Tableau’s website.
5. Power BI
Now we come to the second most popular drag-and-drop data analysis interface. It’s owned by Microsoft, and like Tableau, is commonly used to turn data into actionable insights – AKA business intelligence.
It’s a little newer than Tableau as it was only released in 2011. However, it has a comparable price point. Compared to Tableau, it’s faster for smaller data sets but more limited for larger data sets. Plus, while it can connect to R, it can’t connect to Python, C/C++, or Java like Tableau can.
Many data analysts find it easier to use than Tableau because it’s a Microsoft product like Word or Excel. It’s great to clean and transform data, and then use that nice data to make data model products.
6. Jupyter Notebook
Jupyter Notebook is an offshoot of Python, hence the JuPYter. However, it’s not a programming language – it’s more like a workspace. Now, it’s a fully interactive data science platform all on its own. You can code in Python using a Jupyter notebook, which allows you to embed code and output (like graphs, tables, and other results) into the same document.
Aside from Python, it also supports 40 other programming languages.
Today, most data scientists and analysts use JupyterLab, which has more support for more advanced functionality like machine learning and scientific computing, rather than the Jupyter Classic Notebook. It’s a great open-source tool for anyone familiar with Python (or one of the other supported programming languages) and who wants to produce a rich, interactive document with visualizations, equations, statistical modeling, text, or any other rich media.
7. Qlik
Qlik is a more advanced data analysis tool, typically used to do big data analytics. Qlik is built on the product’s proprietary “associative engine” which allows you to combine some different data sources to form associations and connections across the data.
Companies usually opt for either the cloud-based product, Qlik Sense, or an on-prem deployment with QlikView. QlikSense is more for analyzing static data, while Qlik Sense is used for that multiple-data-source data analysis I mentioned.
”Qlik” covers a suite of data analysis tools, like Qlik GeoAnalytics (mapping and geo-analysis), Qlik DataMarket (bringing in external data to augment and cross-reference your findings), Qlik Catalog (to organize data) and Qlik Compose (data lakes and warehouses). Truly a renaissance tool.
8. SAS
SAS stands for “statistical analysis system.” Sounds like a promising data analysis tool, right?
It’s one of the most popular types of software for data analysis. Data analysis and data scientists use it for data management, data mining, writing reports, running sophisticated statistical analyses, business modeling, developing applications, and warehousing data. Truly a tool that does it all.
The product is free for everyone to use, though some businesses will purchase the enterprise version of the software for extra security or scaling functionality.
SAS comes with many modules that make it popular for data analysis. These modules include Base SAS, which helps you do basic data manipulation like filtering and reshaping data. Then you’ve got SAS/STAT, which is the statistics module. SAS/ACCESS connects to other databases to let you read data from Teradata, SQL Server, and others. SAS/GRAPH helps you make (what else) graphs. And SAS/ETS is the time series module to do time series forecasting.
9. Apache Spark
Apache Spark is a cluster computing program, which means a collection of computers that work together as a single entity. This helps you do operations much faster, and at a greater scale.
Apache Spark itself is used for scheduling, distributing, and monitoring applications across that computer cluster. It’s not a casual use type of program, but many organizations rely on it to analyze big data especially.
It’s a super general-purpose program, which means almost any kind of data analyst can use it. Spark’s speed and API typically let scientists use it for ad hoc analyses, data wrangling, and interactive data analysis.
10. RStudio
Just as Python has Jupyter Notebooks, R has RStudio. RStudio is an IDE (integrated development environment) that allows you to code, see your files, see your code output, and any visualizations you might create all in one place.
R the language has such a sophisticated set of open-source packages that make the base language even more powerful for data analysis, and RStudio lets that power shine.
It’s also open source, which is a big pro in my book. It doesn’t just allow you to code in R, but can also integrate with Python. The Pro version integrates with Apache Spark and RStudio Connect to publish and share analyses with stakeholders.
It’s great for beginners and expert data analysts alike, and many data scientists rely on RStudio to do their analysis, both simple and complex.
These ten data analysis tools are the most useful in the business.
From Apache Spark to Qlik, all ten of these tools have earned their place on this list. Whether they’re languages, interfaces, drag-and-drops, or programs, each will allow you to do the kind of data analysis you need. Most are free or have a free version you can learn with. No matter where you are in your data analysis journey, these ten tools are a must-know.
If you want to land your dream job as a data scientist or data analyst, check out our platform StrataScratch. We offer 1000+ (and more every month!) interview questions from companies like Facebook, Google, and Amazon. We won’t just give you the answers – we’ll teach you to solve them in our code-execution environment.
Share