How I Use DateTime Features in Python in Data Science Interviews


Categories:
 Written by:
Nathan Rosidi
An overview of using DateTime features with Python Pandas.
In this article, we’re going to look at a few different applications of the DateTime library within Python Pandas. For context, whenever you have to manipulate tabular data in Python, you’ll typically be able to do it with the Pandas library. Much in the same way you can use Excel or Google Sheets, Pandas gives you more power to work with structured data. You can find out more about the Pandas ecosystem here as well as read through its extensive documentation here. A strong Pandas skillset is one of the most common expectations for Python Data Science Interviews.
DateTime Features in Python Pandas
DateTime manipulation is one of the most frequently asked Data Science Interview questions. The ubiquity of DateTime datasets and a range of complexity which one can achieve with simple-looking data makes it a popular Data Science test area. Pandas has numerous DateTime functions covering a wide range of DateTime use cases, and you can read the official documentation about them here.
One of the most common use cases for DateTime functions is obtaining proper date formats when cleaning data. In many cases, your datetime data is too complex and requires simplification down to the day of the week or hour of the day. In other cases, you have data without dates or times in which you will need to use the DateTime library to enrich with reasonable dates for your calculations.
To achieve this formatting and enrichment, DateTime functions within Pandas let you parse strings or columns into DateTime format, generate periodical DateTime information, extract a subset of date or time info from DateTime objects, and more.
The best way to show how these Panda DateTime Functions work is through example, so we’re going to cover a few Python interview questions which require the use of DateTime functions.
Interview Examples Requiring Python Pandas DateTime Functions

How to Use The today() Method to Enrich Datetime Data
The first example we’re going to look at helps solve a question from an Uber data science interview.

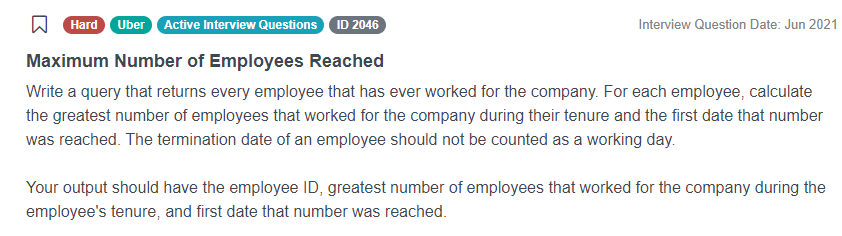
Link to the question: https://platform.stratascratch.com/coding/2046-maximum-number-of-employees-reached
This question asks us to look at every employee who works at Uber and determine the greatest number of employees at Uber during their employment as well as the first date this greatest number appeared.
When it comes to understanding why we must use DateTime functions, we often must analyze the dataset first. In this question, we only have one table uber_employees at which to look.
uber_employees
| first_name | object |
| last_name | object |
| id | int64 |
| hire_date | datetime64[ns] |
| termination_date | datetime64[ns] |
| salary | int64 |
With some example data:

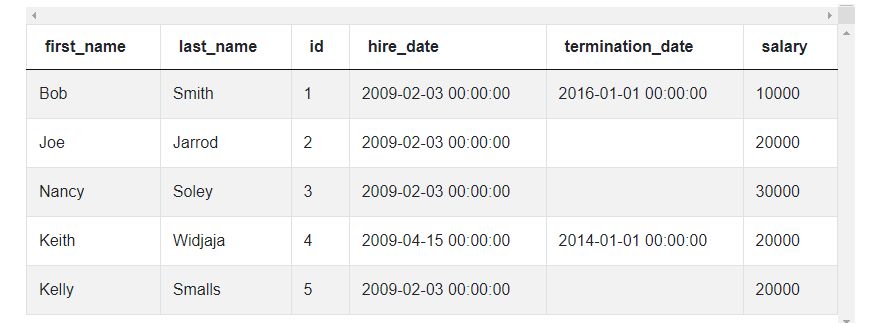
Having datetime columns like hire_date and termination_date is insufficient evidence we’ll need to call the datetime library. Instead, since this data includes a termination_date column for employees still at Uber, we have to assume it will be empty or NULL for current employees. This is important because we will need to insert realistic data for their end date to calculate employment ranges and reach our solution.
To enrich, we’ll loop through our table and either assign an end date as the termination date if one exists or assign it as today if no termination date exists.
import pandas as pd
import datetime as dt
for i in range(uber_employees.shape[0]):
    if uber_employees.at[i, 'termination_date'] is pd.NaT:
        end_date = dt.datetime.today()
    else:
        end_date = uber_employees.at[i, 'termination_date']
Notice how the datetime library was initially imported with alias dt. We use the module datetime of this library as well as its today() method to assign the end date for any current employee as today’s date.
We’re not going to cover the rest of the solution in detail since it’s somewhat complex, but, here’s what it looks like:
import pandas as pd
import datetime as dt
hired_dates = pd.DataFrame(uber_employees['hire_date'].rename('date'))
hired_dates['value'] = 1
terminated_dates = pd.DataFrame(uber_employees['termination_date'].
rename('date'))
terminated_dates['value'] = -1
terminated_dates = terminated_dates.dropna()
all_dates = pd.concat([hired_dates, terminated_dates], ignore_index=True)
all_dates = all_dates.groupby('date').sum().reset_index()
all_dates = all_dates.sort_values('date')
all_dates['emp_count'] = all_dates['value'].cumsum()
for i in range(uber_employees.shape[0]):
if uber_employees.at[i, 'termination_date'] is pd.NaT:
end_date = dt.datetime.today()
else:
end_date = uber_employees.at[i, 'termination_date']
start_date = uber_employees.at[i, 'hire_date']
max_emp_count = all_dates[all_dates['date'].between(start_date, end_date)]
['emp_count'].max()
uber_employees.at[i, 'max_emp'] = max_emp_count
earliest_date = all_dates[(all_dates['emp_count'] == max_emp_count)
& (all_dates['date'].between(start_date, end_date))]['date'].min()
uber_employees.at[i, 'min_date'] = earliest_date
result = uber_employees[['id', 'max_emp', 'min_date']]
How to Use Weekday and Hour Accessors to Parse Datetime Data
The second example we’re going to analyze helps answer a Doordash question about average earnings for delivery drivers.

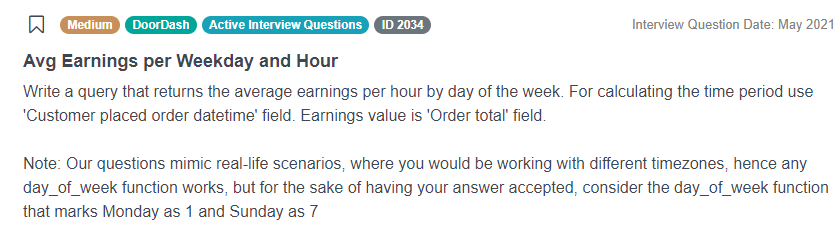
Link to the question: https://platform.stratascratch.com/coding/2034-avg-earnings-per-weekday-and-hour
We see the question asks us to return earnings averages based on both hour and day of week, so we already have some indication we’ll have to do some form of DateTime manipulation.
The problem only uses the doordash_delivery dataset which has the following fields:
doordash_delivery
| customer_placed_order_datetime | datetime64[ns] |
| placed_order_with_restaurant_datetime | datetime64[ns] |
| driver_at_restaurant_datetime | datetime64[ns] |
| delivered_to_consumer_datetime | datetime64[ns] |
| driver_id | int64 |
| restaurant_id | int64 |
| consumer_id | int64 |
| is_new | bool |
| delivery_region | object |
| is_asap | bool |
| order_total | float64 |
| discount_amount | int64 |
| tip_amount | float64 |
| refunded_amount | float64 |
The example data looks like this:

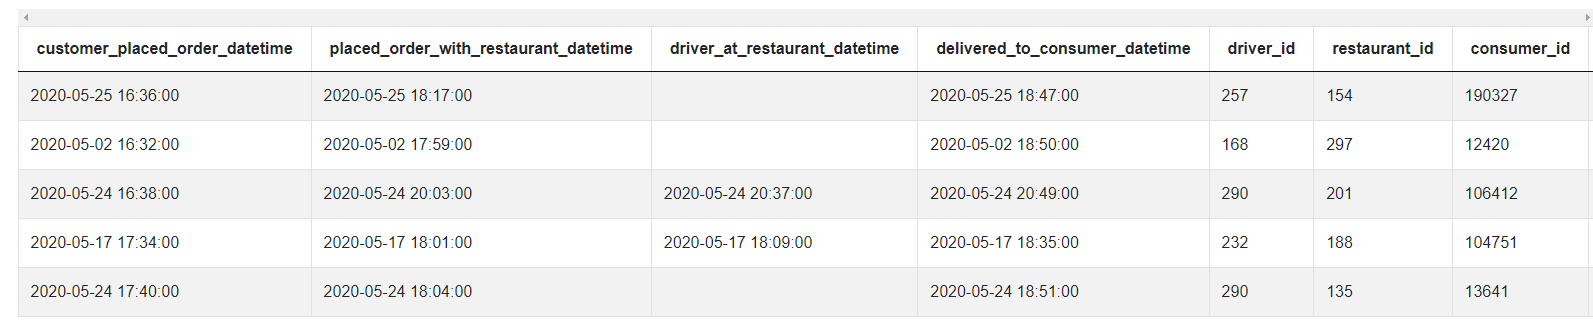
Again, simply having DateTime columns in our dataset is insufficient to conclude we’ll need to invoke the DateTime library. Rather, the key piece of information here is having to calculate based on hour and day, and we can see none of the columns isolates only the hour or day.
We’ll first need to extract the day of the week and hour from the customer_placed_order_datetime field. First, we use the .dt.weekday attribute to get the day of the week. Looking at the documentation, this yields 0 for Monday, so, since the question prompts us to start with 1 for Monday, we add 1 to the result to the extracted day.
# Import your libraries
import pandas as pd

# Keep relevant fields
dd_df = doordash_delivery[['customer_placed_order_datetime', 'order_total']]
dd_df['weekday'] = dd_df['customer_placed_order_datetime'].dt.weekday + 1
Extracting the hour of the day works similarly with the .dt.hour attribute.
dd_df['hour'] = dd_df['customer_placed_order_datetime'].dt.hourAnd finally all you have to do is aggregate by the day of the week and hour of the day. The solution ends up looking like this:
# Import your libraries
import pandas as pd

# Keep relevant fields
dd_df = doordash_delivery[['customer_placed_order_datetime', 'order_total']]
# Get the day of the week (add 1 to keep have Monday = 1)
dd_df['weekday'] = dd_df['customer_placed_order_datetime'].dt.weekday + 1
# Hour of the day
dd_df['hour'] = dd_df['customer_placed_order_datetime'].dt.hour
dd_df.groupby(by = ['weekday', 'hour'], as_index = False).agg({'order_total': 'mean'})
Looking at the code above, our aggregation function requires grouping by our extracted weekday and hour data in order to calculate the average earnings per weekday and hour.
How to Convert Formatted Strings to Specific Datetime Data
The third example comes from a Salesforce interview question about user growth rate.

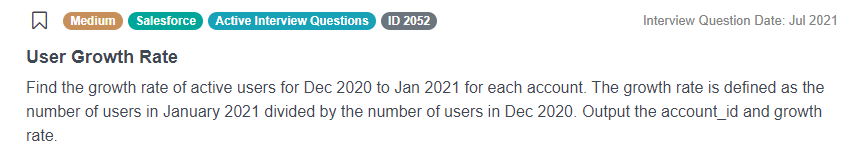
Link to the question: https://platform.stratascratch.com/coding/2052-user-growth-rate
This question asks us to calculate the growth rates of active users for Jan 2021 from Dec 2020 for each account within Salesforce and list them.
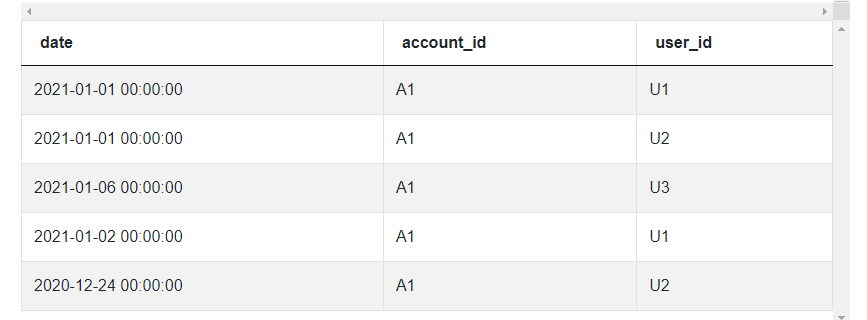
We only have a single sf_events dataset which looks fairly simple.
sf_events
| date | datetime64[ns] |
| account_id | object |
| user_id | object |
The data looks like this:

Looking at our example data, we can see we’re given information such as days and times when we really need to narrow it down to month and year. We can use a unique method from the datetime library .strftime() which converts datetime data into strings according to a desired format.
# Import your libraries
import pandas as pd

# Create the Year - Month indicator
sf_events['month'] = sf_events['date'].dt.strftime('%Y-%m')
Notice how we specify the formatting inside the .strftime() method to only extract a year and date. Next, we limit our months to only December 2020 and January 2021. Keep in mind the string filters needs to match the formatting specified in the strftime() method.
summ_df = sf_events[sf_events['month'].isin(['2020-12', '2021-01'])]Now we aggregate using a pivot table for these months, calculate a growth rate, and limit our output to relevant columns. Here’s the final solution:
# Import your libraries
import pandas as pd

# Create the Year - Month indicator
sf_events['month'] = sf_events['date'].dt.strftime('%Y-%m')
summ_df = sf_events[sf_events['month'].isin(['2020-12', '2021-01'])].pivot_table(
    index = 'account_id', columns = 'month', values = 'user_id', aggfunc =
    'nunique').reset_index()
# Calculate growth rate and output relevant columns
summ_df['growth_rate'] = summ_df['2021-01'] / summ_df['2020-12']
summ_df[['account_id', 'growth_rate']]
Again, any references to our month and year in the growth rate calculation had to maintain consistent formatting with our previously called strftime() method.
How to Use Accessors and String-to-Datetime Methods to Compare and Filter Datetime Data
The last example is again from a Salesforce data science interview.

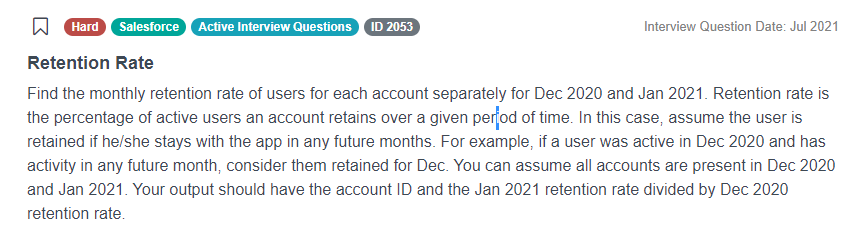
Link to the question: https://platform.stratascratch.com/coding/2053-retention-rate
It demands we compare retention rates instead of growth rates over the same span of two months. Although we only need to compare two months, it’s already clear we’ll have to look at months beyond December and January for retention data.
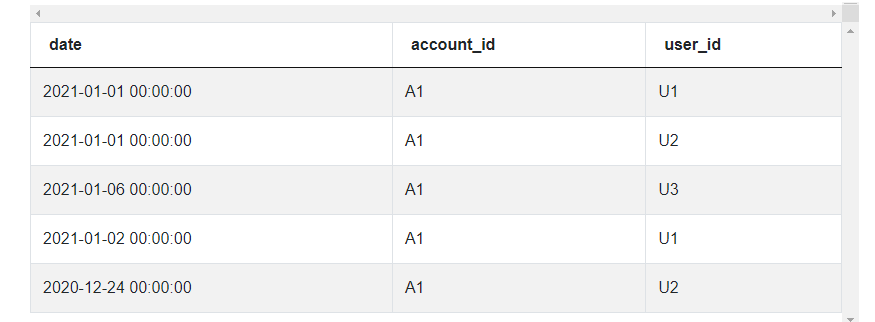
The problem again uses the sf_events dataset which has the following fields:
sf_events
| date | datetime64[ns] |
| account_id | object |
| user_id | object |
And here’s some example data:

The date time functions this problem requires are completely different from our previous question since we have to find retention instead of growth. We can first start by getting accounts active in December and January. In both cases, we can use the dt.year and dt.month attribute to specify which year 2020 or 2021 or month December or January we need to reference. Keep in mind for months we reference January as 1 and December as 12 for our filter.
# Import your libraries
import pandas as pd

# Get Accounts active in Dec 2020
dec2020 = sf_events[(sf_events['date'].dt.year == 2020) & (sf_events
['date'].dt.month == 12)].drop_duplicates(subset = ['account_id', 'user_id'])
dec2020['in_dec'] = 1
# Get Accounts active in Jan 2021
jan2021 = sf_events[(sf_events['date'].dt.year == 2021) & (sf_events
['date'].dt.month == 1)].drop_duplicates(subset = ['account_id', 'user_id'])
jan2021['in_jan'] = 1
Next we must calculate accounts active after each of these months. In both cases, we must use a comparison for dates. We first invoke the .dt.date attribute to get only the date and exclude the time. Next we call the .to_datetime() function to convert a string of the last day of the respective months to a datetime object which we then compare with the date.
# Get accounts active after December and January
aft_dec2020 = sf_events[sf_events['date'].dt.date > pd.to_datetime
('2020-12-31')].drop_duplicates(subset = ['account_id', 'user_id'])
aft_dec2020['aft_dec'] = 1
aft_jan2021 = sf_events[sf_events['date'].dt.date > pd.to_datetime
('2021-01-31')].drop_duplicates(subset = ['account_id', 'user_id'])
aft_jan2021['aft_jan'] = 1
After these datetime manipulations, we can proceed with merging the data sets and calculating the retention rate using standard Python and Pandas code, so the solution looks like this:
# Import your libraries
import pandas as pd

# Get Accounts active in Dec 2020
dec2020 = sf_events[(sf_events['date'].dt.year == 2020) & (sf_events
['date'].dt.month == 12)].drop_duplicates(subset = ['account_id', 'user_id'])
dec2020['in_dec'] = 1
# Get Accounts active in Jan 2021
jan2021 = sf_events[(sf_events['date'].dt.year == 2021) & (sf_events
['date'].dt.month == 1)].drop_duplicates(subset = ['account_id', 'user_id'])
jan2021['in_jan'] = 1
# Get accounts active after December and January
aft_dec2020 = sf_events[sf_events['date'].dt.date > pd.to_datetime
('2020-12-31')].drop_duplicates(subset = ['account_id', 'user_id'])
aft_dec2020['aft_dec'] = 1
aft_jan2021 = sf_events[sf_events['date'].dt.date > pd.to_datetime
('2021-01-31')].drop_duplicates(subset = ['account_id', 'user_id'])
aft_jan2021['aft_jan'] = 1
# Merge the datasets to get December and January retention numbers
dec_merged = pd.merge(dec2020, aft_dec2020, on =
['account_id', 'user_id'], how = 'left')
dec_summ = dec_merged.groupby(by = ['account_id'], as_index = False).sum()
dec_summ['dec_retention'] = dec_summ['aft_dec'] / dec_summ['in_dec']

jan_merged = pd.merge(jan2021, aft_jan2021, on =
['account_id', 'user_id'], how = 'left')
jan_summ = jan_merged.groupby(by = ['account_id'], as_index = False).sum()
jan_summ['jan_retention'] = jan_summ['aft_jan'] / jan_summ['in_jan']

# Merge the Dec20 and Jan21 datasets, calculate the relative retention rate
# and output.
final_merge = pd.merge(dec_summ, jan_summ, on = 'account_id', how = 'left')
final_merge['retention'] = final_merge['jan_retention'] / final_merge['dec_retention']
final_merge[['account_id', 'retention']]
We saw in this solution how important DateTime attributes can be since we had to isolate the datetime object’s year, month, and date data out of a datetime object. After this, we had a good opportunity to create datetime objects from strings with the .to_datetime() function.
Conclusion
In this article, we were able to explore several uses of Python Pandas DateTime library. Most of the time, you’ll leverage one of the accessors to isolate the date, time, or other component of DateTime data. However, other times you may need to leverage the library to fill in some DateTime data, so you’ll take advantage of the functions it offers.
Having good Pandas skills is pretty much a requirement if you’re serious about using Python in your Data Science career. Fortunately, we were able to show some practical examples here which reflect actual data science interview questions from top companies like Uber, Salesforce, and Doordash. On our platform, you can practice answering more Pandas interview questions by building solutions to them interactively on your own or with the help of our articles. You’ll also have access to a large community of other users who can critique your solution while you look at their solutions for inspiration.
Share