Forbes Python Interview Question Walkthrough

Categories:
 Written by:
Nathan Rosidi
Forbes Python interview question, Most Profitable Companies, analyzed and solved in detail
Forbes is a business magazine best known for ranking billionaires.
The list was first published in 1987, and the magazine was first published in 1917.
In this article, we have one of the medium level python interview questions. We will solve this Python Question step-by-step, which Forbes asks in an interview. To discover a solution, keep reading until the end.
Forbes Python Interview Question
Most Profitable Companies
Find the 3 most profitable companies in the world. Sort the result based on profits in descending order. If multiple companies have the same profit, assign them the same rank and include all tied companies in the top results. Output the result along with the corresponding company name.
- The dataset has already been loaded as a pandas.DataFrame.
- print() functions and the last line of code will be displayed in the output.
- In order for your solution to be accepted, your solution should be located on the last line of the editor and match the expected output data type listed in the question.
Video Solution:
Forbes asks us to find the 3 most profitable companies in the entire world.
The question is asked in the interview to test your Data Manipulation skills. Data manipulation is the process of changing and transforming information to make it more organized to satisfy your project needs.
Let’s plan this process and frame the problem.
First, we will select the features that the question asks us to show, which are profit and company name. Yet that does not solve our question at all, because we have to find the top companies according to the profit.
To do that, we should create a new column. Creating a new column is a technique that helps you to crack interview questions.
In this python interview question, we will create a rank column to help us sort results based on profits in descending order.
Our plan includes a three-step approach.
Now let’s start with the first step, which is exploring the data.
1. Exploring the Dataset
Exploring the dataset allows you to develop a deeper understanding of the dataset and cover the patterns by writing functions. This helps you to do better analysis.
Now, to begin with, let’s explore the dataset. Our data frame is forbes_global_2010_2014.
Here are the columns of our dataset, which is already given to us in the platform.
Okay, there is a lot of information stored in our dataset.
The head() function will return the sample of our dataset’s first rows. To gain better intuition, let’s look at the dataset’s first 5 rows by using the head() function.
forbes_global_2010_2014.head()| company | sector | industry | continent | country | marketvalue | sales | profits | assets | rank |
|---|---|---|---|---|---|---|---|---|---|
| ICBC | Financials | Major Banks | Asia | China | 215.6 | 148.7 | 42.7 | 3124.9 | 1 |
| China Construction Bank | Financials | Regional Banks | Asia | China | 174.4 | 121.3 | 34.2 | 2449.5 | 4 |
| Agricultural Bank of China | Financials | Regional Banks | Asia | China | 141.1 | 136.4 | 27 | 2405.4 | 8 |
| JPMorgan Chase | Financials | Major Banks | North America | United States | 229.7 | 105.7 | 17.3 | 2435.3 | 20 |
| Berkshire Hathaway | Financials | Investment Services | North America | United States | 309.1 | 178.8 | 19.5 | 493.4 | 17 |
Our data frame consists of the following information about companies like their name, sector, industry, continent, country, market value, sales, profits, assets, ranks, and the Forbes web page.
Using head methods almost every time will give you a great sample of the data. Yet, when working with data, you will see that sometimes data sets might be sorted.
So first five rows might not give you a perfect idea of what the data set contains.
One way to overcome this is to use the sample() function.
The sample() function will return randomly selected outputs every time you run it.
In the parentheses, you can specify the number of rows you want to see.
Using the sample() function would give you random information about the data set.
So even if your dataset is sorted, you can still see more information about the dataset.
forbes_global_2010_2014.sample(5)| company | sector | industry | continent | country | marketvalue | sales | profits | assets | rank |
|---|---|---|---|---|---|---|---|---|---|
| EDF | Utilities | Electric Utilities | Europe | France | 75.8 | 100.4 | 4.5 | 353.9 | 68 |
| National Australia Bank | Financials | Major Banks | Australia | Australia | 75.3 | 36.9 | 5.4 | 755.9 | 64 |
| Verizon Communications | Telecommunication Services | Telecommunications services | North America | United States | 197.7 | 120.6 | 11.5 | 274.1 | 32 |
| Cisco Systems | Information Technology | Communications Equipment | North America | United States | 119 | 47.9 | 8.2 | 98.4 | 45 |
| Royal Dutch Shell | Energy | Oil & Gas Operations | Europe | Netherlands | 234.1 | 451.4 | 16.4 | 357.5 | 22 |
We already know what the column names are and how many columns exist. We can see this from the platform.
Yet, we do not know what is the datatypes of the columns or how many rows the columns contain.
That is digging deeper, but it will give us more information. There is no such thing as too much data if the data is relevant, right?
So to learn more about the columns, like their shape and data type, we can use the info() function.
Let’s use it.
forbes_global_2010_2014.info()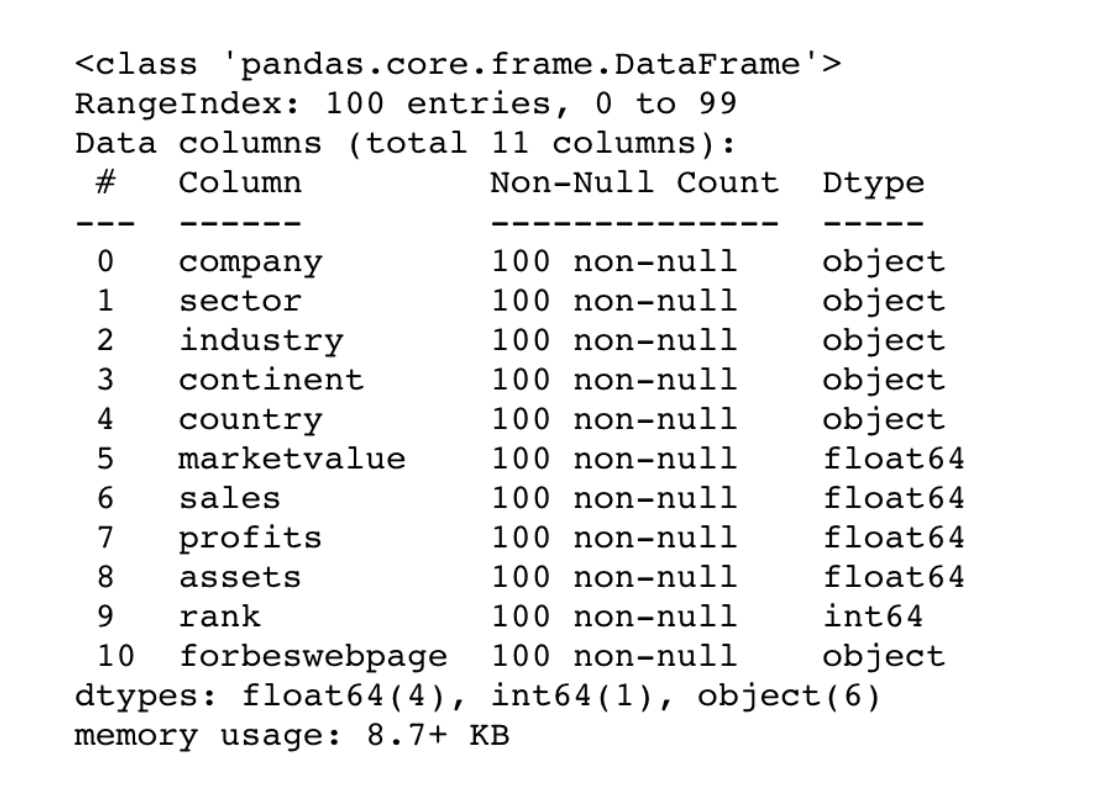
Here, we can analyze columns with the length and data types like an object, float64, and int64.
Now let’s write the approach to solving this python interview question.
2. Writing out the approach
At this point, we have a piece of information about the data set.
To find the expected output, we have to plan the code. The question asks us to return profitable companies, which should contain the columns of profits and the company name. Now, that means we should select these ones.
There are many ways to do that in python, like bracket indexing or the groupby() function. In this question, we will use both.
Let’s continue searching keywords from the question to plan the approach. The question wants us to “sort the results in descending order”.
That means we have to sort the data frame. Actually, we can do this by using sort_values() , because the values should be in descending order, and we can do this by adding an argument to the sort values function.
And the final keyword is “3 most”. To find that, we can use the rank method.
In this question, we will create a column to rank these companies by using the rank() method.
Now it is time to split the problems into four steps.
Step 1: Import the libraries
To manipulate the dataset, import the pandas. We will work with arrays, so let’s import the NumPy too.
Step 2: Group and sort your columns.
It is time to group your “profit” and “company” columns. And then sort by profit in descending order.
Step 3: Ranks the companies
Now, to select the top 3 companies, we first need to create a column name “rank” and rank the companies by profit.
Step 4: Filter the data set
Since we added the rank columns and we want to see the “profit” and “company” columns in the output, let’s show these columns by using the bracket indexing. We’ll use the comparison operator to find the top 3.
3. Coding the solution
Now, let’s turn this approach into coding.
Step 1: Import the libraries
To manipulate the dataset, import pandas as pd. We will work with arrays, so let’s import the NumPy too.
import pandas as pd
import numpy as np
Step 2: Group your columns.
There is no need to use other columns because our final output should only contain company and profit columns.
So let’s use the groupby() function to select companies, and select the profits column too. Using the sum() method with groupby() will help us to calculate the profit of companies, and reset_index() helps us to remove the indexes. Since the question asks us to return the top 3 companies, we have to sort this data frame. This is done in the sort_values() function by setting “ascending = False”.
Of course, we can apply these functions in many steps, but there is no need to extend the code.
result = forbes_global_2010_2014.groupby('company')['profits'].sum(
).reset_index().sort_values(by='profits', ascending=False)
Tip: Using sum() and reset_index()
The groupby() function will return data grouped by the object. That’s why after using groupby(), the aggregate function should be used. So we used the sum() function. Also, the groupby() function adds indexes to the data frame, that’s why we used reset_index()
Step 3: Create a new column
When solving coding questions, sometimes creating a new column will help you to do the trick. In this problem, we will create the rank column.
Let’s continue. Now, we have already sorted the values and selected the necessary columns. After that step, we will select the top 3. Adding a rank column helps us do the filtering easily.
By using the min() method and equaling false to the ascending, the rank column is added to the data frame and ranks them in descending order.
result['rank'] = result['profits'].rank(method='min', ascending=False)Step 4: Filter the columns
Now, we will use the comparison operator “ <= “ with the rank column and equal it to 3.
That’s how you will select the top 3 ranks first.
After that, we will use bracket indexing. Why? Because we created the rank column, but we don't need to see it because the expected output does not require it. To that end, let's use bracket indexing, and see the final result.
result = result[result['rank'] <= 3][['company', 'profits']]- The dataset has already been loaded as a pandas.DataFrame.
- print() functions and the last line of code will be displayed in the output.
- In order for your solution to be accepted, your solution should be located on the last line of the editor and match the expected output data type listed in the question.
Here is the expected output.
| company | profits |
|---|---|
| ICBC | 42.7 |
| Barclays | 39 |
| Gazprom | 39 |
Now we see the 3 most profitable companies, with just two columns, as the problem wants us to show.
The Code One-liner (Optimizing the Code)
You'll probably realize you can answer this python interview question in one step after using our platform for a while and honing your skills. You may also be driven to evaluate it since interviewers often ask you to modify your response.
There are also Python one-liners, so it's not a joke. This problem can be resolved in a single step like this:
forbes_global_2010_2014.sort_values(by='profits',ascending=False)[['company','profits']].head(3)There’s one caveat with this solution: You must be certain that no companies of the same rank exist. Otherwise, you might only display the first three rows but not the top three companies.
Conclusion
Here, we showed you how to find the 3 most profitable companies step by step. That was a simple python interview question, so I hope you liked it!
Learning a programming language is similar to learning a foreign language – you should practice every day to get better. By reading the article, we hope you will improve your Python skills. Also, check out our python cheat sheet for learning the common tasks that every data scientist should know. You can also watch our tutorial videos on our Youtube channel here.
Share