A/B Testing Data Science Interview Questions Guide

Categories:
 Written by:
Nathan Rosidi
How to answer A/B testing Data Science interview questions in a way that makes you stand out from the rest.
A/B Testing is a staple of many data science interviews, especially when the roles deal with deciding how to best design some form of user experience, often through an application or website of some form. Think Amazon, Uber & Youtube -- all these companies have applications with constantly changing features, and behind each change lies an A/B test that is the bread and butter for so many data scientists.
Just do a quick Google search and you’ll find many guides on how to structure a classic A/B testing answer. These guides can be rather useful, but they won’t make your answer stand out from the rest. And that’s what this article is about: I’m going to share with you a thing or two (or three) about how I’ve taken on A/B testing questions in my own data science interview experience and how I make my answer give that extra something that will impress the interviewer. I won’t be covering the basics of formulating hypotheses and conducting t-tests, but I’ll be focusing more on how you can differentiate your answer from the rest.
What is A/B Testing?
A/B testing is essentially a controlled experiment to make crucial decisions about product launches, and these changes can range from small elements like the size and color of a button to larger changes like a whole new page on an application altogether.
Variants
A/B/N testing, as opposed to A/B testing which only tests two different versions, involves N number of versions being tested at once. A/B/N testing is usually employed for large-scale changes.
Multivariate testing occurs when all permutations of versions and related variables are simultaneously tested, and is often used when combinations of decisions have to be made, instead of running A/B tests on each change.
Opportunity Sizing
For many interviewees, they go straight into talking about sample size, statistical significance etc. when asked a question that hints of A/B testing, desperate to unload the memorized frameworks and answers they had memorized in preparation for the interview. However, these answers fall short of standing out from the rest.
Instead, think not just about the techniques of A/B testing, but also about the context in which the A/B testing is conducted. The reality of A/B testing in the real world is that not all proposed changes are worth testing, and in any company there is an element of finiteness that will require a smart allocation of time and resources when it comes to deciding whether a particular A/B testing is worth pursuing.
When the product manager comes to you, the data scientist, with an idea, we want to be able to evaluate the potential impact of this idea based on historical data. This form of opportunity sizing is crucial because it makes your efforts as a data scientist worthwhile. For instance, consider a change on a new e-commerce website that will allow checkout from more than one retailer. To size this opportunity, we need to obtain a ceiling by analyzing the number of different items typically purchased by users. If only a small proportion of users purchase numerous items, this A/B testing might not even be worth pursuing at all. Thus, it is important to estimate the number of users who will actually change behaviors and how this translates to actual numbers for the greater company.
More important, to answer the question about opportunity sizing, you need to be absolutely clear on what metrics you are intending to use. Outline the exact assumptions you’re making in the interview, and be firm about how valuable this opportunity is to be evaluated.
Metrics
Metrics, metrics, metrics. Any answer on A/B testing is incomplete if you are not able to comprehensively and confidently talk about metrics. The key to talking about metrics is to know the company’s products well and to research on what kind of metrics will be typically used. For instance, in my own experience interviewing for e-commerce companies, you are often asked to assess a call-to-action feature, such as a pop-up to alert you that a particular offer is expiring.
If you’re evaluating a Call-to-Action feature:
- Click-Through Rate (CTR): Useful for evaluating calls-to-action (CTA, in the marketing industry, is a phrase usually used to induce a response, such as “Find out More” or “Limited Stocks Available”. The CTA aims to provide more reasons to make you, the consumer, make a decision more promptly. The CTR will be the fraction of CTAs that actually resulted in the number of clicks.
Therefore, the key is to know the application interface well and to understand what metrics tend to be associated with it. Do not just cram all possible metrics into your answers. More importantly, you must never stop at just mentioning the possible metrics that would be relevant. Remember, always answer in context! You have to tell the interviewer why this metric matters and how it matters to the overall user experience.
Here’s one of the interview questions for the data scientist position about metrics that’s actually been asked in a Twitter Product Interview:
How would you quantify the influence of a Twitter user?
Link to the question: https://platform.stratascratch.com/technical/2051-influencer-metrics
Some common answers would be the number of followers, number of retweets, likes and mentions. If you want to give a more robust answer, mention something like the click-through rate of tweeted links, or the number of interactions within a fixed time span. A refined answer to the number of followers would be to mention the number of followers who actually turn on notifications for a particular user. Based on my experience, the interviewer does not want you to list all the possible answers you already know. Instead, the interviewer has an ideal answer in mind and you have to think hard about the clues he or she may be giving you along the way.
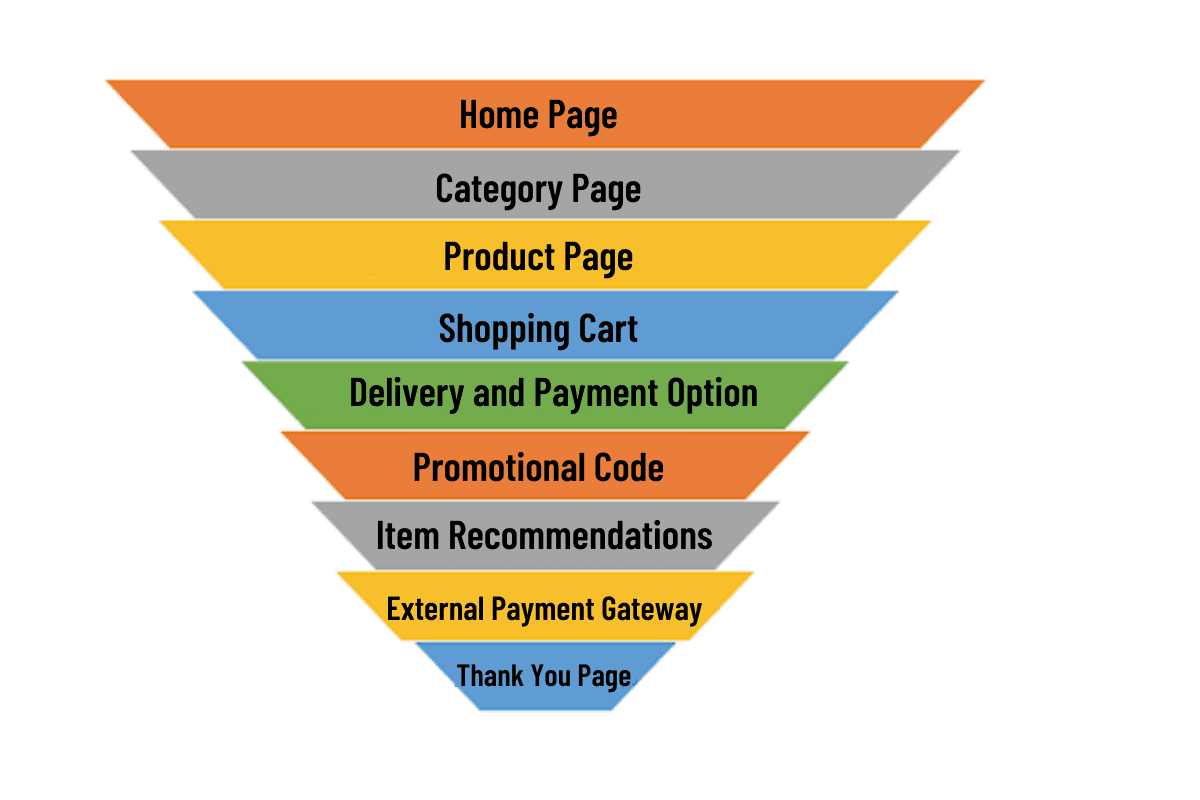
There are many ways to achieve a holistic answer, but there are two concepts that I never fail to mention: Conversion Funnels and LTVs. A conversion funnel describes the various stages of deliberation and experience that lead up to a final decision point by a user. The term ‘funnel’ is used to illustrate the natural attrition that occurs down the funnel. Always place the selection of metrics in the framework of a funnel, and it will make your answer sound more well thought-out! If you really want to get into the details of conversion funnels, check out this article that talks about seven different types of funnels. Better still, evaluate the long-term view of your metrics using the concept of Lifetime Value (LTV). This tells the interviewer that you think not just about the immediate consequences of a particular design decision, but also how it affects the user in the future and how it may affect other users too (externalities). In fact, I challenge you to go further and talk about how externalities actually violate the assumption of independence between control and treatment groups, and how we might want to control for that.
Sample Size
Talking about sample size in an A/B testing interview is non-negotiable. In general, the sample size required for the A/B test is dependent on three factors:
- Power of the test (typically ~0.8-0.9): Probability of rejecting the null hypothesis when the alternative hypothesis is true. Another way to think of power is 1 minus beta, where beta is the probability of a type 2 error, for those of you more familiar with statistical methods.
- Significance level of the test: The maximum possibility of falsely rejecting the null hypothesis when it is in fact true or type 1 error
- Minimal Desired Effect (MDE)
The MDE is the minimum improvement over a baseline you are willing to observe. For instance, if we are concerned about observing effects that result in a dollar increase in purchase for every ten dollars spent, we set the MDE to 10%.
In reality, most well-prepared interviewees won’t miss out to mention MDE somewhere in their answers, but the truly brilliant answers will go a step further. In the real world, it’s more efficient to forget about fixing the MDE exactly; instead, we should set limits that will enable better decision making. For instance, holding constant the MDE at 5%, we could calculate how many samples are needed for different levels of baselines. In general, the smaller the baseline, the larger the sample size required to detect the same MDE. Have a think about this to see why this is true intuitively.
P-value
What’s a p-value? And how does sample size affect the p-value?
This sounds like a relatively simple question, but you would be surprised by the number of interviewees who actually fumble when asked this question!
Here’s a paraphrased explanation for this question: https://platform.stratascratch.com/technical/2043-p-value
The p-value is the probability of finding the observed result under the Null Hypothesis. If you have more data, then the standard error (uncertainty)of the observed result decreases (since SE=std/sqrt(N)) and so the test statistic increases, and so we can have more confidence in rejecting the null. Also, the statistical power of your test (1-(probability of failure to reject the null when it is false) increases. Now, this information can make your hypothesis test stronger (effect size), but it is not related to our interpretation of the p-value.
Here’s another way to think about it. The p-value is a number from 0 to 1 that provides an indication of the level of statistical significance of the test results obtained, as opposed to a test result that is obtained just due to randomness. Specifically, the p-value measures the likelihood of obtaining your test result under the assumption that the null hypothesis is true. Typically, a p-value higher than 0.05 is convincing evidence that we cannot reject the null hypothesis of no effect.
Things get slightly more complicated when we do A/B/N testing, here’s where your knowledge from statistics class will come into use. For instance, if we have 4 treatment groups with one control group, what is the probability of observing at least 1 false positive? (type 1 error) [Hint: It’s not 0.05 * 4]
Here’s the answer:
Pr (FP = 0) = 0.95 * 0.95 * 0.95 * 0.95 = 0.8145
Therefore,
Pr (FP >= 1) = 1 - 0.8145 = 0.1854 (18.54%, NOT 20%)
Interference
Finally, let’s talk about interference, that is to say when the assumption of independence is violated between treatment and control groups. In the A/B testing world, everything is ideal because all except the treatment variable is controlled for. However, this ceteris paribus is simply untrue in the real world. This is especially the case for companies like Uber which offer services to users that are so interdependent on each other. Let’s talk about one of these interferences today and how you, as an interviewee, can wow your interviewer by sharing some potential solutions.
For companies like Uber and Lyft which offer two-sided markets, interference will result in what is often known as the overestimation bias, because resources are being co-utilized by members in both control and treatment groups. For instance, if Uber introduces a feature that attracts drivers in our treatment group, this will mean that fewer drivers are available in our control group, and the resultant estimation of the treatment effect will not be accurate.
That’s why the design of the experiment is so important! So what can we do about it? Firstly, we can consider randomizing by location so that we isolate the treatment and control groups sufficiently. By doing so, we prevent the imposition of externalities on the control group when the mechanisms of the treatment group are taking place. But there’s a hidden trade-off here: Isolating groups geographically might result in larger standard errors in our estimation of effects because now each treatment and control group might have more attributes that we are unable to control for. Think, for example, drivers in the central business core versus drivers in the rural areas. Ultimately, trade-offs have to be made and as an interviewee, you will want to mention them. Alternatively, we can randomize groups based on time. This overcomes our shortcoming based on geographical randomization, but only works if the treatment effect is supposed to last for a short time. If instead the treatment effect is meant to capture something like the effects of a peer referral scheme, then perhaps time randomization is not the most ideal.
What other factors could threaten your validity? There are many out there, and so the challenge for you is to think quickly on your feet during an interview and to give as many possible answers as you can. For more possible interferences, check out the following article.
Also, check out our previous post about a comprehensive statistics cheat sheet for Data Science interviews for important terms and equations for statistics and probability.
At the end of the day, A/B testing answers can and should really differ quite a lot depending on who’s asking the question and what the question is about. In my opinion, the most important thing is to Always Answer in Context! Anyone can regurgitate a memorized answer about hypothesis testing and the steps for A/B testing, but the truly outstanding candidate is one who knows how and when to apply the right techniques, and one who is able to adapt quickly to think about the pros and cons about different approaches depending on the hypothesis being tested.
Share