What Is PySpark? Everything You Need to Know


 Written by:
Nathan Rosidi
What is PySpark? A Deep Dive into PySpark's Powerful Features, Practical Applications, and Expert Tips for Optimization.
Picture a world where data is as massive as the universe, and the key to finding out what it all means is to handle it quickly. PySpark, an Apache Spark interface for Python, is like an astronaut in this world of data.
It moves quickly and accurately through vast amounts of data.
In this piece, I will discuss PySpark's environment, features, and what makes it unique in big data processing. Buckle up, and let’s get started!
What is PySpark?
PySpark is a Python Apache Spark interface. It exposes Spark to Python programmers and powers data processing and analysis. PySpark's ecosystem comprises Spark SQL, Spark Streaming, MLlib, and GraphX. Here is the official documentation.
This ecosystem handles several data-processing activities. Spark SQL can analyze structured data like Alan Turing decodes complex data in "The Imitation Game". PySpark alters data processing like Turing's machine did intelligence gathering.
Key Features and Benefits of Using PySpark
PySpark excels in large-scale data processing. It processes data in memory, which is quicker than disk-based processing. Python's familiar interface makes it accessible to many people. It's like employing a simple interface in a complicated system.
From one workstation to thousands of nodes, PySpark can handle data at any scale.
PySpark can handle real-time data with Spark Streaming to detect banking fraud.
Machine learning, graph processing, and other sophisticated analytics are supported.
PySpark delivers a complete and efficient data science platform by integrating these characteristics.
Integrating PySpark with Other Tools and Libraries
Jupyter Notebooks: These notebooks make writing and testing PySpark code easier.
Integration with Pandas: For more sophisticated data analysis, PySpark can be used alongside Pandas, combining the strengths of both tools.
Comparison with Other Data Processing Frameworks
PySpark differs from Hadoop and Pandas in several ways:
- Hadoop, with HDFS and MapReduce, excels in batch processing. PySpark can handle streaming and interactive queries and quickly process data using in-memory computing.
- Pandas is suitable for small to medium-sized datasets and has an easy-to-use interface. PySpark can process more huge datasets than a single computer, making it better for big data processing.
Like comparing cars, Hadoop is a heavy-duty truck for huge batch loads, and Pandas is a fast automobile for short excursions with lighter loads. PySpark handles massive and diverse data like a high-speed train.
Basic PySpark Operations

Creating RDDs, Transforming and Action Operations
Resilient Distributed Dataset (RDD) is the primary data structure in PySpark. The first thing you must do in any PySpark program is make an RDD. You can get them from outside data sources or change other RDDs to make them.
Creating RDDs: You can create RDDs using files from HDFS, S3, or other storage services. For example, a data scientist studying social media data might use files with tweet data to create RDDs.
Transformations: To work with data in RDDs, changes like map, filter, and reduceByKey are used. They are lazy processes, which means they wait to be run until something else is done.
Actions: Transformations occur when actions like collect, count, and saveAsTextFile are taken. For example, a data scientist might collect data to get results for more research after handling tweet data.
This method, in which changes and actions are separate, allows for the best possible handling of big datasets.
Using Spark SQL for Querying Data
Spark SQL is a part of PySpark that lets you work with organized data. It allows data scientists to query data from SQL and the DataFrame API, and users can easily mix SQL searches with PySpark code.
For example, think about looking at an extensive set of movie data. You could quickly write SQL queries in Spark SQL to find the most popular themes or the highest-grossing movies. This resembles how you would sort search results in a movie database. This feature makes exploring and analyzing data faster and easier to understand, especially for people who know SQL.
When you combine SQL and DataFrame API, you get a powerful and flexible tool for analyzing data, like having a toolbox with two tools that do different things.
Working with PySpark in Google Colab
Before we talk about how PySpark can be used in real life, let's set up a simple way for anyone to start exploring it without having to set up a complicated setting. Google Colab is a great place to do these kinds of investigations. In this part, I'll show you how to set up PySpark in Google Colab so that you have all the tools you need to try out the examples in this book.
Step-by-Step Setup
Update and Install Java : Even though Google Colab is a verstali tool, it doesn't come with Java loaded, which PySpark needs. First, put Java on your computer and update the source.
!apt-get update
!apt-get install openjdk-8-jdk-headless -qq > /dev/null
Download and Install Apache Spark: Next, download and unzip Apache Spark. We’re using Spark version 3.1.1 compatible with Hadoop 3.2, but feel free to use newer versions if available.
!wget -q http://archive.apache.org/dist/spark/spark-3.1.1/spark-3.1.1-bin-hadoop3.2.tgz
!tar xf spark-3.1.1-bin-hadoop3.2.tgz
Install and Initialize findspark: findspark is a helpful library that makes it easier to interconnect Spark and Python. Install and initialize it to add PySpark to the system path during runtime.
!pip install -q findspark
import findspark
findspark.init()
Set Environment Variables: Setting up environment variables helps Google Colab to locate Java and Spark installations.
import os
os.environ["JAVA_HOME"] = "/usr/lib/jvm/java-8-openjdk-amd64"
os.environ["SPARK_HOME"] = "/content/spark-3.1.1-bin-hadoop3.2"
Create a PySpark Session: Finally, initialize a PySpark session. This acts as an entry point to programming with Spark and PySpark.
from pyspark.sql import SparkSession
spark = SparkSession.builder.master("local[*]").getOrCreate()
Exploring PySpark in Colab
You are now ready to go on adventures in data processing and analysis since PySpark is now set up in Google Colab. No matter how skilled you are as a data scientist, Google Colab gives you an easy-to-use, cloud-based space to try out PySpark's features.
In the following part, we'll look at some real-world examples of how PySpark can be used to learn from the data.
Example of a Simple Data Analysis Project in PySpark

Let's look at a real-life example: a set of facts about weather worldwide. The goal is to figure out how temperatures have changed over time. Here you can find the data.
- Data Loading: Load the dataset into a PySpark DataFrame.
- Data Cleaning: Remove missing or incorrect temperature data.
- Analysis: Calculate the average temperature per year.
- Visualization: Plot these averages over time to observe trends.
Let’s start.
Data Loading
Here is the code.
from pyspark.sql import SparkSession
from pyspark.sql.functions import avg

# Initialize Spark session

spark = SparkSession.builder.appName('TemperatureAnalysis').getOrCreate()

# Load data

df = spark.read.csv('global_temperatures.csv', header=True, inferSchema=True)

df.show()
Here is the output.

Now let’s clean this data a little bit.
Data Cleaning
Here is the code to clean data, to find rows which did not include Null data.
Let’s see the code.
# Clean data
df_clean = df.filter(df.AverageTemperature.isNotNull())
# Show results
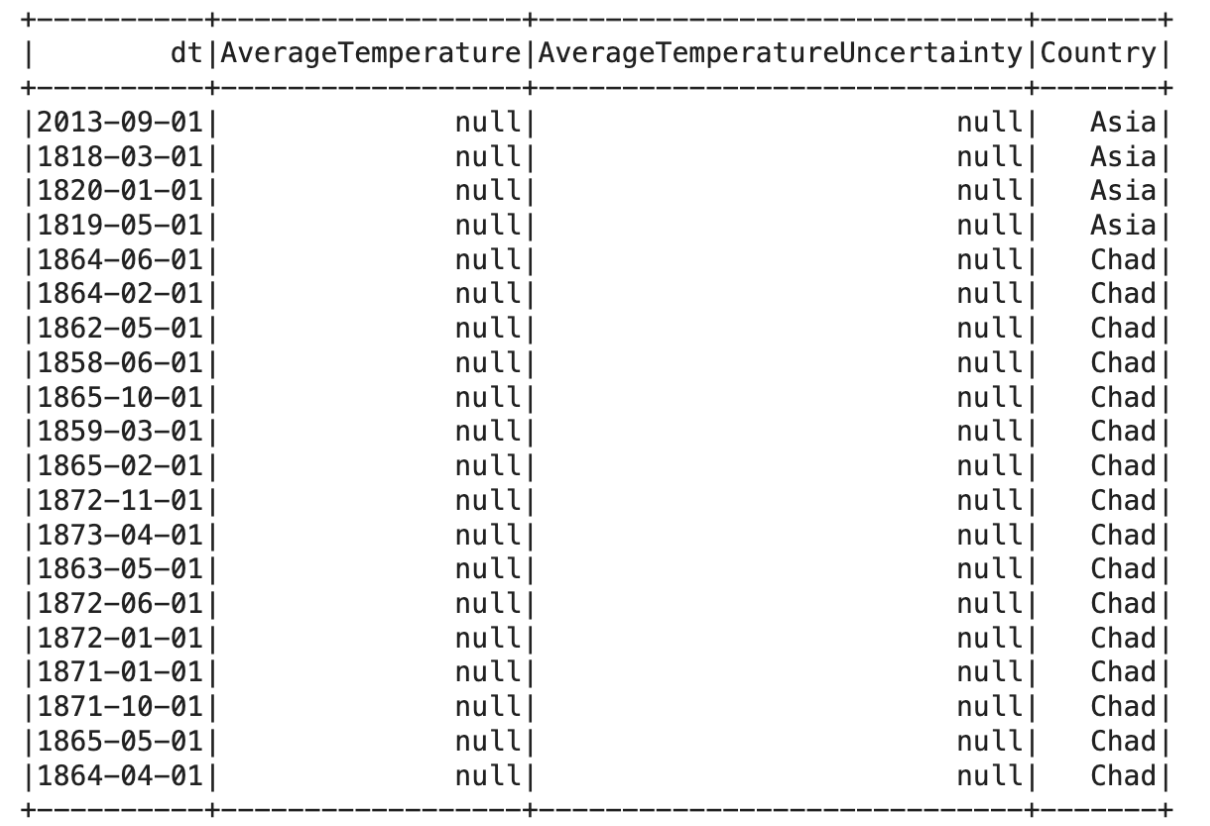
df_clean.show()
Here is the output.


Wonderful. Now, let’s do a little bit of data analysis.
Analysis
Now, let’s calculate the average temperature for each country.
Here is the code.
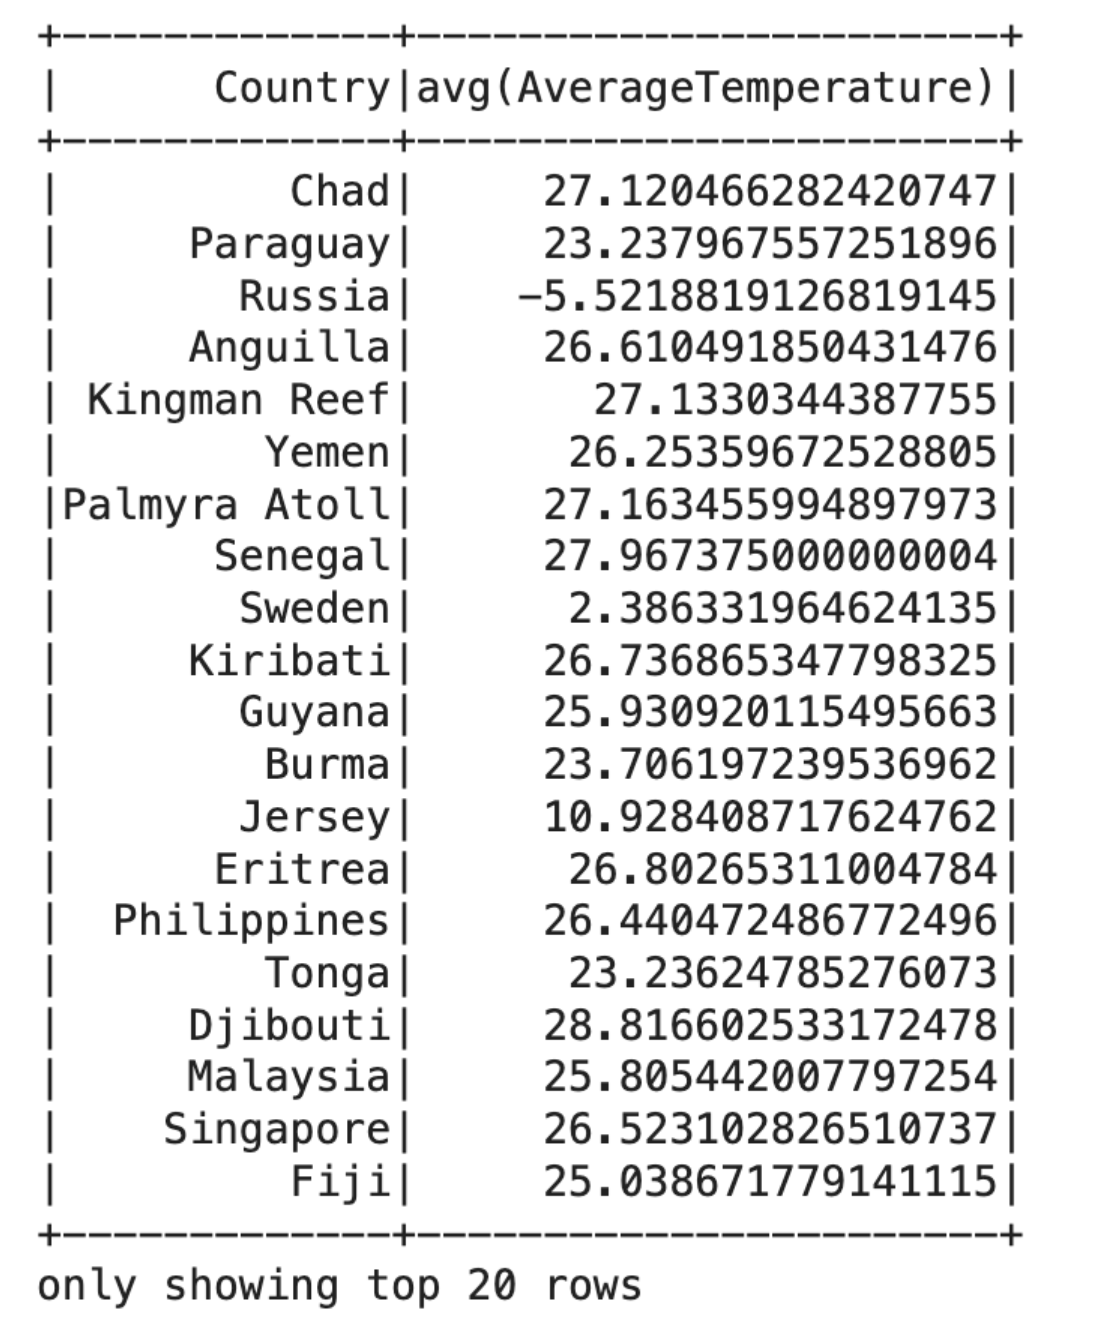
avg_temp_per_year = df_clean.groupBy('Country').agg(avg('AverageTemperature'))

avg_temp_per_year.show()
Here is the output.

Data Visualization
Now, let’s visualize our data a little bit. To do that, let’s first, create a new column, that will scrape the year from the “dt” column. Here is the code:
from pyspark.sql.functions import avg, col, substring
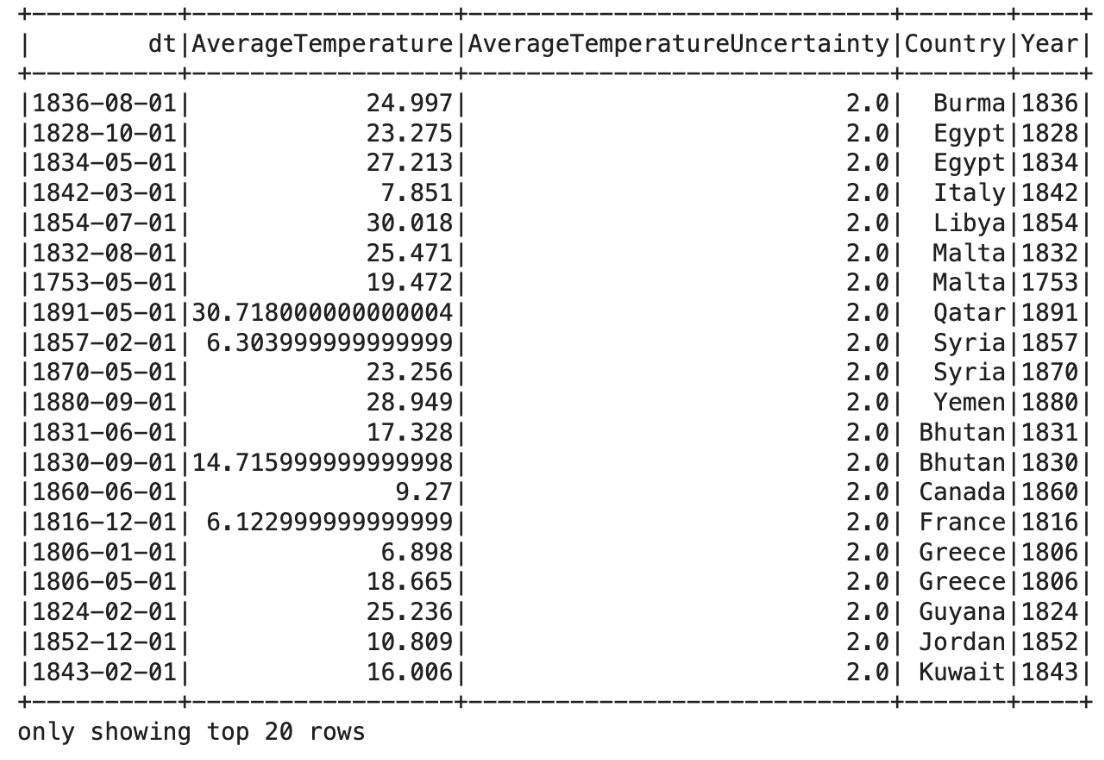
df_with_year = df_clean.withColumn('Year', substring('dt', 1, 4))
df_with_year.show()
Here is the output.

import matplotlib.pyplot as plt

# Convert to Pandas DataFrame for plotting
# Using df_with_year, as it contains both 'Year' and 'Country'

pdf = df_with_year.filter(df_with_year.Country == 'Turkey').toPandas()

# The Year column is probably string type, convert it to integer for sorting and
plotting pdf['Year'] = pdf['Year'].astype(int)

# Sort by year for consistent plotting

pdf = pdf.sort_values(by='Year')

# Aggregate average temperature per year (if not already aggregated)

pdf = pdf.groupby('Year')['AverageTemperature'].mean().reset_index()

# Plotting plt.figure(figsize=(12, 6))

plt.plot(pdf['Year']
pdf['AverageTemperature'])
plt.title('Average Temperature Trend in Turkey')
plt.xlabel('Year')
plt.ylabel('Average Temperature')
plt.show()
Here is the output.

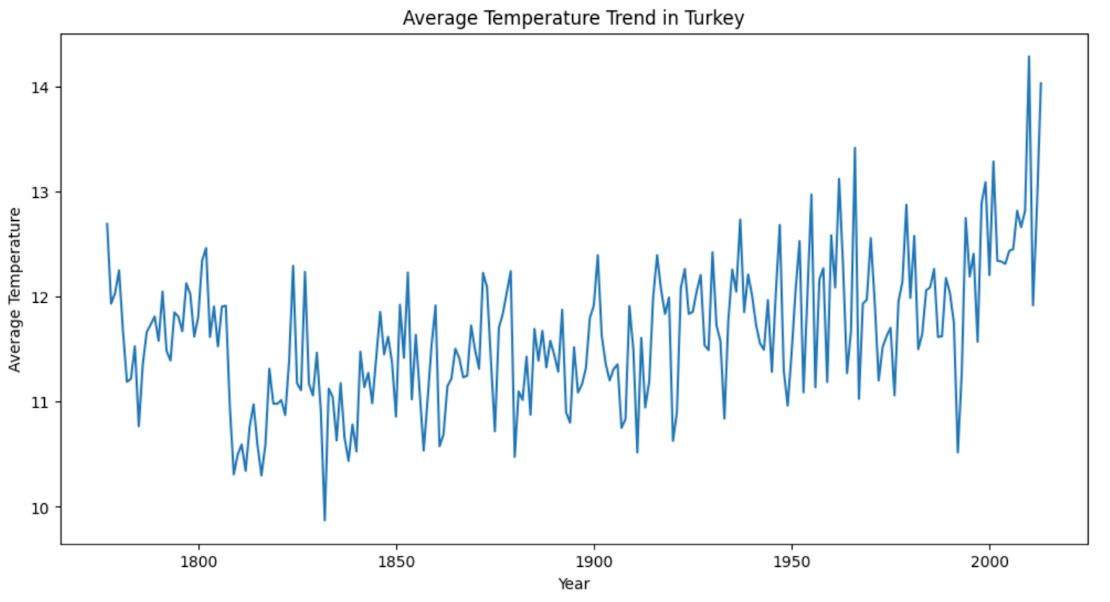
Now, to understand it better, let’s filter and sort, but to understand the output better, we’ll visualize it. Let’s start with Filtering.
Filtering
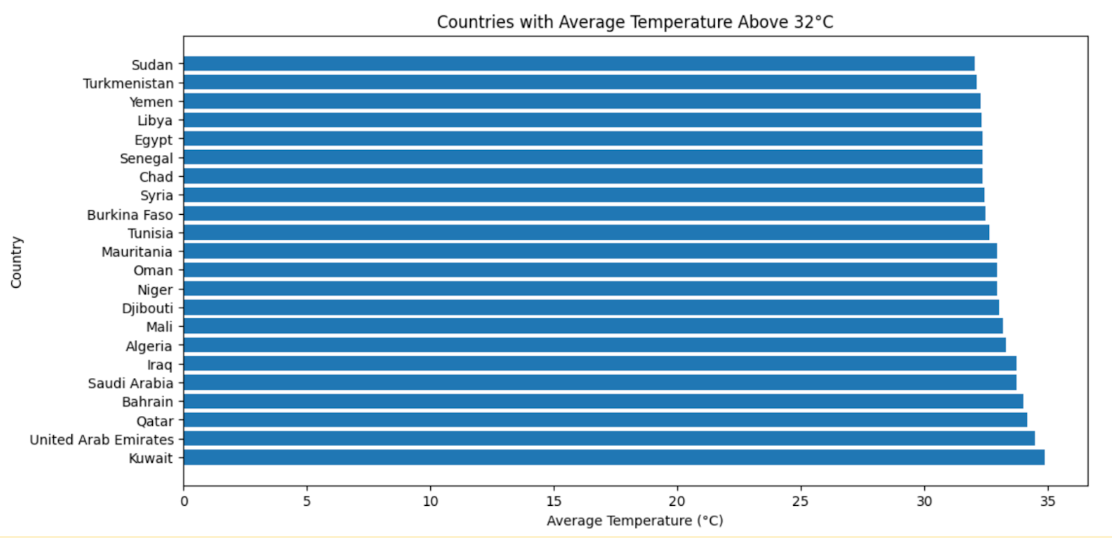
Now, let’s find the countries, that have average temperature greater then 32 degrees. Here is the code.
from pyspark.sql.functions import avg

# Filter for temperatures above 32 degrees
high_temp_df = df_with_year.filter(df_with_year['AverageTemperature'] > 32)

# Calculate average temperature for each country
avg_temp_high_countries = high_temp_df.groupBy('Country').agg(avg('AverageTemperature').alias('AvgTemp'))

# Convert to Pandas DataFrame for plotting
pdf = avg_temp_high_countries.toPandas()

# Sort the DataFrame for better visualization
pdf = pdf.sort_values(by='AvgTemp', ascending=False)

# Plotting
plt.figure(figsize=(12, 6))
plt.barh(pdf['Country'], pdf['AvgTemp'])
plt.title('Countries with Average Temperature Above 32°C')
plt.xlabel('Average Temperature (°C)')
plt.ylabel('Country')
plt.show()
Here is the output.

Sorting
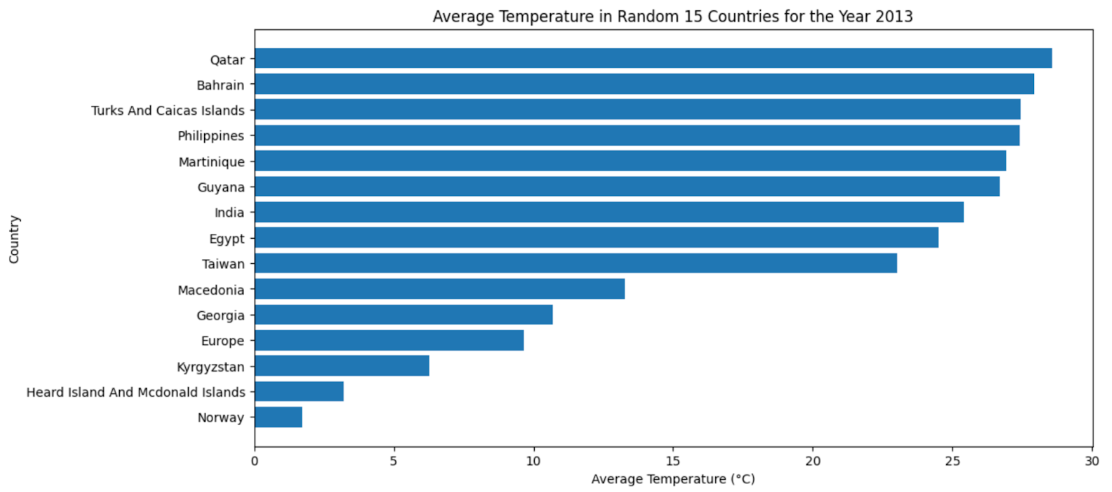
Sort countries by the latest year's average temperature. Now, to visualize the data for the most recent year in the DataFrame ;
- Identify the last year in the dataset
- Filter it
- Calculate the average temperature
- Convert to pandas df
- Randomly select 15 countries ( To be sure that the output will fit the graph)
- Plotting
Now let’s see the code.
from pyspark.sql.functions import avg
import random

# Identify the last year in the dataset
last_year = df_with_year.agg({'Year': 'max'}).collect()[0][0]

# Filter the dataset for the last year
last_year_df = df_with_year.filter(df_with_year['Year'] == last_year)

# Calculate the average temperature for each country for the last year
avg_temp_last_year = last_year_df.groupBy('Country').agg(avg('AverageTemperature').alias('AvgTemp'))

# Convert to Pandas DataFrame for further processing
pdf = avg_temp_last_year.toPandas()

# Randomly select 15 countries
random_countries = random.sample(pdf['Country'].tolist(), 15)
pdf_filtered = pdf[pdf['Country'].isin(random_countries)]

# Sort the DataFrame for better visualization
pdf_filtered = pdf_filtered.sort_values(by='AvgTemp', ascending=True)

# Plotting

plt.figure(figsize=(12, 6))
plt.barh(pdf_filtered['Country'], pdf_filtered['AvgTemp'])
plt.title(f'Average Temperature in Random 15 Countries for the Year {last_year}')
plt.xlabel('Average Temperature (°C)')
plt.ylabel('Country')
plt.show()
Here is the output.

If you want to find some essential practice questions from basics to advanced, check out our article “PySpark Interview Questions”.
Best Practices for Managing and Optimizing PySpark Applications
Efficient management and optimization of PySpark applications are crucial for maximum performance.
Here are some best practices:
- Utilize Data Partitioning: Partitioning data can improve speed.
- Cache Judiciously: Caching can make things go faster, but too much of it can cause memory problems.
- Use Broadcast Variables: When working with big reference data, broadcast variables make it easier to move data between nodes.
- Optimize Data Formats: Using efficient data forms like Parquet can improve performance.
- Tune Resource Allocation: Changing the resources (CPU, memory) given to Spark jobs can speed up processing.
- Monitor and Debug: Regular tracking and fixing can find problems before they happen.
By following these steps, you can be sure that PySpark applications will run easily, efficiently, and scalable.
Advanced Features and Techniques
You will find more advanced features and methods in PySpark that will make handling data easier as you learn.
Advanced-Data Processing Techniques
Graph Processing with GraphX: GraphX helps analyze data relationships.
Machine Learning with MLlib: MLlib has a group of algorithms for predictive analytics, like using high-tech gadgets in science fiction movies to guess what will happen.
Streaming Data with Spark Streaming: When handling data in real-time, Spark Streaming is like filming live events for a video.
Integrating PySpark with Other Tools and Libraries
Jupyter Notebooks: These notebooks make writing and testing PySpark code easier.
Integration with Pandas: For more sophisticated data analysis, PySpark can be used alongside Pandas, combining the strengths of both tools.
Performance Tuning and Optimization in PySpark
Dynamic Allocation of Resources: Automatically adjusting resources as needed can significantly improve performance.
Data Serialization: Choosing the proper serialization format can reduce the overhead of moving data around, like choosing the correct file format for a digital movie.
These advanced features and techniques allow for more nuanced and efficient data processing, like the difference between a good movie and a cinematic masterpiece.
Conclusion
In this article, we learned a lot about PySpark. We examined its ecosystem, features, and benefits over other data processing tools. We also discussed real-world cases and the best ways to use PySpark effectively. To stay ahead in data science and big data processing, which quickly changes, come to our site. You can find interview questions and data projects here, where you can solidify what you've learned and put it into practice.
Share