What Is a Python Abstract Class? When and How to Use It

Categories:
 Written by:
Nathan Rosidi
Learn how abstract classes help structure reusable Python code through a real student data analysis project
You know Object Oriented Programming, which allows you to develop reusable code. Abstract classes are one of these object-oriented programming concepts, and we will get deep into them. They will help you avoid duplication in your code, as we will discover.
These days, AI is so popular, but at the end of the article, you will see how Python Abstract Class automates a Data Project, as we will use a data project to analyze student achievement in Portagues, by using statistical methods.
But before that, what is an abstract class, and why and when must you use it? Let’s answer these questions, grab the logic, and start the project. Let’s start!
What Is an Abstract Class in Python?
An abstract class fundamentally serves as a special foundational plan for other classes you might design later.
You never create a direct object or an “instance” from this abstract class.
The primary purpose involves setting out a common structure. This defines some rules plus methods that other, more concrete classes will eventually follow.
For instance, check the image below. Here, the abstract class Vehicle defines the blueprint, while the Car class builds on it to create real objects.
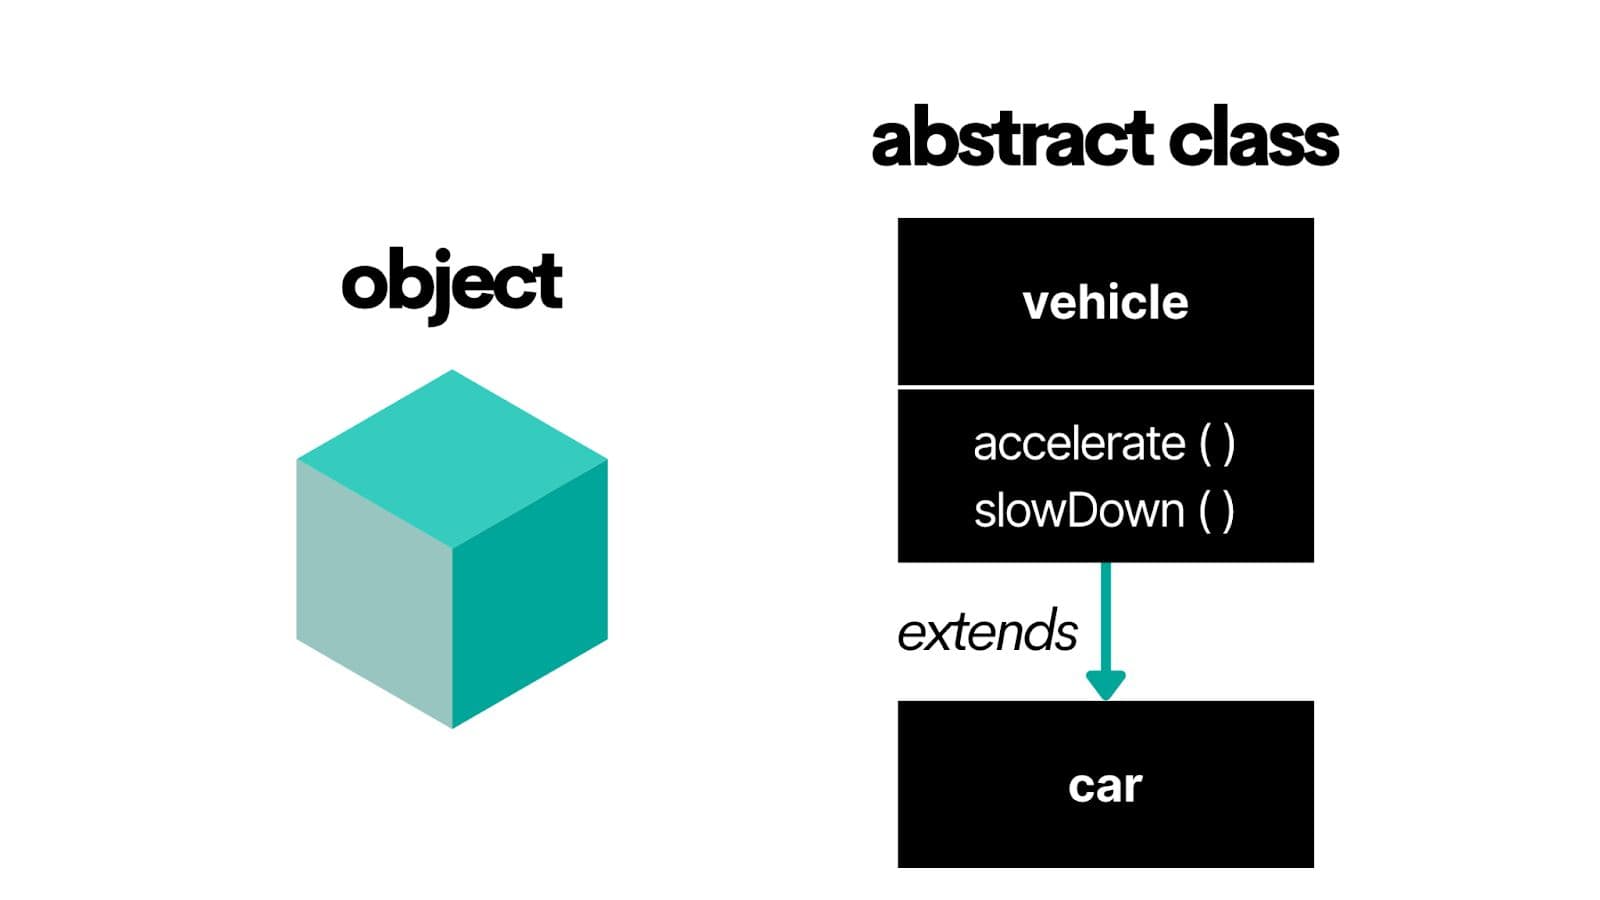
But how?
An abstract class sets up a list of functions that any class using it has to include. It doesn’t say how those functions work. It makes sure they exist.
And this keeps your code clean and consistent. Everything follows the same pattern, but you still have the freedom to decide the details.
Before diving into abstract classes, it's helpful to understand how a `class` in Python works. If you're unsure about how class-level methods function, check out this practical guide on the python class method.
Why and When to Use Abstract Classes in Python
Abstract classes will give us an option to define a shared structure for all analyzers to avoid duplication.
They are useful when you want multiple classes to follow the same structure. They make sure each class includes specific functions, keeping your code more organized and easier to manage.
If your project follows a clear step-by-step process, abstract classes help you keep things organized. They let you define shared steps once and reuse them across similar tasks. You'll see how helpful this is when we start applying it in the upcoming data project.
Let’s discover it by doing a data project.
Applying Abstract Classes to a Real Data Project: Analysing Student Performance
Link to this data project: https://platform.stratascratch.com/data-projects/student-performance-analysis
Project Description
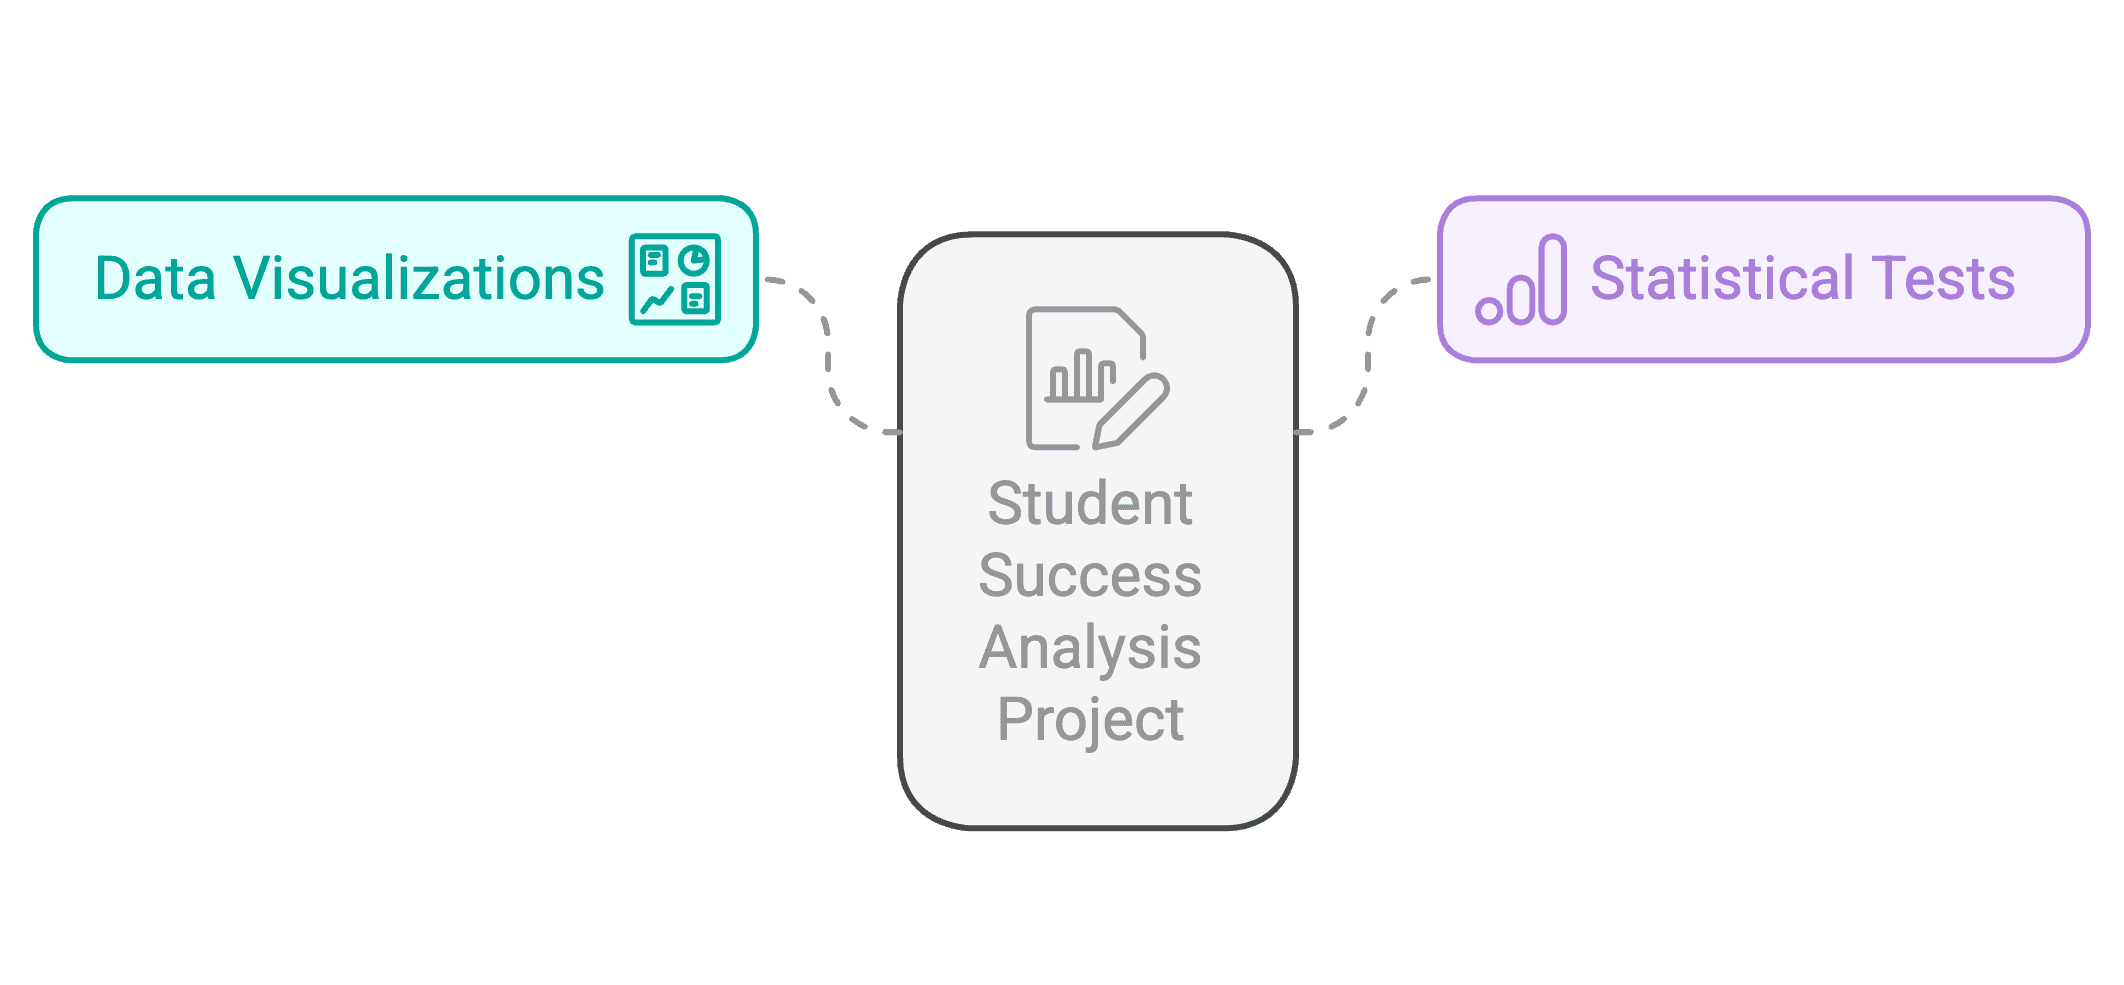
This project aims to analyze student achievement in Mathematics and the Portuguese language based on data from two Portuguese schools. To start the project, let’s first load and clean the data.
Class Structure Overview
To truly understand the power of abstraction in this project, let’s create our two core classes that we’ll use for the project:
- StudentDataAnalyzer
- MathDataAnalyzer
StudentDataAnalyzer is an abstract base class. It defines the structure and expectations: methods like load_data(), clean_data(), explore_data(), and others are listed but left empty using the pass keyword. This is by design. The class doesn't do the analysis, it just declares what every subclass must do.
This brings us to MathDataAnalyzer, a concrete subclass. It inherits from StudentDataAnalyzer and implements all those methods with real logic tailored to our student dataset. This pattern is grounded in the object-oriented programming principles we discussed earlier: the abstract class serves as the blueprint, and the concrete class creates the actual object.
This separation ensures code reusability, enforces structure, and keeps logic modular. In practice, if you wanted to analyze a different dataset (say Portuguese scores or science scores), you'd just create a new subclass; no need to rewrite shared logic.
Load and Clean Data Using a Python Abstract Class
These functions are defined inside the MathDataAnalyzer class. It is responsible for the implementation of the analysis steps. We define them here rather than in the StudentDataAnalyzer base class because the base class is abstract; it only outlines which functions every subclass must have, without explaining how they work.
Each method in the base class uses pass, acting as a placeholder and enforcing structure.
The MathDataAnalyzer, as a concrete subclass, is where the logic comes to life. For example, the load_data() method reads a CSV file with student performance data, and clean_data() fills missing values with zero.
import pandas as pd
from abc import ABC, abstractmethod

class StudentDataAnalyzer(ABC):
    def __init__(self, filepath):
        self.filepath = filepath
        self.data = None

    @abstractmethod
    def load_data(self):
        pass

    @abstractmethod
    def clean_data(self):
        pass

    @abstractmethod
    def explore_data(self):
        pass

    @abstractmethod
    def visualize_data(self):
        pass

    @abstractmethod
    def perform_statistical_analysis(self):
        pass

    @abstractmethod
    def run(self):
        pass

class MathDataAnalyzer(StudentDataAnalyzer):
    def load_data(self):
        self.data = pd.read_csv(self.filepath, sep=';')
        print("✅ Math data loaded.")

    def clean_data(self):
        self.data.fillna(0, inplace=True)
        print("🧹 Math data cleaned.")

    def explore_data(self):
        print("🔎 Data exploration not yet implemented.")

    def visualize_data(self):
        print("📊 Visualization not yet implemented.")

    def perform_statistical_analysis(self):
        print("📈 Statistical analysis not yet implemented.")

    def run(self):
        self.load_data()
        self.clean_data()

    def run(self):
        self.load_data()
        self.clean_data()
        self.explore_data()
        self.visualize_data()
        self.perform_statistical_analysis()
Now we mentioned this structure. The abstract class ensures that every analyzer follows the same flow. But how would you run it?
How to Run It?
Here is the code:
math_analyzer = MathDataAnalyzer('student-mat.csv')
math_analyzer.run()
Now let’s see the output.
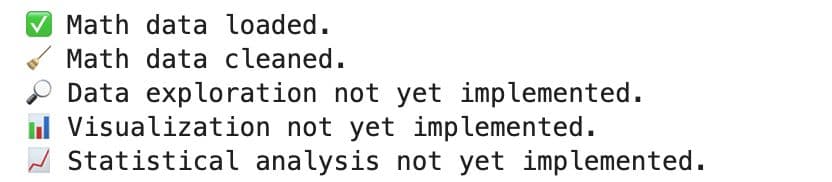
And just in two seconds, you will load and clean the data, and see the progress and steps that will come ahead.
While the dataset used here is already clean and contains no missing values, the cleaning step is still important for maintaining a consistent workflow, especially when adapting the script for different datasets that might contain nulls or irregularities.
Exploring Data Through a Python Abstract Class Implementation
Now that we’ve cleaned the data, we will explore it and understand what we’re working with.
The explore_data() method in the MathDataAnalyzer class does this by printing the first few rows, showing data types and column info, and summarizing statistics.
Remember, the exploration logic is written inside the concrete class, not the abstract base class. Each subject or dataset might need different ways to explore the data. So we left the structure in StudentDataAnalyzer and filled in the details in MathDataAnalyzer.
Here is the code to explore the data.
import pandas as pd
from abc import ABC, abstractmethod
class StudentDataAnalyzer(ABC):
def __init__(self, filepath):
self.filepath = filepath
self.data = None
@abstractmethod
def load_data(self):
pass
@abstractmethod
def clean_data(self):
pass
@abstractmethod
def explore_data(self):
pass
@abstractmethod
def visualize_data(self):
pass
@abstractmethod
def perform_statistical_analysis(self):
pass
@abstractmethod
def run(self):
pass
class MathDataAnalyzer(StudentDataAnalyzer):
def load_data(self):
self.data = pd.read_csv(self.filepath, sep=';')
print("✅ Math data loaded.")
def clean_data(self):
self.data.fillna(0, inplace=True)
print("🧹 Math data cleaned.")
def explore_data(self):
print("\n🔍 First 5 Rows:")
print(self.data.head())
print("\n📋 Data Info:")
print(self.data.info())
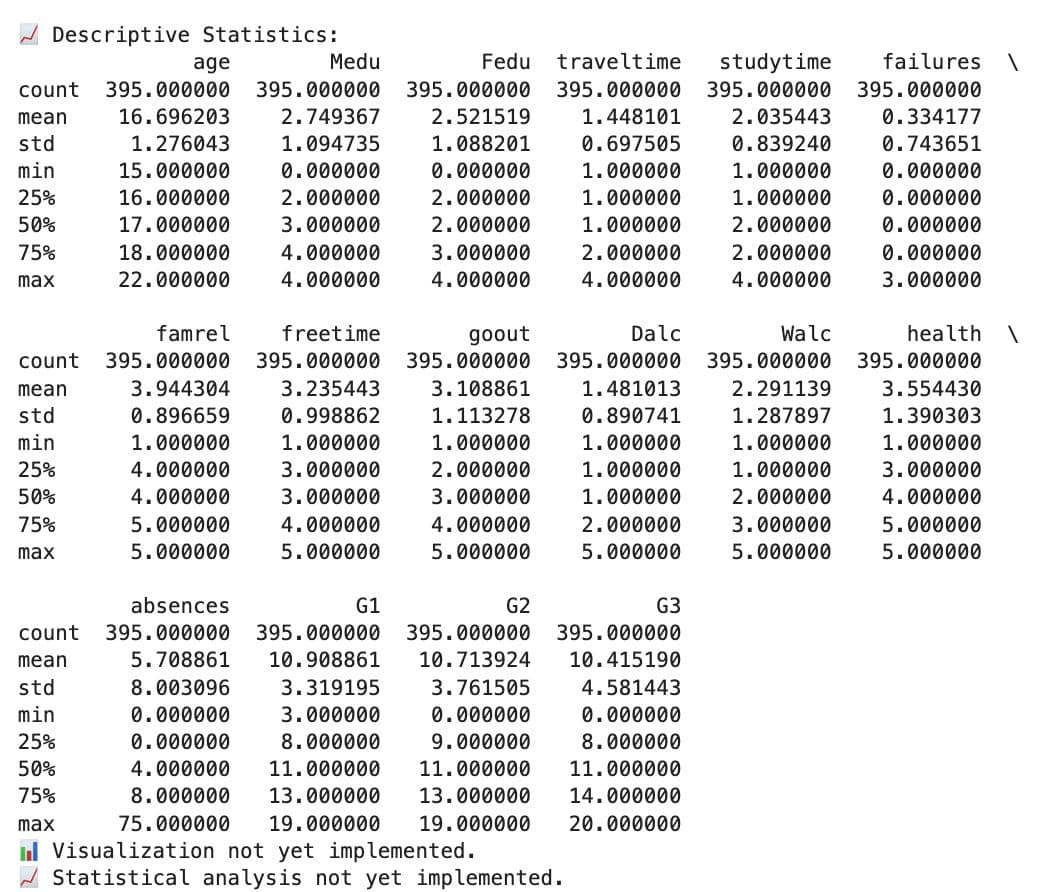
print("\n📈 Descriptive Statistics:")
print(self.data.describe())
def visualize_data(self):
print("📊 Visualization not yet implemented.")
def perform_statistical_analysis(self):
print("📈 Statistical analysis not yet implemented.")
def run(self):
self.load_data()
self.clean_data()
self.explore_data()
self.visualize_data()
self.perform_statistical_analysis()
Before proceeding with the data analysis, we must first understand the data, which we will do. Let’s see how to run it once again.
How to Run It?
Here is the code:
math_analyzer = MathDataAnalyzer('student-mat.csv')
math_analyzer.run()
Now let’s see the output.
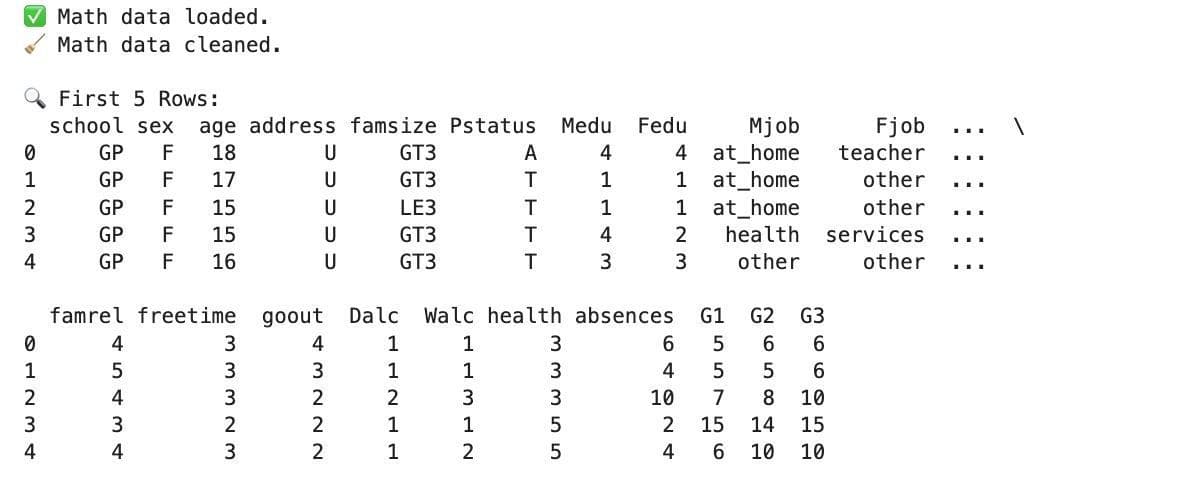
Good, but it did not end.
Visualizing Data with a Python Abstract Class Framework
We’ve explored the data, so it’s time to visualize it. We’ll keep this short, since we’ve already explained how each function fits into the project structure.
The visualize_data() method is part of the MathDataAnalyzer class, like others. We put it here because the visuals and what we want to highlight can change based on the subject.
Good, now we know what the data is all about. Now let’s create some visualizations. Here is the code.
from abc import ABC, abstractmethod

class StudentDataAnalyzer(ABC):
    def __init__(self, filepath):
        self.filepath = filepath
        self.data = None

    @abstractmethod
    def load_data(self):
        pass

    @abstractmethod
    def clean_data(self):
        pass

    @abstractmethod
    def explore_data(self):
        pass

    @abstractmethod
    def visualize_data(self):
        pass

    @abstractmethod
    def perform_statistical_analysis(self):
        pass

    @abstractmethod
    def run(self):
        pass

class MathDataAnalyzer(StudentDataAnalyzer):
    def load_data(self):
        self.data = pd.read_csv(self.filepath, sep=';')
        print("✅ Math data loaded.")

    def clean_data(self):
        self.data.fillna(0, inplace=True)
        print("🧹 Math data cleaned.")

    def explore_data(self):
        print("\n🔍 First 5 Rows:")
        print(self.data.head())

        print("\n📋 Data Info:")
        print(self.data.info())

        print("\n📈 Descriptive Statistics:")
        print(self.data.describe())

    def visualize_data(self):
        print("\n📌 Dataset Columns:")
        print(self.data.columns.tolist())

        print("\n📊 Histograms for Grades and Study Time:")
        features = ['G1', 'G2', 'G3', 'age', 'studytime']
        self.data[features].hist(figsize=(10, 6), bins=15)
        plt.tight_layout()
        plt.show()

        print("\n📦 Box Plot: G3 by Gender")
        plt.figure(figsize=(6, 4))
        sns.boxplot(data=self.data, x='sex', y='G3')
        plt.title('Final Grade (G3) by Gender')
        plt.show()

        print("\n📉 Bar Plot: Avg G3 by Internet Access")
        plt.figure(figsize=(6, 4))
        sns.barplot(data=self.data, x='internet', y='G3', estimator='mean', errorbar=None)
        plt.title('Average G3 by Internet Access')
        plt.show()

        print("\n📊 Bar Plot: Avg G3 by Mother\'s Education (Medu)")
        plt.figure(figsize=(6, 4))
        sns.barplot(data=self.data, x='Medu', y='G3', estimator='mean', errorbar=None)
        plt.title("Average G3 by Mother's Education")
        plt.show()

    def perform_statistical_analysis(self):
        print("📈 Statistical analysis not yet implemented.")
    def run(self):
        self.load_data()
        self.clean_data()
        self.explore_data()
        self.visualize_data()
        self.perform_statistical_analysis()
You know what comes next? Let’s see how to run it.
How to Run It?
math_analyzer = MathDataAnalyzer('student-mat.csv')
math_analyzer.run()
Let’s see the output.
Statistical Modeling Within a Python Abstract Class Setup
In this step, we apply two basic statistical tests. The first one is a T-Test, which checks whether students with internet access have significantly different final grades than those without. The second is a chi-squared test, which examines the relationship between parental cohabitation status and whether a student passes or fails.
Good, now we are at the final step: statistical modeling. Let’s see the code:
from abc import ABC, abstractmethod
import pandas as pd
import matplotlib.pyplot as plt
import seaborn as sns
from scipy.stats import ttest_ind, chi2_contingency

class StudentDataAnalyzer(ABC):
    def __init__(self, filepath):
        self.filepath = filepath
        self.data = None

    @abstractmethod
    def load_data(self):
        pass

    @abstractmethod
    def clean_data(self):
        pass

    @abstractmethod
    def explore_data(self):
        pass

    @abstractmethod
    def visualize_data(self):
        pass

    @abstractmethod
    def perform_statistical_analysis(self):
        pass

    @abstractmethod
    def run(self):
        pass

class MathDataAnalyzer(StudentDataAnalyzer):
    def load_data(self):
        self.data = pd.read_csv(self.filepath, sep=';')
        print("✅ Math data loaded.")

    def clean_data(self):
        self.data.fillna(0, inplace=True)
        print("🧹 Math data cleaned.")

    def explore_data(self):
        print("\n🔍 First 5 Rows:")
        print(self.data.head())

        print("\n📋 Data Info:")
        print(self.data.info())

        print("\n📈 Descriptive Statistics:")
        print(self.data.describe())

    def visualize_data(self):
        print("\n📌 Dataset Columns:")
        print(self.data.columns.tolist())

        print("\n📊 Histograms for Grades and Study Time:")
        features = ['G1', 'G2', 'G3', 'age', 'studytime']
        self.data[features].hist(figsize=(10, 6), bins=15)
        plt.tight_layout()
        plt.show()

        print("\n📦 Box Plot: G3 by Gender")
        plt.figure(figsize=(6, 4))
        sns.boxplot(data=self.data, x='sex', y='G3')
        plt.title('Final Grade (G3) by Gender')
        plt.show()

        print("\n📉 Bar Plot: Avg G3 by Internet Access")
        plt.figure(figsize=(6, 4))
        sns.barplot(data=self.data, x='internet', y='G3', estimator='mean', errorbar=None)
        plt.title('Average G3 by Internet Access')
        plt.show()

        print("\n📊 Bar Plot: Avg G3 by Mother's Education (Medu)")
        plt.figure(figsize=(6, 4))
        sns.barplot(data=self.data, x='Medu', y='G3', estimator='mean', errorbar=None)
        plt.title("Average G3 by Mother's Education")
        plt.show()

    def perform_statistical_analysis(self):
        print("\n🔬 T-Test: Internet Access vs Final Grades")
        internet_yes = self.data[self.data['internet'] == 'yes']['G3']
        internet_no = self.data[self.data['internet'] == 'no']['G3']

        t_stat, p_val = ttest_ind(internet_yes, internet_no, equal_var=False)
        print(f"T-statistic: {t_stat:.2f}, P-value: {p_val:.4f}")
        if p_val < 0.05:
            print("✅ Statistically significant difference in grades based on internet access.")
        else:
            print("❌ No statistically significant difference found.")

        print("\n🧮 Chi-Square Test: Parental Cohabitation vs Grade Performance")
        self.data['performance'] = self.data['G3'].apply(lambda x: 'pass' if x >= 10 else 'fail')
        contingency = pd.crosstab(self.data['Pstatus'], self.data['performance'])

        chi2, p, dof, expected = chi2_contingency(contingency)
        print(f"Chi2: {chi2:.2f}, P-value: {p:.4f}")
        if p < 0.05:
            print("✅ Significant association between parental status and student performance.")
        else:
            print("❌ No significant association detected.")

    def run(self):
        self.load_data()
        self.clean_data()
        self.explore_data()
        self.visualize_data()
        self.perform_statistical_analysis()
How to Run It?
math_analyzer = MathDataAnalyzer('student-mat.csv')
math_analyzer.run()
Here is the output.
I left the statistical analysis to you, but if you want to see the full report, visit here.
Final Thoughts
In this article, we saw how a Python abstract class brings structure and clarity to a data project. It helped us lay out the key steps like loading, cleaning, and analyzing without repeating code.
We kept things clean and flexible by separating the structure into an abstract base class and the logic into a concrete class. This makes it easy to build new analyzers later while sticking to a clear and reusable format.
If you're preparing for interviews and want to reinforce your understanding of Python concepts like abstract classes, be sure to review these python interview questions often asked by hiring managers.
Share