Python vs R for Data Science

 Written by:
Nathan Rosidi
Python vs R: R is an established language. Python is rapidly growing. Pitting one against the other, which will be the best language for Data Science?
As the world’s internet population grows, so does the amount of data to be collected, organized, and utilized for any purpose. It is estimated that the global data generation will triple between 2025 and 2029; from 173.4 to 527.5 zettabytes.
With these large amounts of data, the need for data scientists and data analysts will increase as well. Yes, they will have to be fluent in various AI tools. But the ‘heritage’ tools like Python and R are going nowhere any time soon.
Today, we’ll examine those two major programming languages used in data science.
We will review each language with talking points focused on market saturation, ease of use and learning, data collection, visualizations, and machine learning. Is there one language that’s better than the other?
Python vs R: Introduction
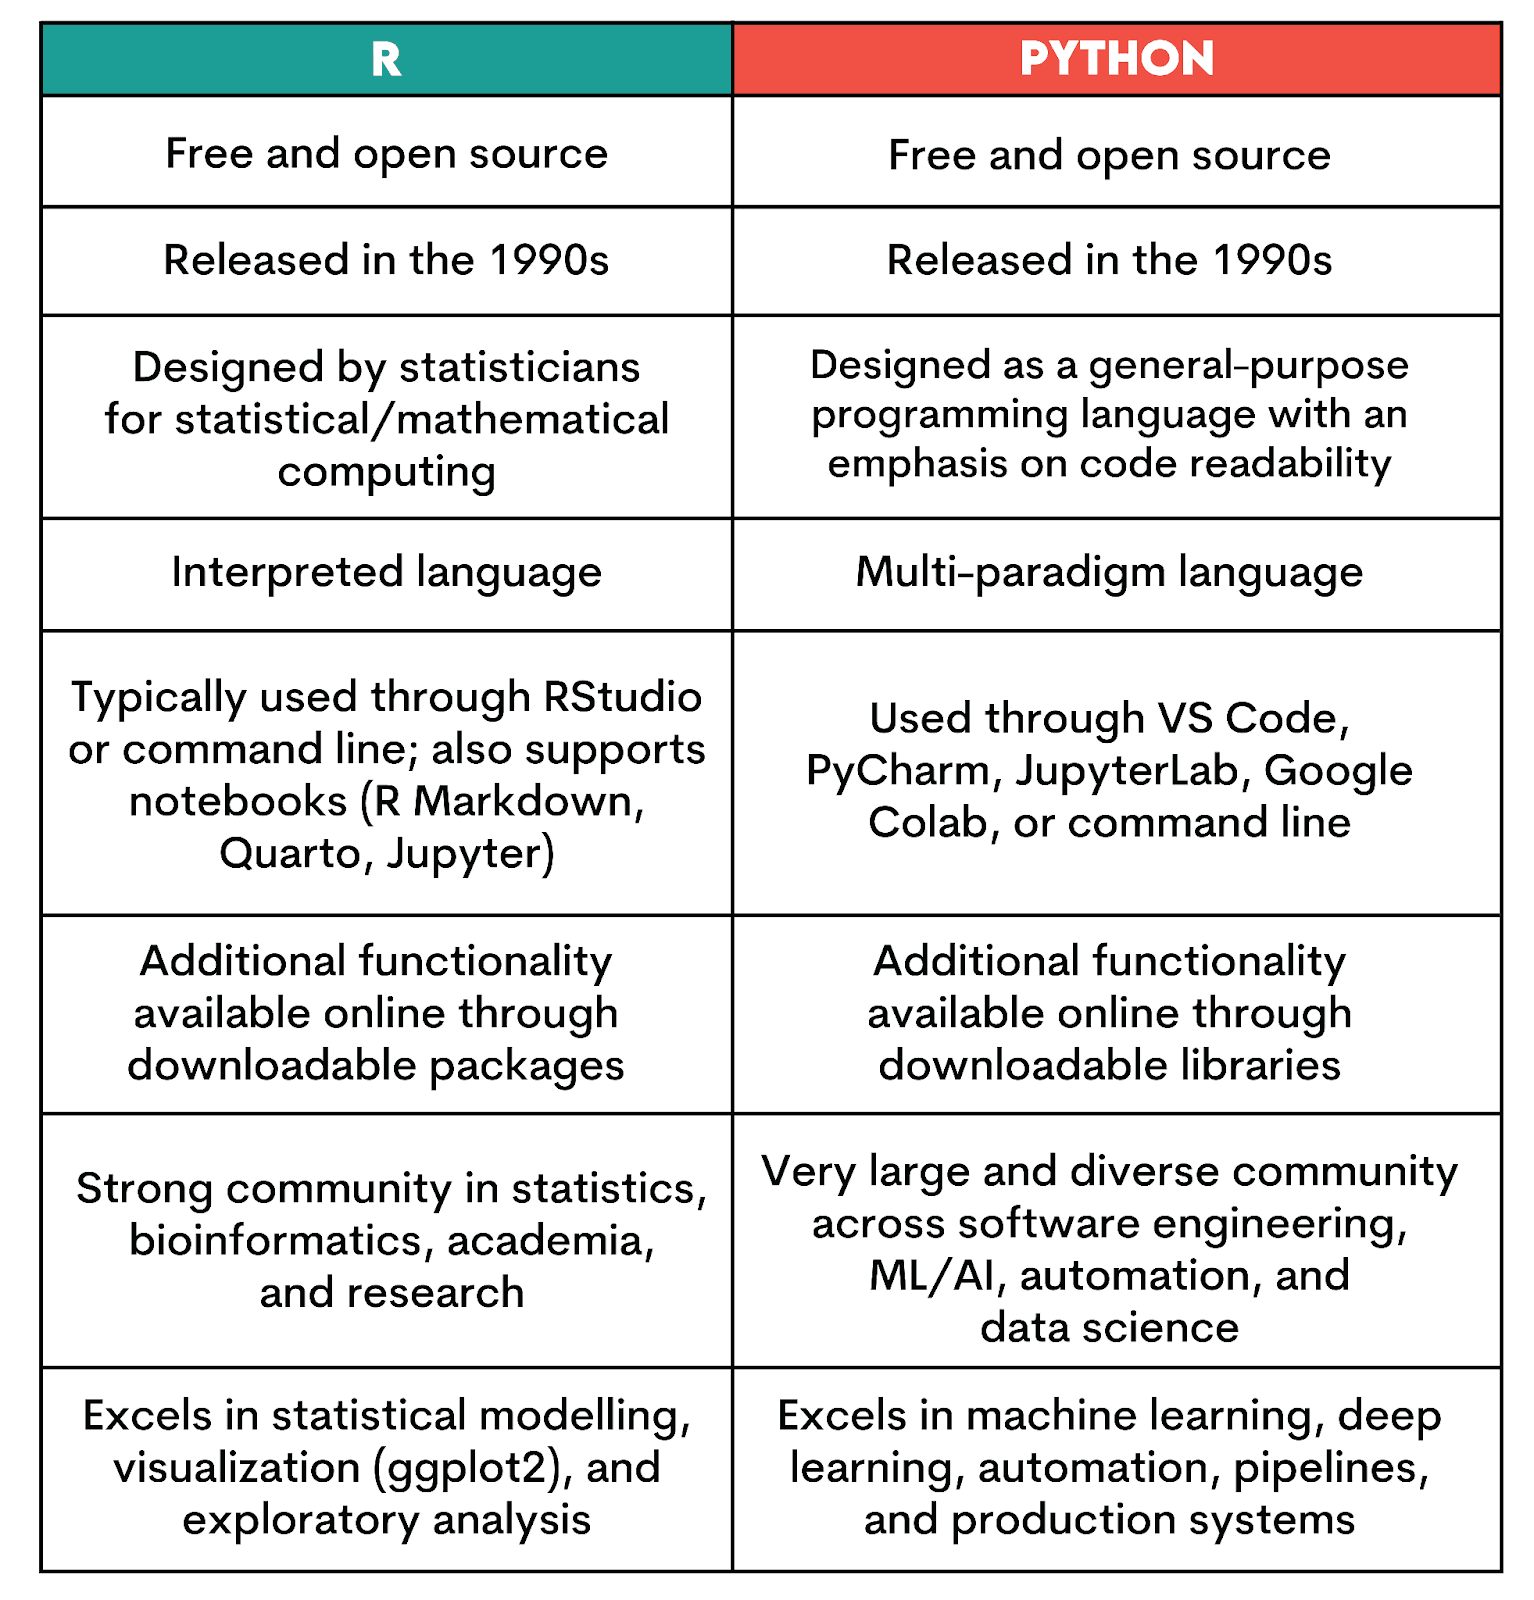
Let’s first cover the basic facts about each language.
Python
Python is an open source multi-paradigm programming language developed by Guido van Rossum from 1989 to its first release in 1994. After working on ABC (a general-purpose programming language and integrated IDE), van Rossum originally designed Python to interface with the Amoeba operating system.
As a multi-paradigm language, Python can support OOP, structured programming, as well as aspect-oriented programming. Python doesn’t require a specific Integrated Development Environment (IDE), but most data scientists use them to streamline coding, debugging, and package management.
Common IDEs include JupyterLab, VS Code, PyCharm, and browser-based notebook platforms like Google Colab. Many also pair these with lightweight editors such as Vim or Sublime Text.
Given the versatility of multi-paradigm support, Python can be found anywhere in the fields of computer & data science: software engineering, automation, AI and machine learning, data analysis, and visualization.
R
R is an interpreted language developed by Ross Ihaka and Robert Gentleman, released as open-source software in 1995. The development of R actually took place over four years between 1991 and 1995. Still, after its public debut, it was another five years before the first official stable beta release was released in 2000.
The development of R improved the S programming language (a statistical computing language developed in the 70s) by combining it with the lexical scoping semantics of Scheme, which allows objects to be treated as blocks of code rather than the program as a whole.
Interpreted languages directly execute instructions written using code and commands using an interpreter rather than a compiler, as used in other paradigms like Object-Oriented Programming (OOP).
R, too, runs code directly through an interpreter, either from the command line or, more commonly, through environments such as RStudio (now part of Posit) or notebooks built with R Markdown, Quarto, or Jupyter (via IRkernel).
With its background in statistics, R is widely used in academia, biostatistics, pharmaceutical research, finance, epidemiology, and experimental data analysis. Its ecosystem, especially CRAN and Bioconductor, provides excellent tools for applied statistics, time-series analysis, causal inference, and domain-specific modeling.
Python vs R: Quick Comparison
When Basic Features Are Not Enough: Packages & Libraries
What really makes R and Python popular is not their basic capabilities. Yes, they’re great, credit to their developers. However, most advanced capabilities that you’d think are ‘native’ to R or Python actually come from external packages.
In R, these are called ‘packages’, and in Python, ‘libraries’ or ‘modules’.
Python Libraries
Python libraries are primarily distributed through the Python Package Index (PyPI). This is the official Python repository used with tools such as pip. All the major libraries – pandas, NumPy, SciPy, scikit-learn, Matplotlib, TensorFlow – are available like that.
Libraries can also be found on:
- conda-forge and Anaconda channels – popular for easy environment management and compiled binaries
- GitHub – development versions and open-source contributions
R Packages
R packages are primarily available through the Comprehensive R Archive Network (CRAN), which hosts thousands of them. To ensure quality, CRAN enforces a strict submission and review process.
Other than CRAN, these are also major R ecosystems:
- Bioconductor – used in genomics and bioinformatics
- GitHub – packages not submitted to CRAN, development versions, and experimental packages
- Posit Package Manager – a mirror service used in enterprise settings
Getting Our Hands Dirty: Comparing Python vs R in Real Data Science Tasks
After covering the basic info, we’re now ready to start comparing how well-suited for data science those languages are.
We’ll compare them across the key stages of the data science pipeline, language communities, and job possibilities.
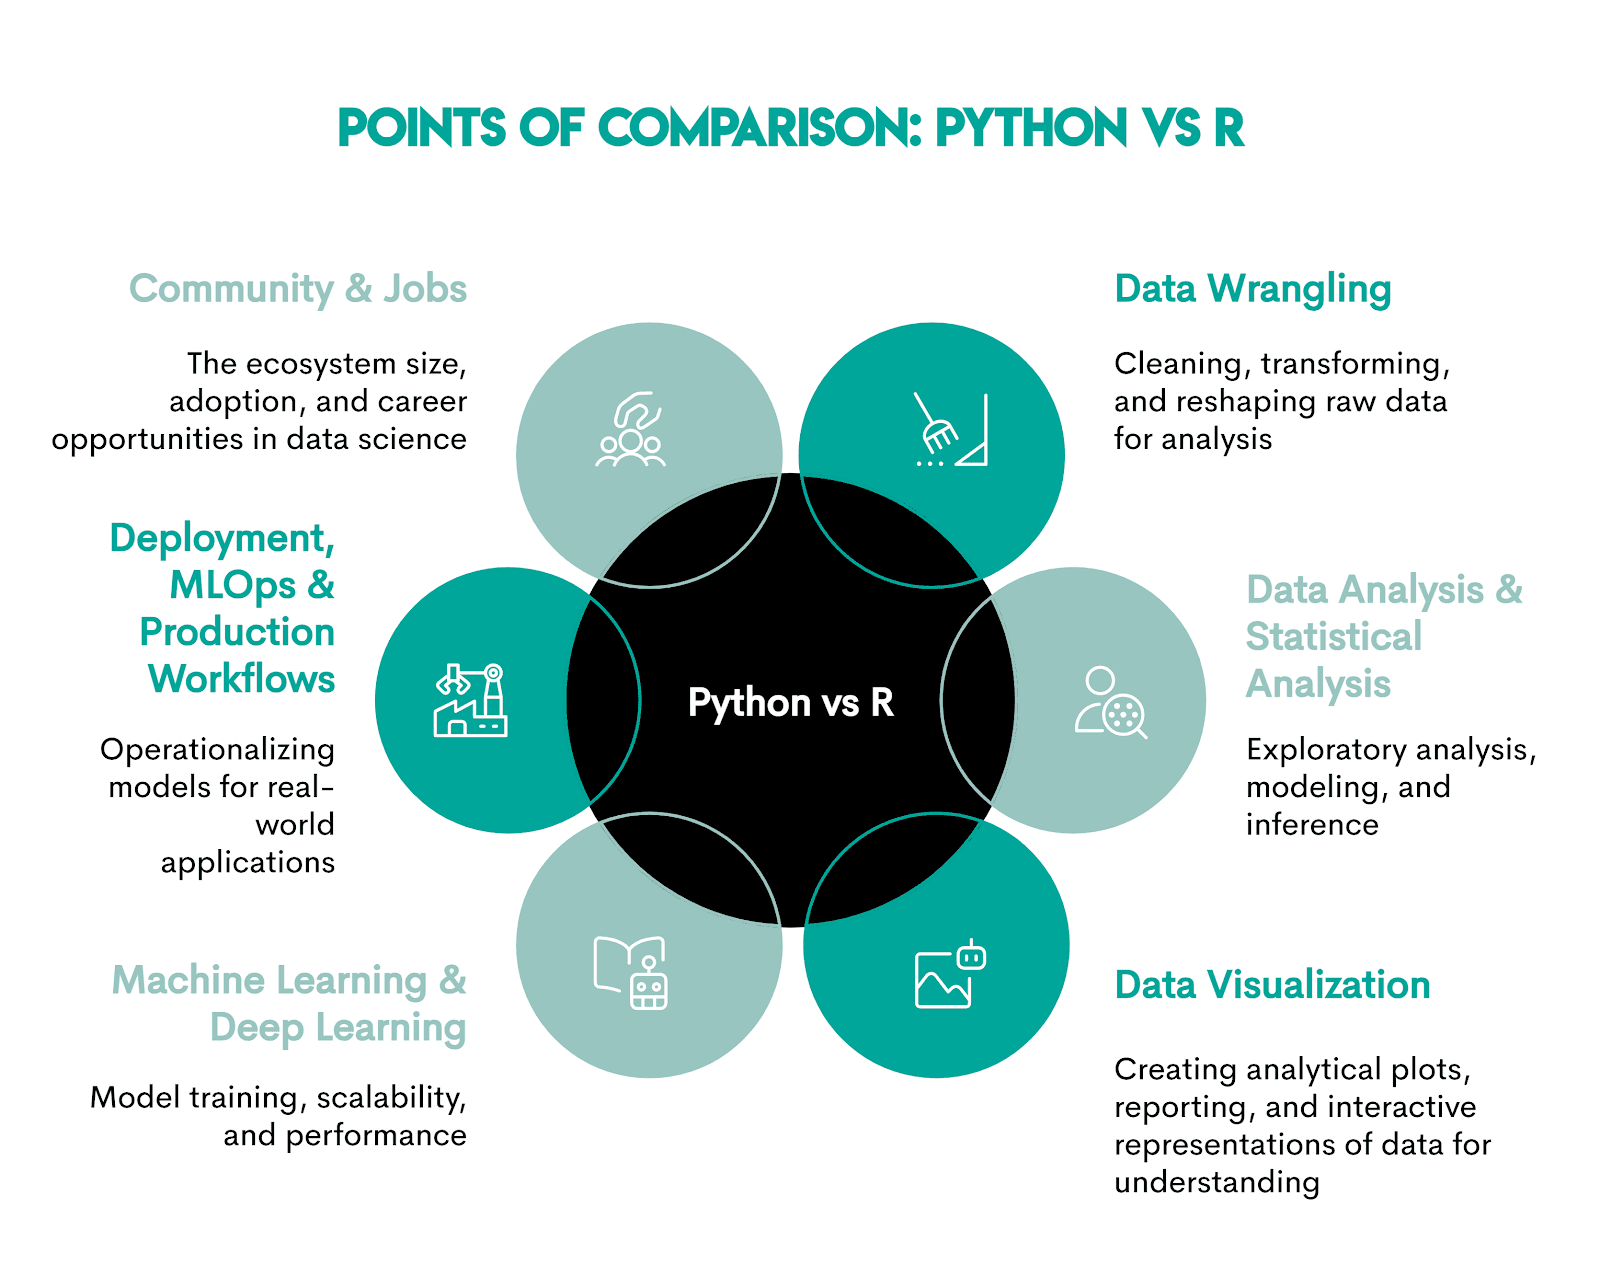
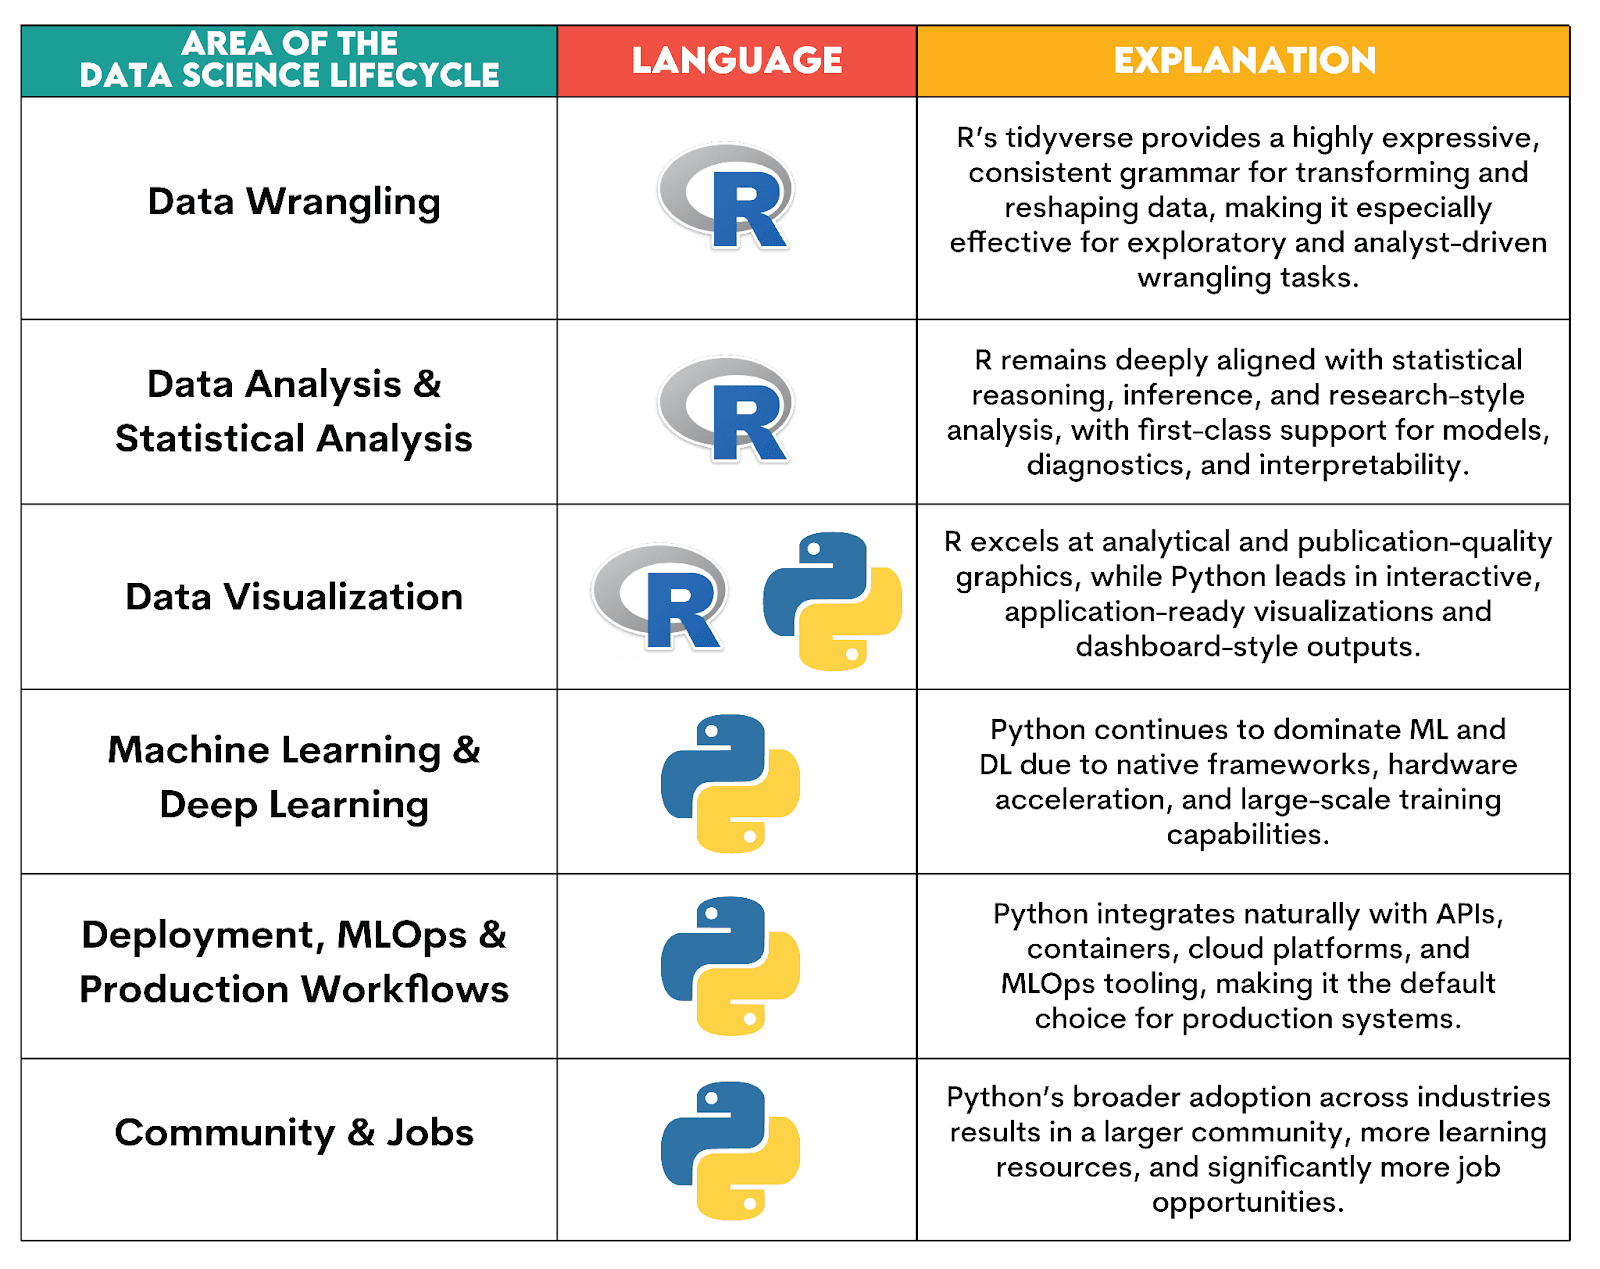
We’ve chosen these aspects because they reflect the end-to-end lifecycle of real data science work, from raw data to production systems, including job-market relevance.
Python vs R: Data Wrangling
Naturally, data scientists and analysts rely on data to perform their daily tasks. To do so, strategies need to be made to gather and store data. Many companies use in-house data storage with databases such as PostgreSQL, Microsoft SQL Server, or MySQL, or cloud-managed services.
Data may also be collected through APIs, logs, CSV/Parquet files, or web scraping.
All that data from different sources has to be cleaned, transformed, reshaped, and prepared for analysis. This is a process called data wrangling.
As data wrangling is core to data science and fundamental to both languages and a real differentiator (unlike data collection), we’ll focus on it for the language comparison.
What is Data Wrangling?
Data wrangling – also called data munging – refers to transforming raw, messy, and incomplete data into data suitable for analysis.
This is what the process typically involves.

Data Wrangling in Python
Python is generally preferred over R when the workflow goes beyond just analysis, for example, in production systems, data engineering tasks, automation, or machine learning pipelines.
Data wrangling revolves around these Python libraries.
Here are more details about each library.
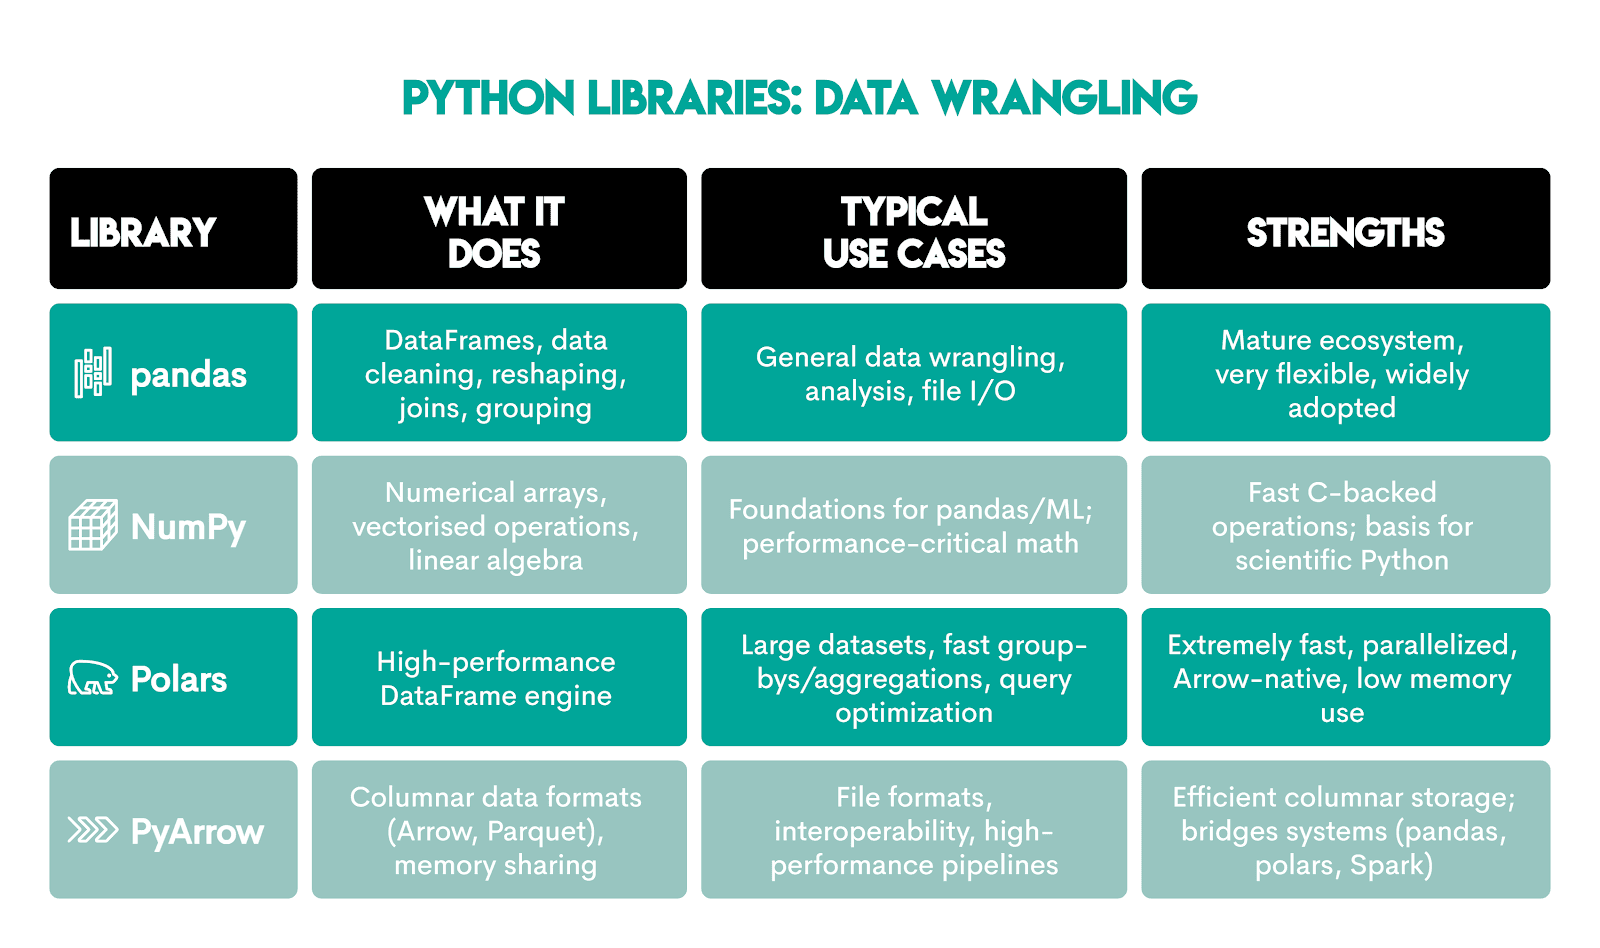
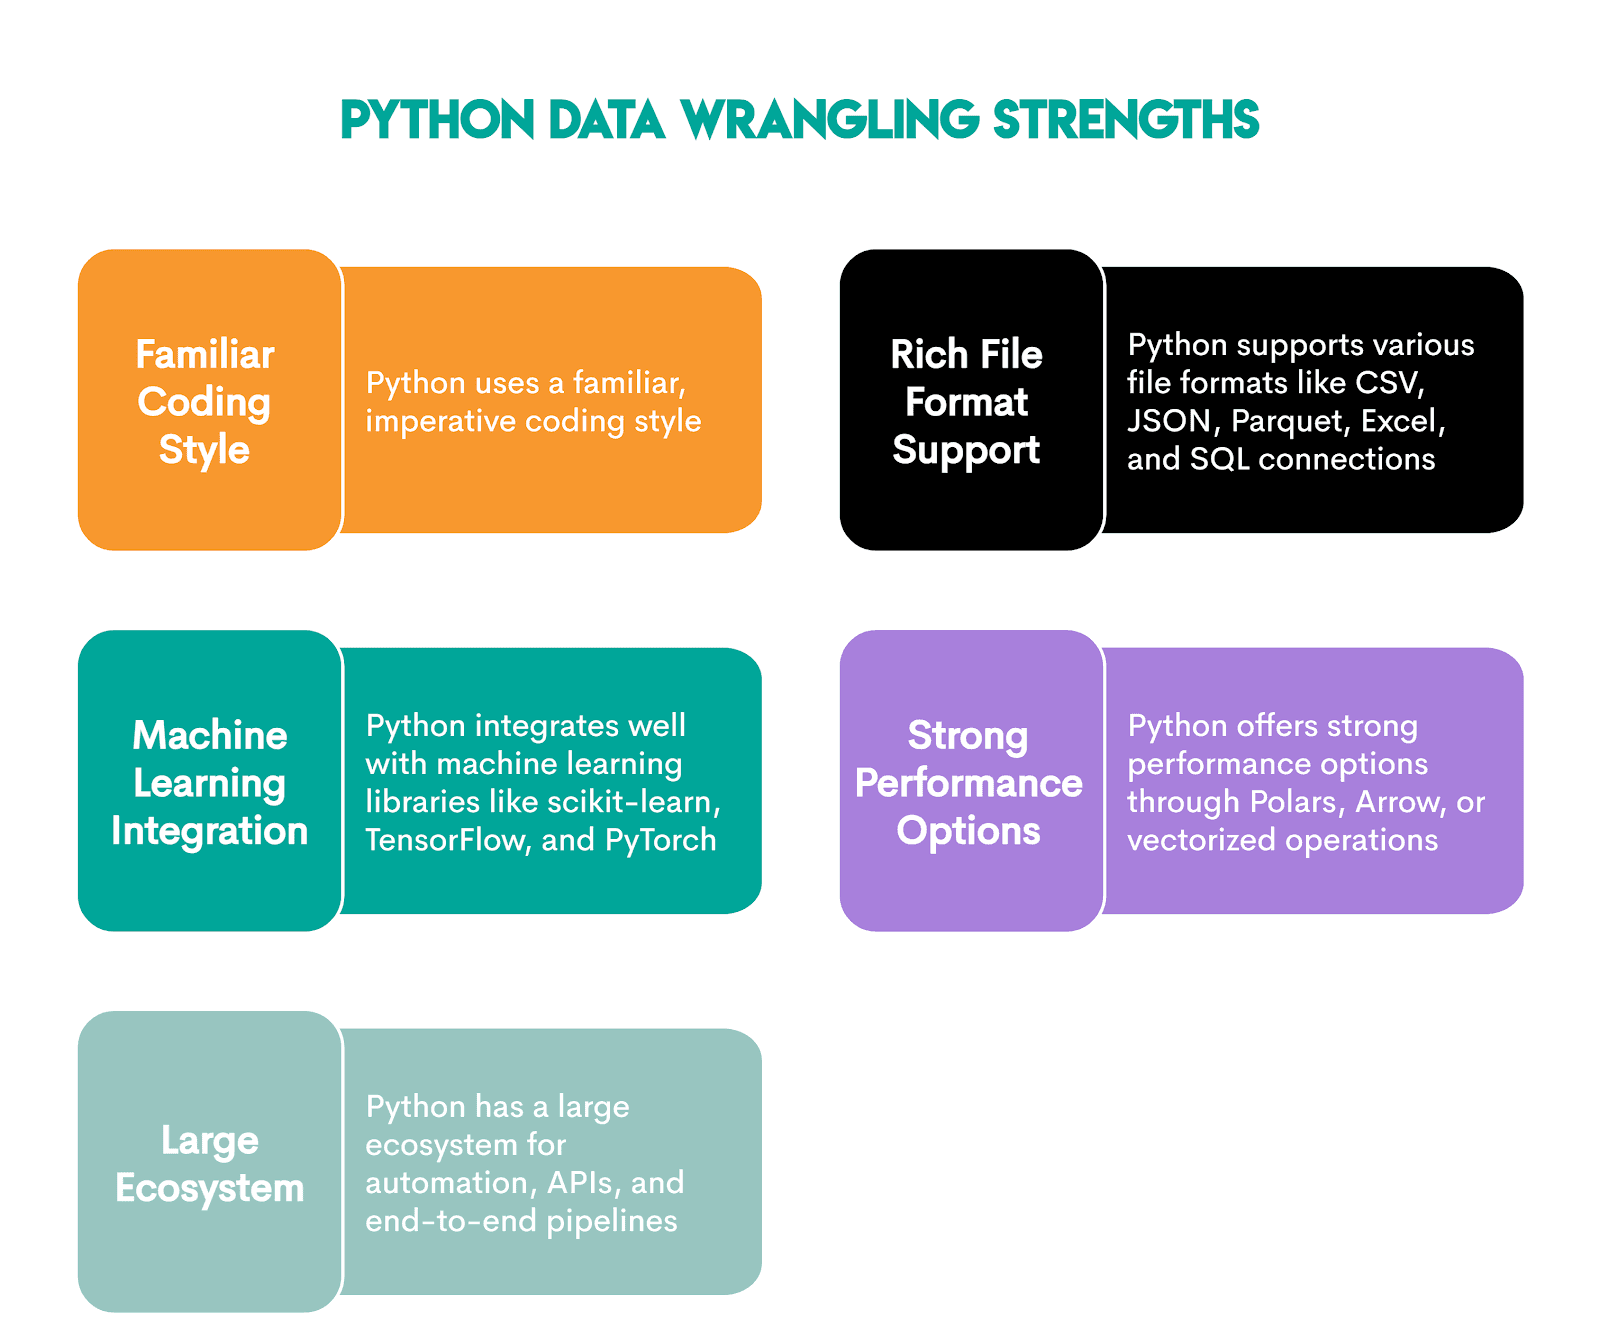
These libraries make Python a powerful data wrangling tool, with its strengths listed below.
Data Wrangling in R
R’s data wrangling capabilities are typically preferred in statistics-heavy fields, such as research, epidemiology, biostatistics, econometrics.
Data wrangling strengths come from the Tidyverse collection of R packages:
Here are more details about each package.
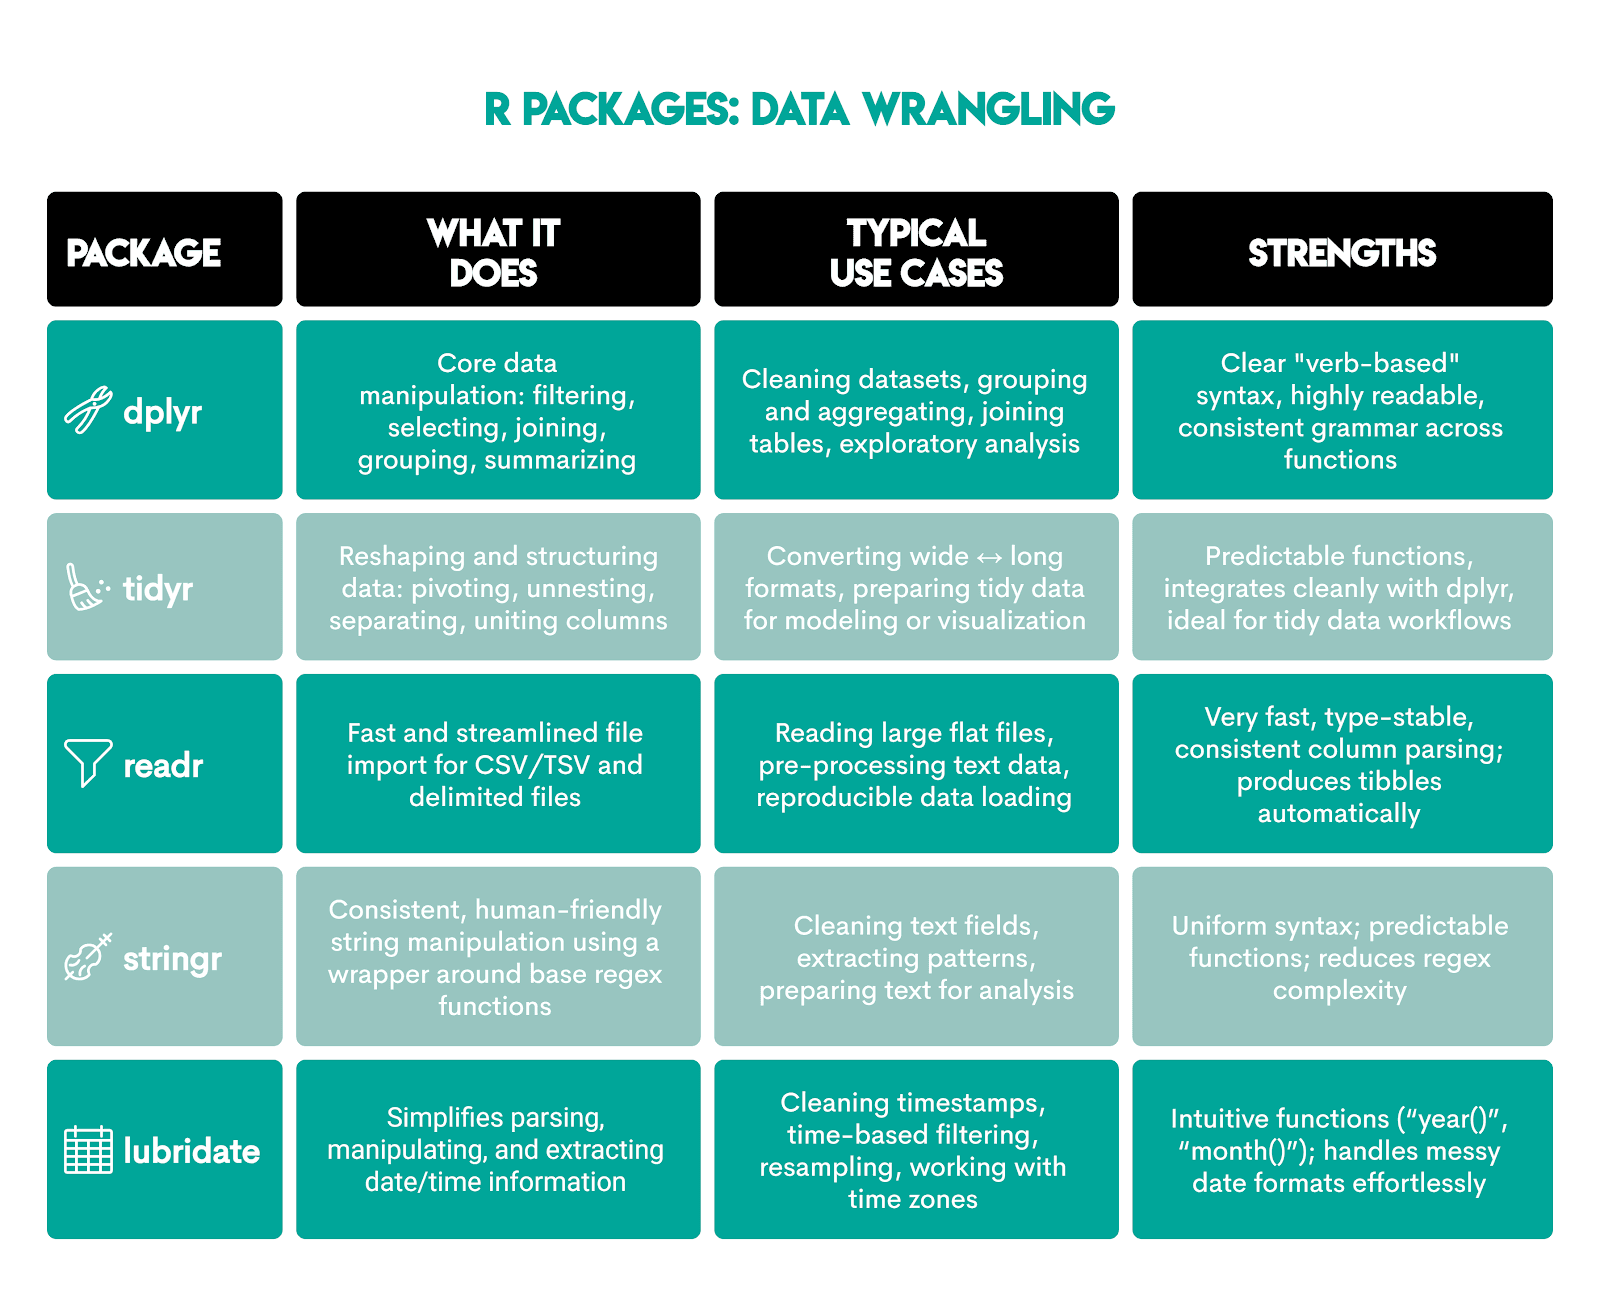
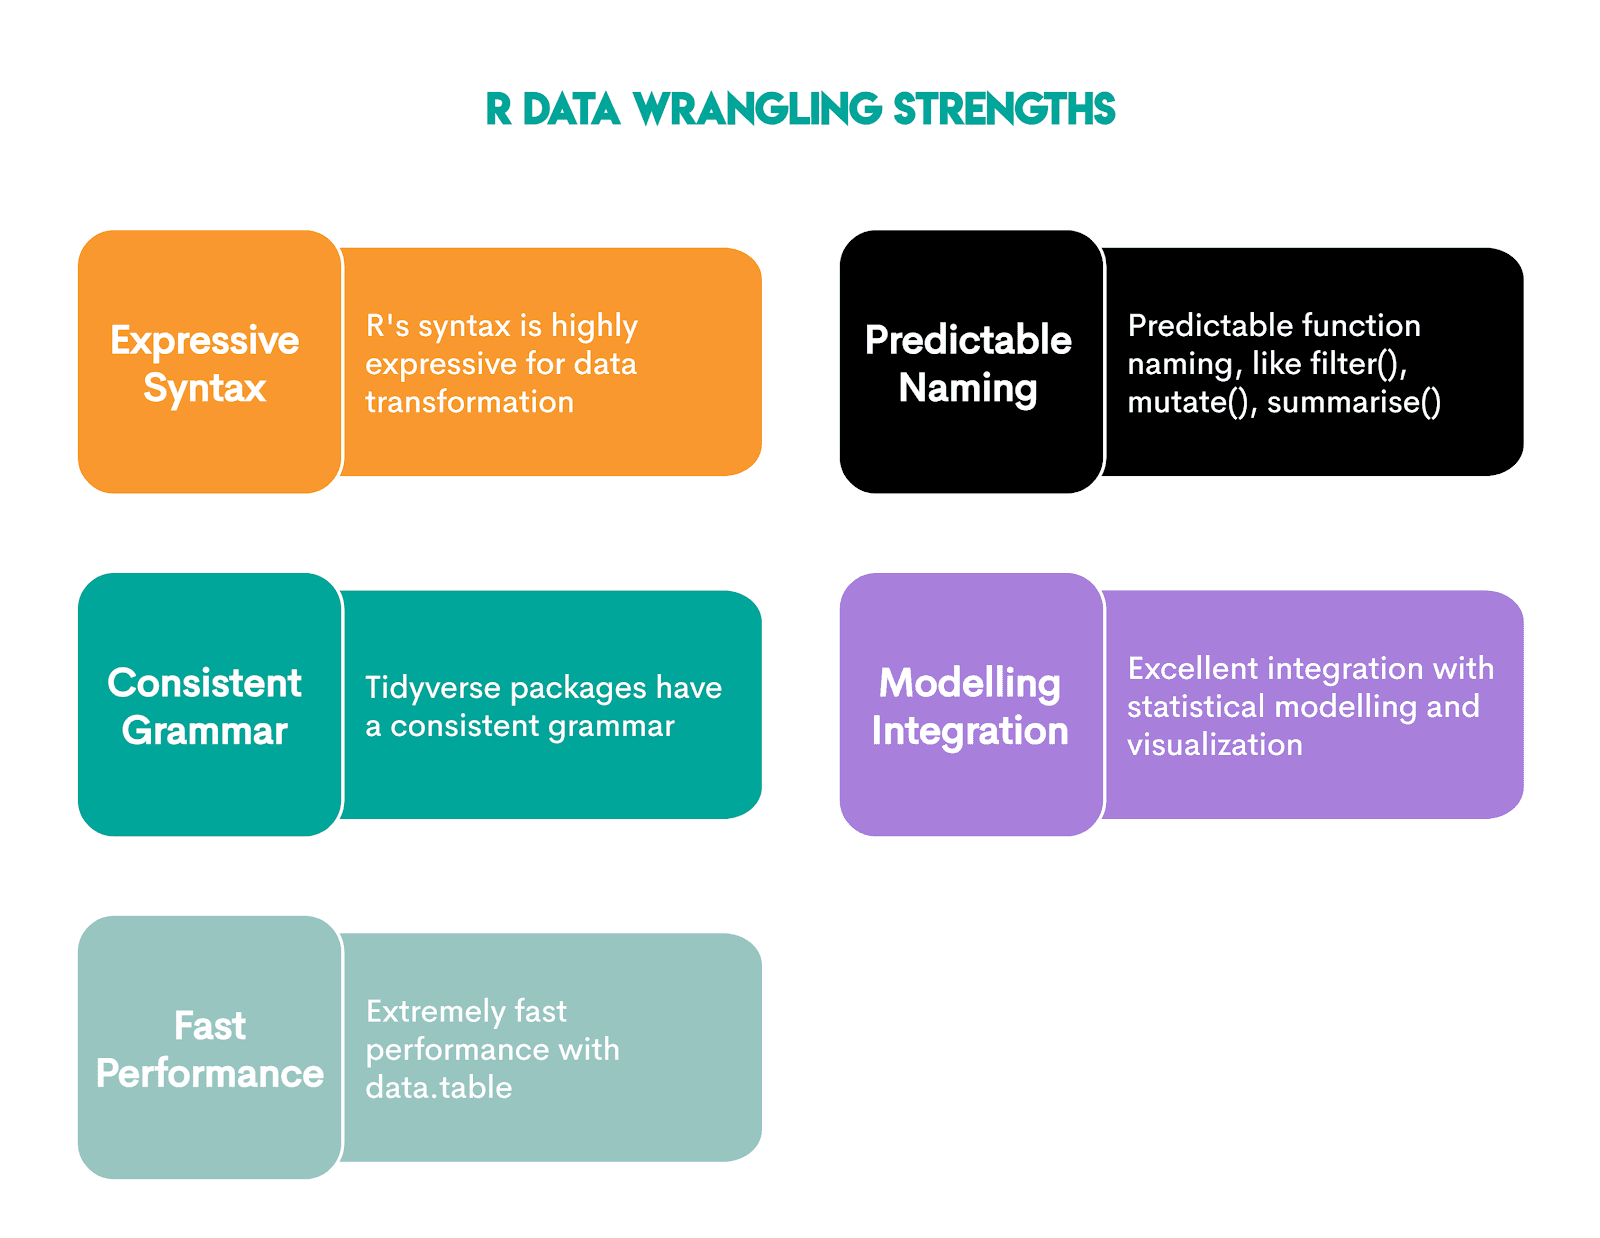
Wrangling in R has these advantages.
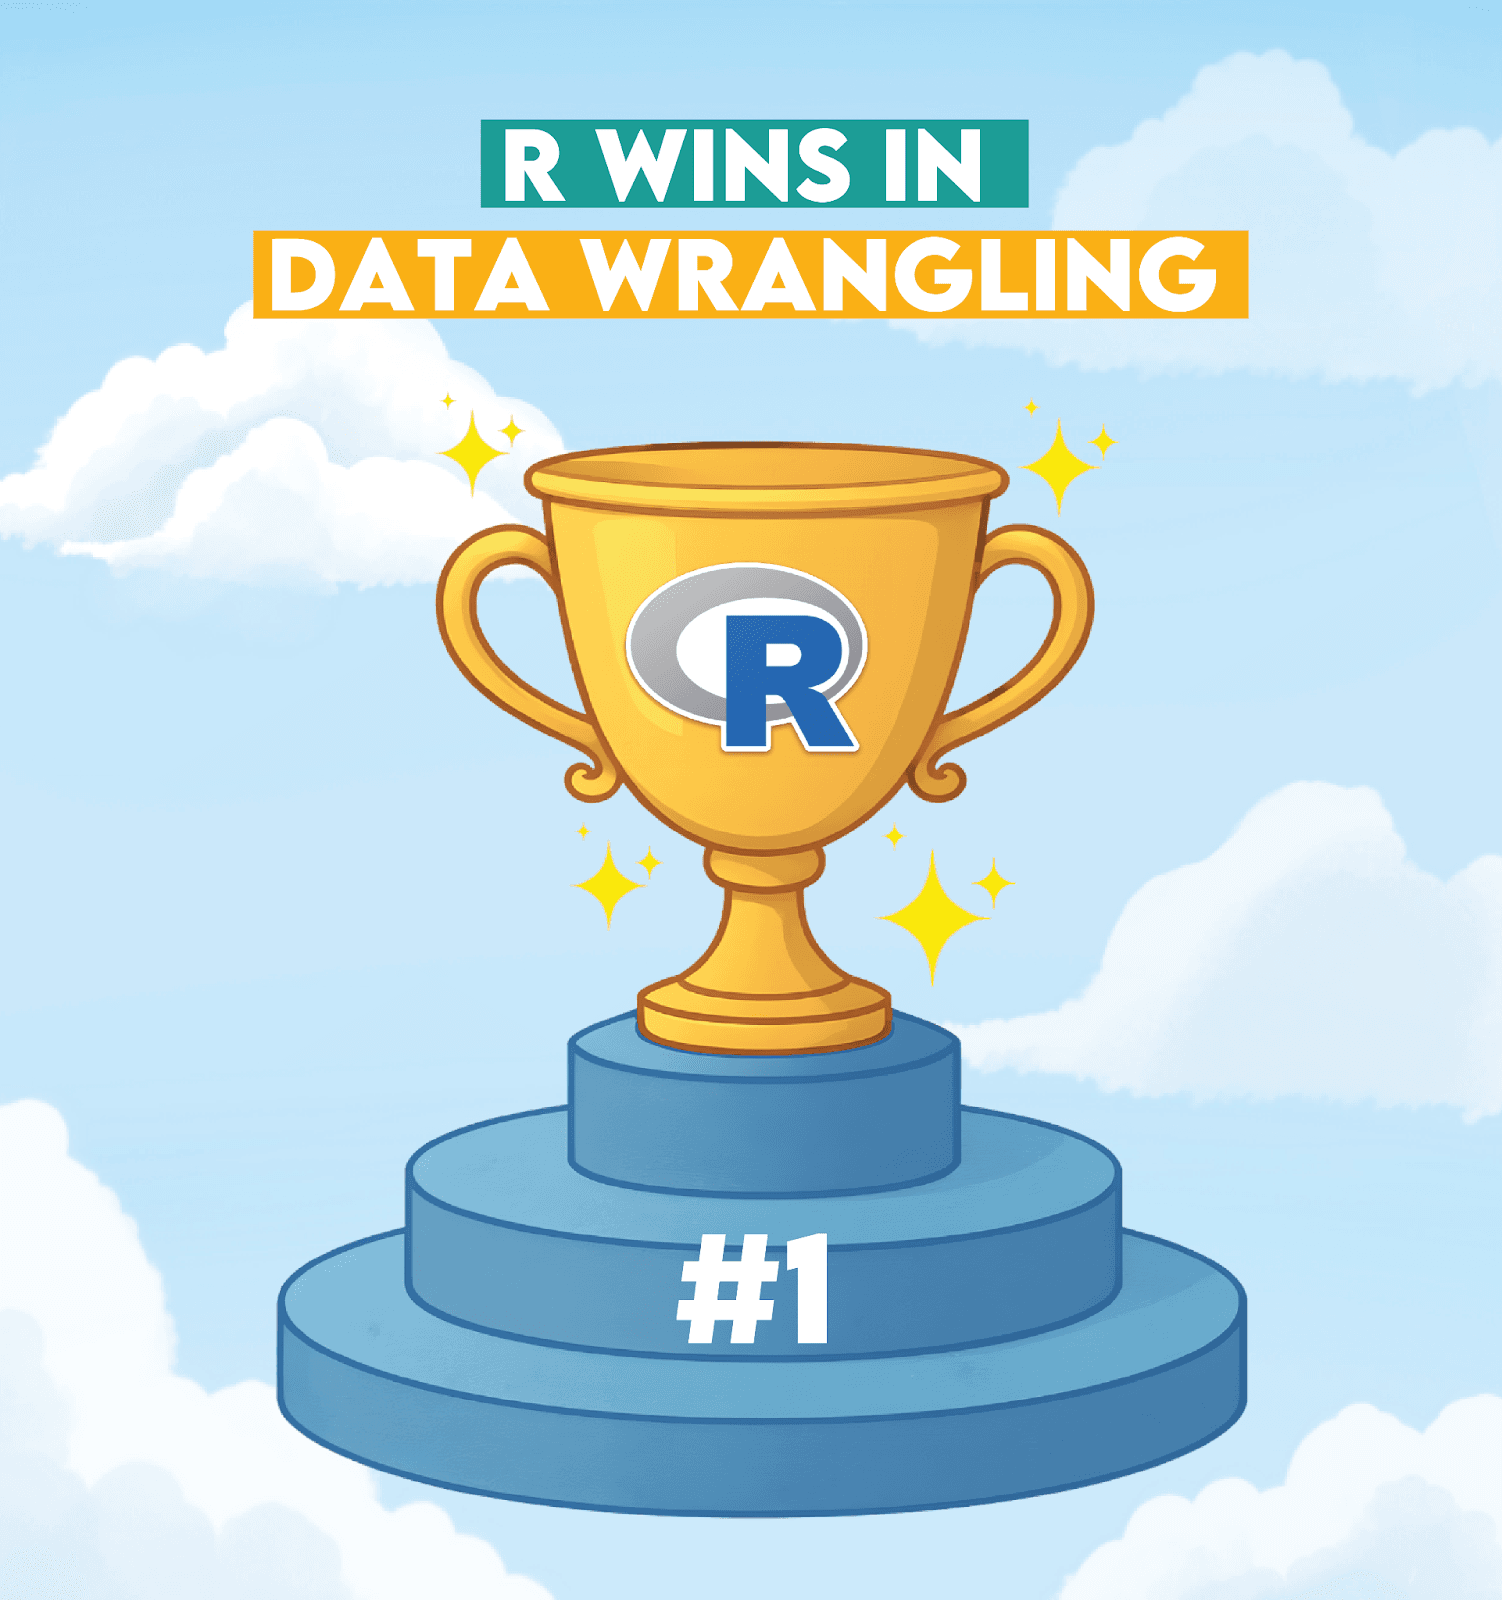
Which Language is Better for Data Wrangling?
Verdict explanation:
R is better for pure data wrangling due to its smoother and more expressive workflow provided by tidyverse.
Python also has powerful tools – pandas for data wrangling, Polars for high-performance workloads – but its syntax tends to be more verbose in data wrangling tasks. It’s more appreciated for the subsequent steps, e.g., machine learning or automation.
Here are additional details supporting the verdict.

Python vs R: Data Analysis & Statistical Analysis
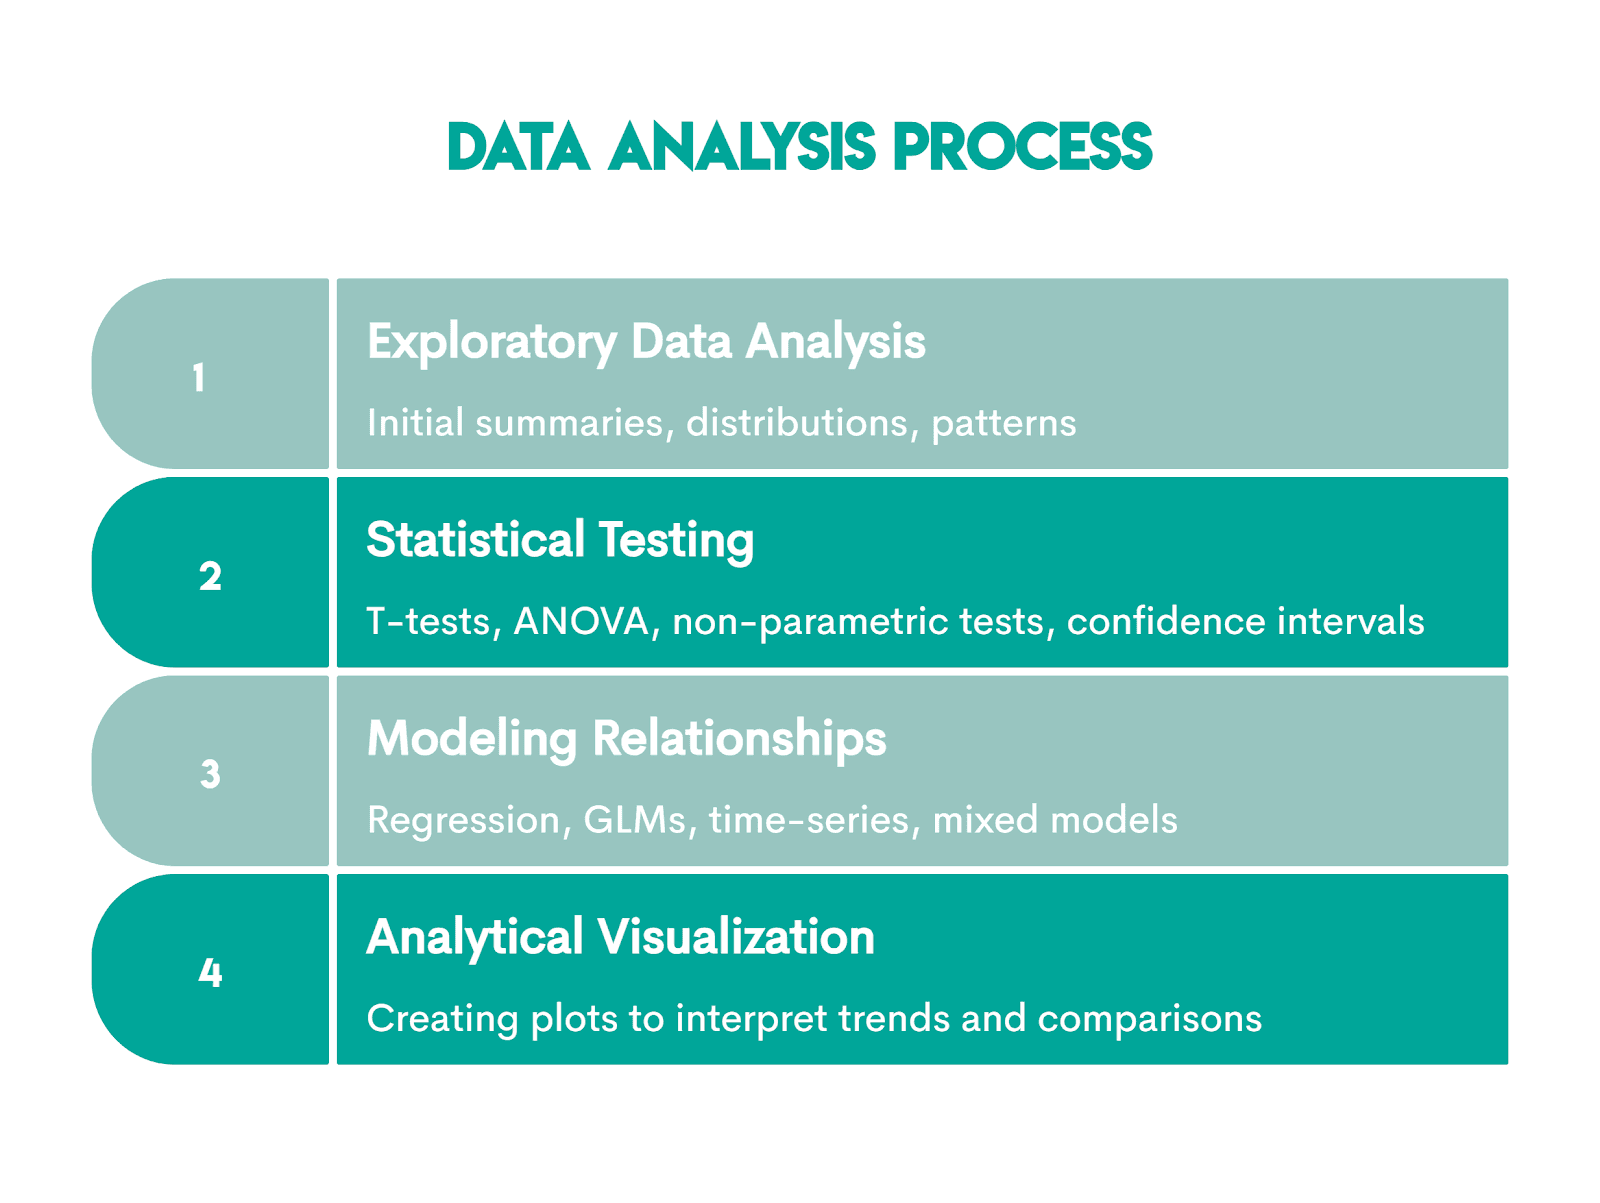
After the data has been cleaned and transformed, it’s now ready to be used in analysis. This typically involves the following steps.
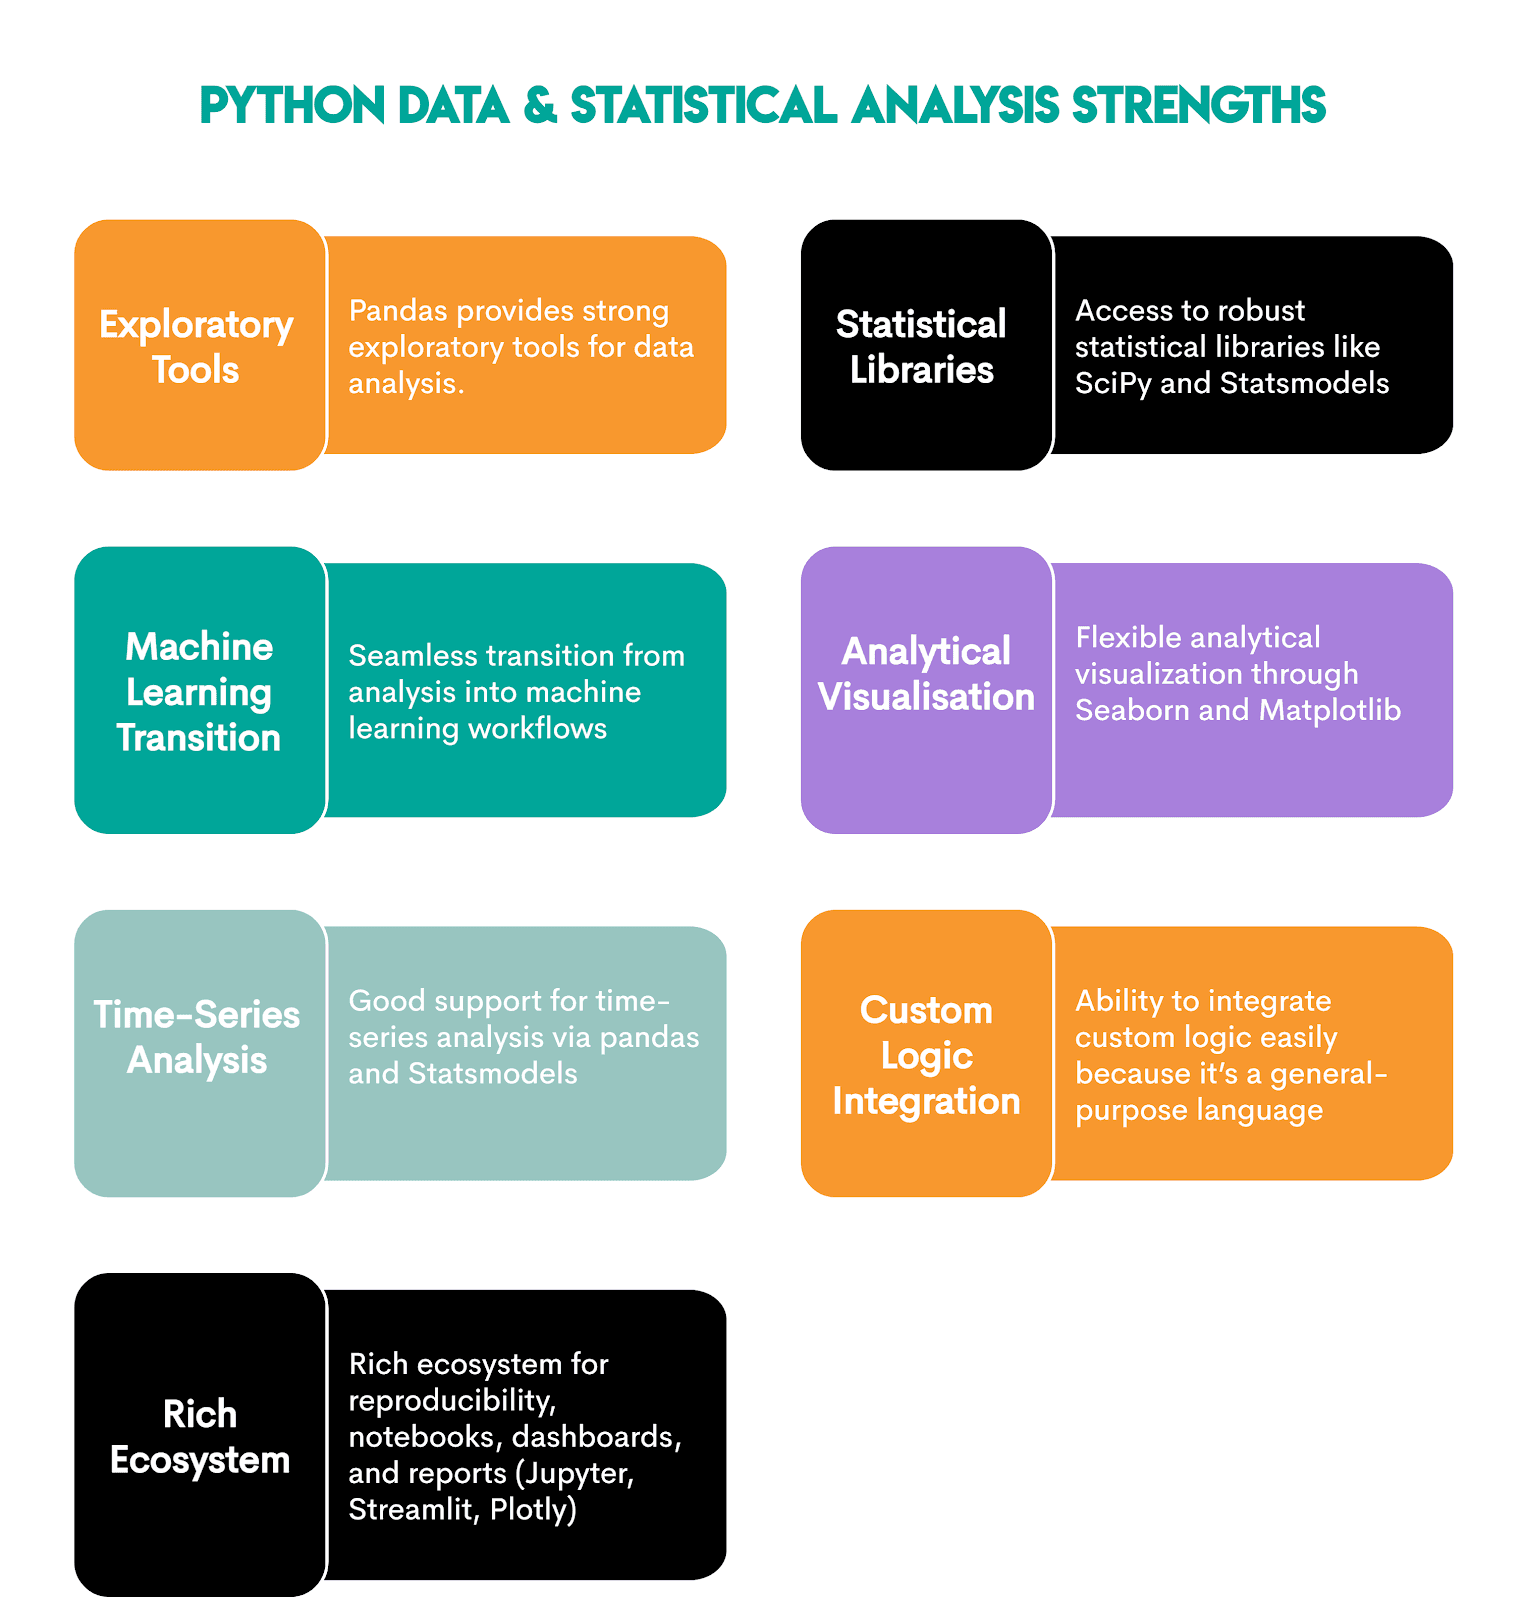
Data Analysis & Statistical Analysis in Python
Python is designed only for this purpose, so it approaches data analysis from a general-purpose programming perspective.
The libraries it offers are powerful, but can seem a bit less cohesive than R’s packages. Here they are:
Here’s an overview of libraries’ characteristics and use cases.

These libraries significantly improve Python’s capabilities in data and statistical analysis.
Data Analysis & Statistical Analysis in R
When it comes to R, it was designed for statistics and analytical workflows. No surprise that remains its core strength.
This is helped with the following packages.
Here are more details about each package.

So many comprehensive packages make R even better for analysis, with these strengths.

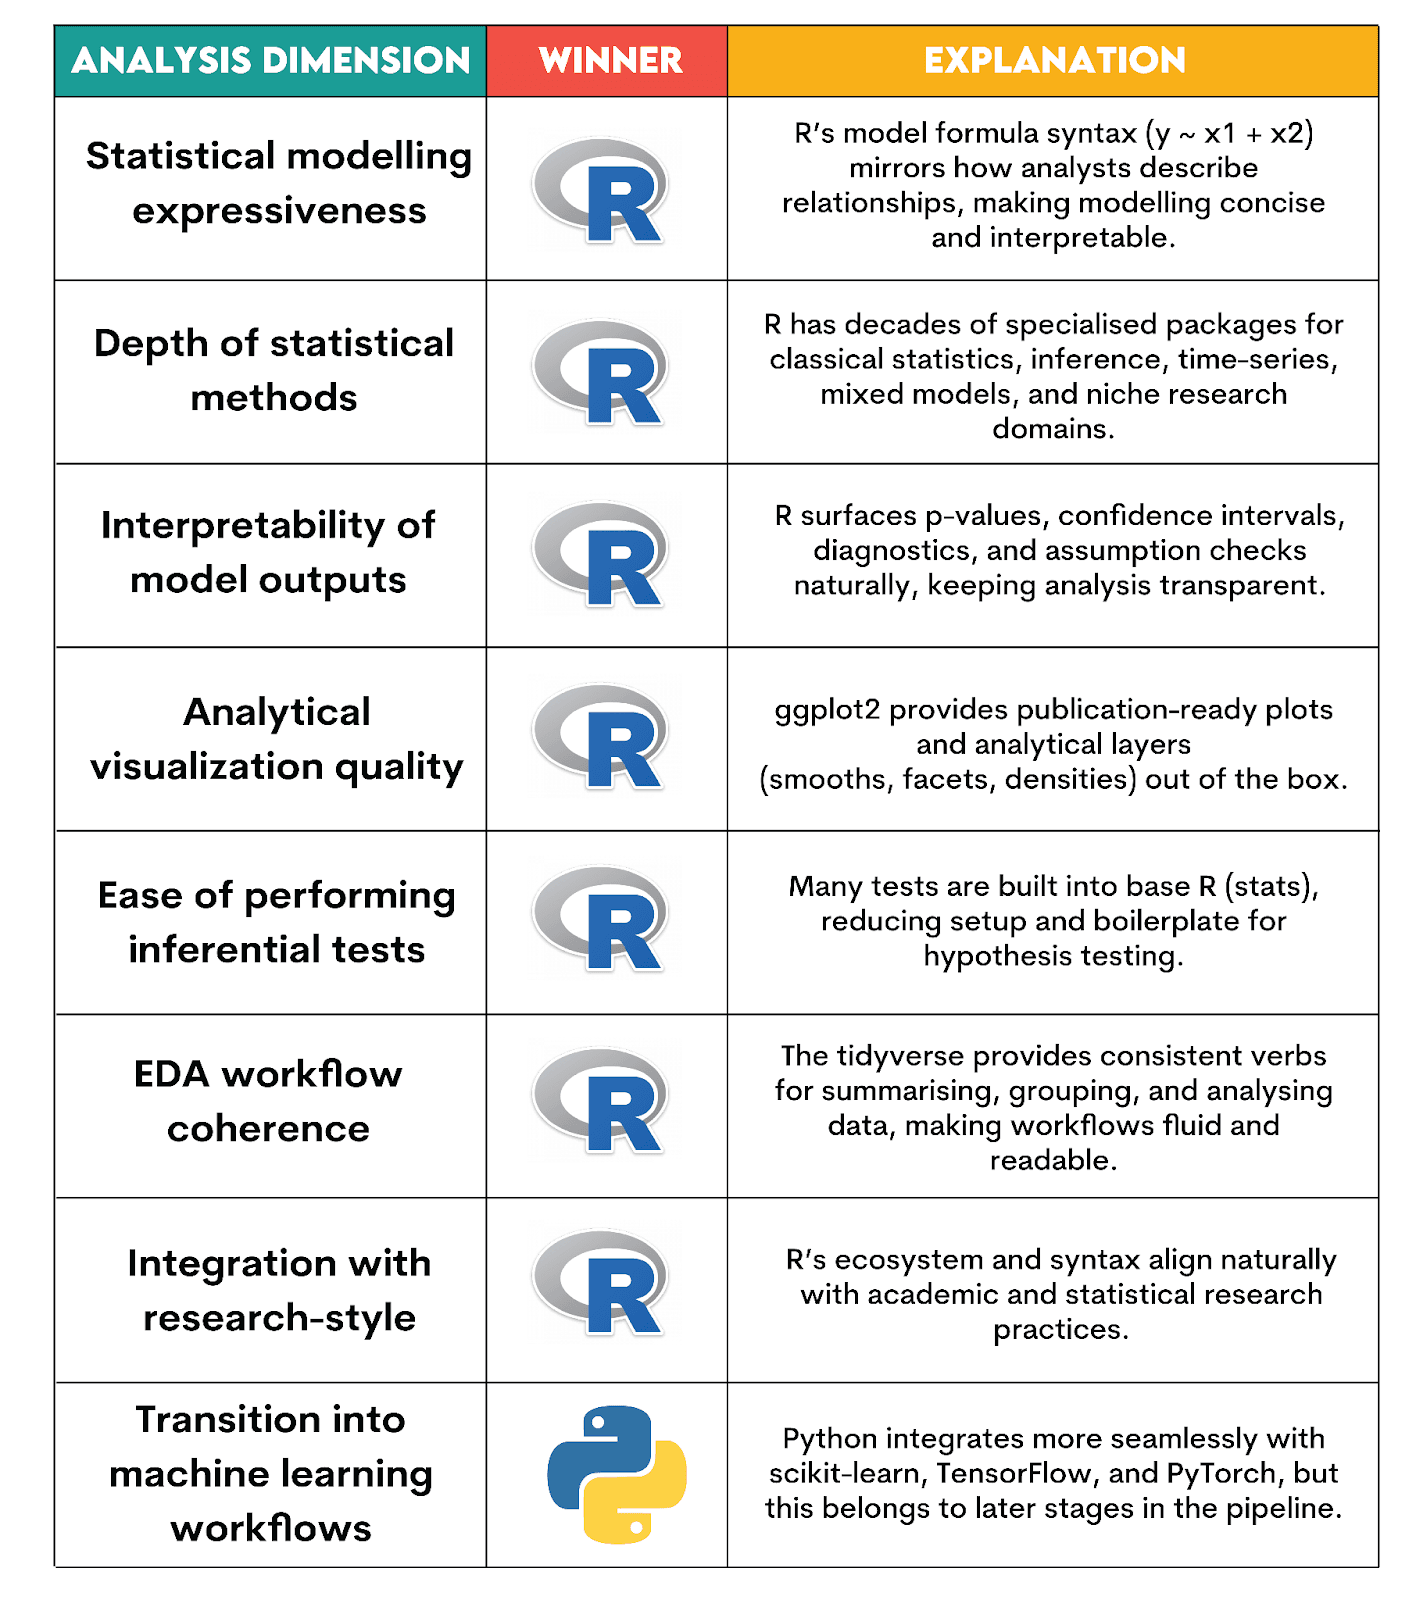
Which Language is Better for Data & Statistical Analysis?
Verdict explanation:
R is better for analysis. Not surprisingly, since it was built specifically for statistical reasoning. It should be your go-to tool if you’re focusing on statistical analysis or research-style modeling.
Python is not bad, either, and far from it. However, it’s not as naturally aligned with statistical workflows as R.
Here’s what informed our verdict.
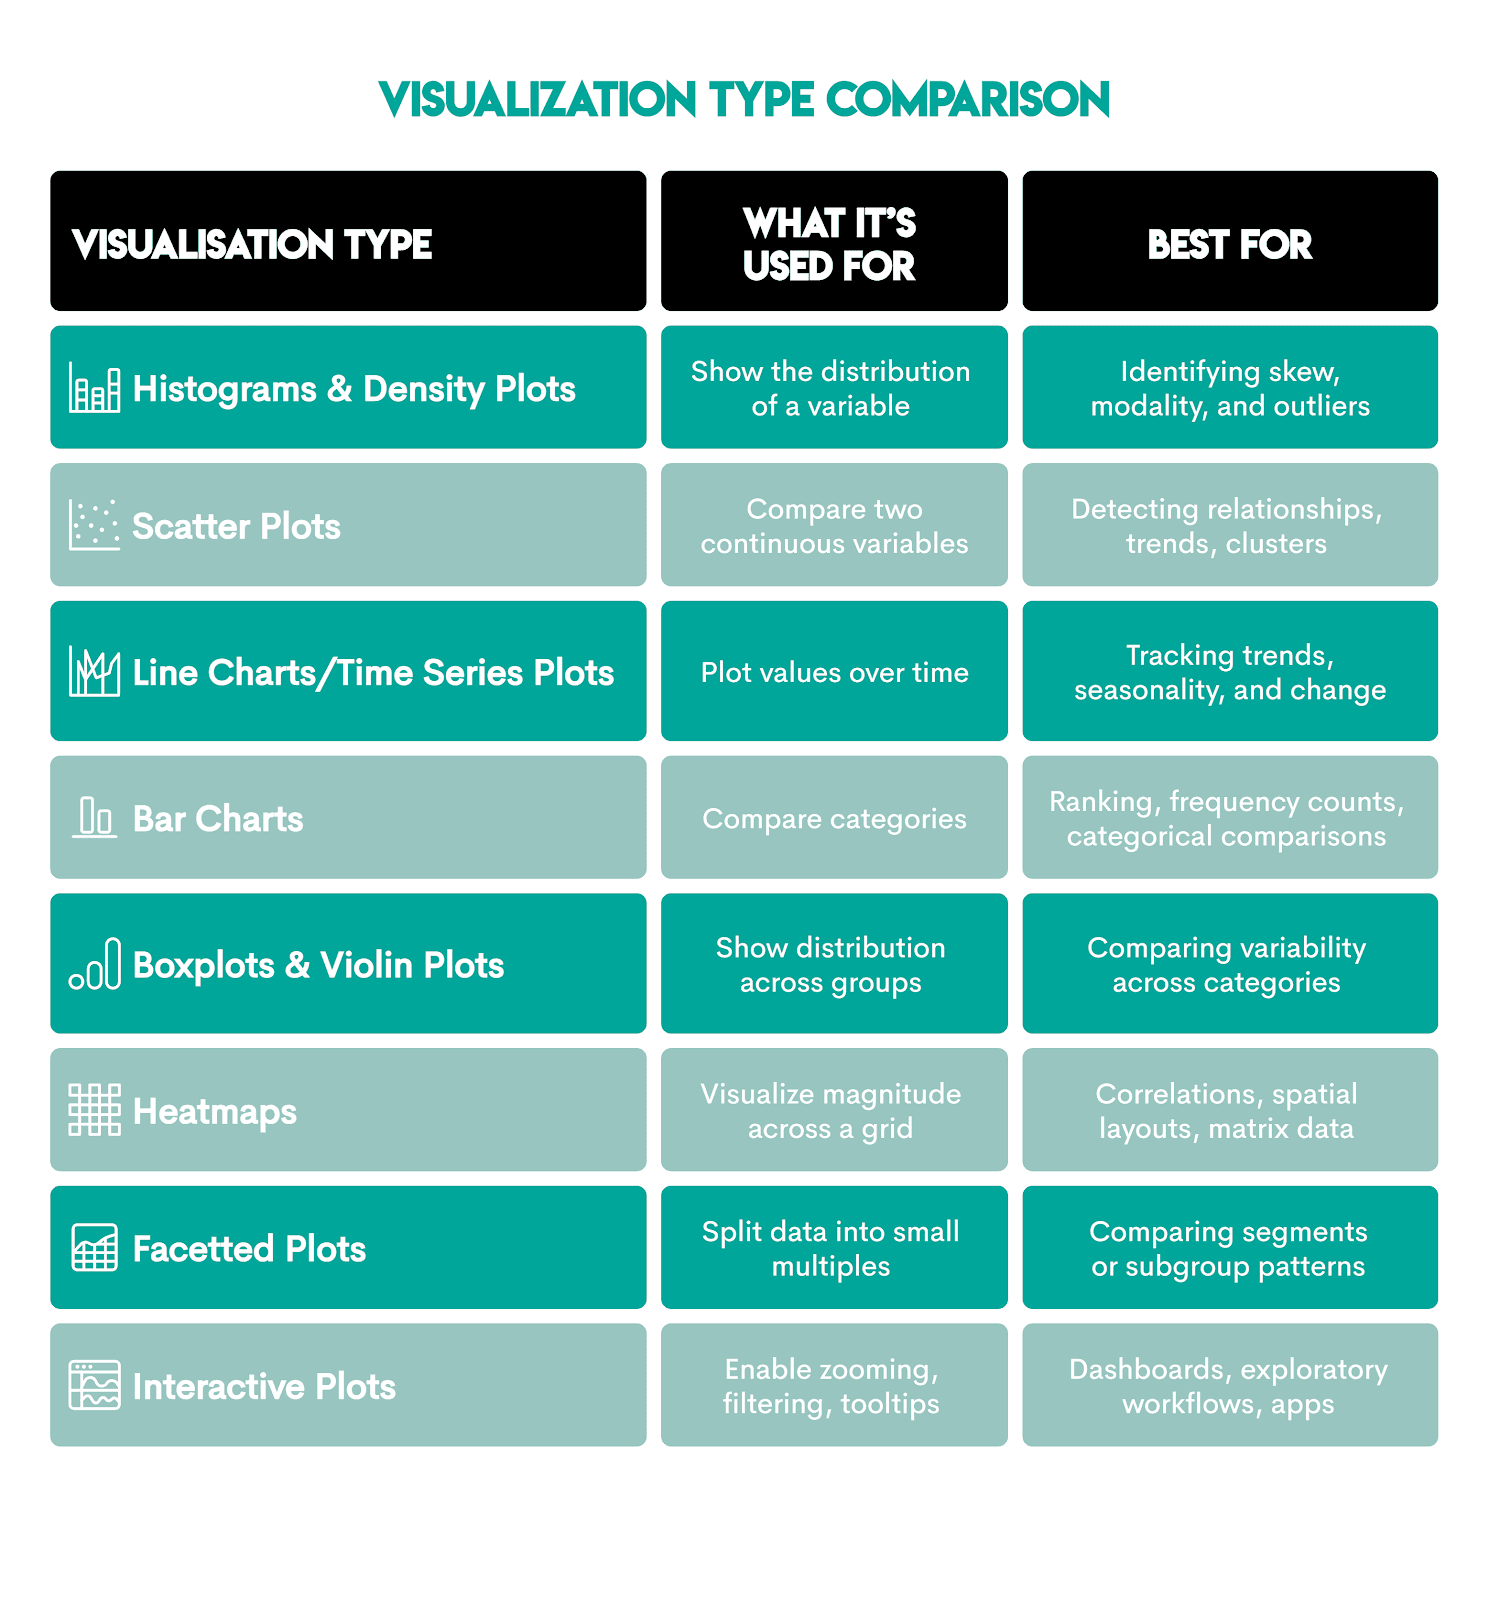
Python vs R: Data Visualization
Data visualization is the graphical representation of data. Modeling and data visualization allow data scientists and analysts to use large datasets to render graphs and images. Physical representation of data allows entities to track progress, make decisions, display predictions, etc., for their given metrics.
Common visualizations include these.
Data Visualization in Python
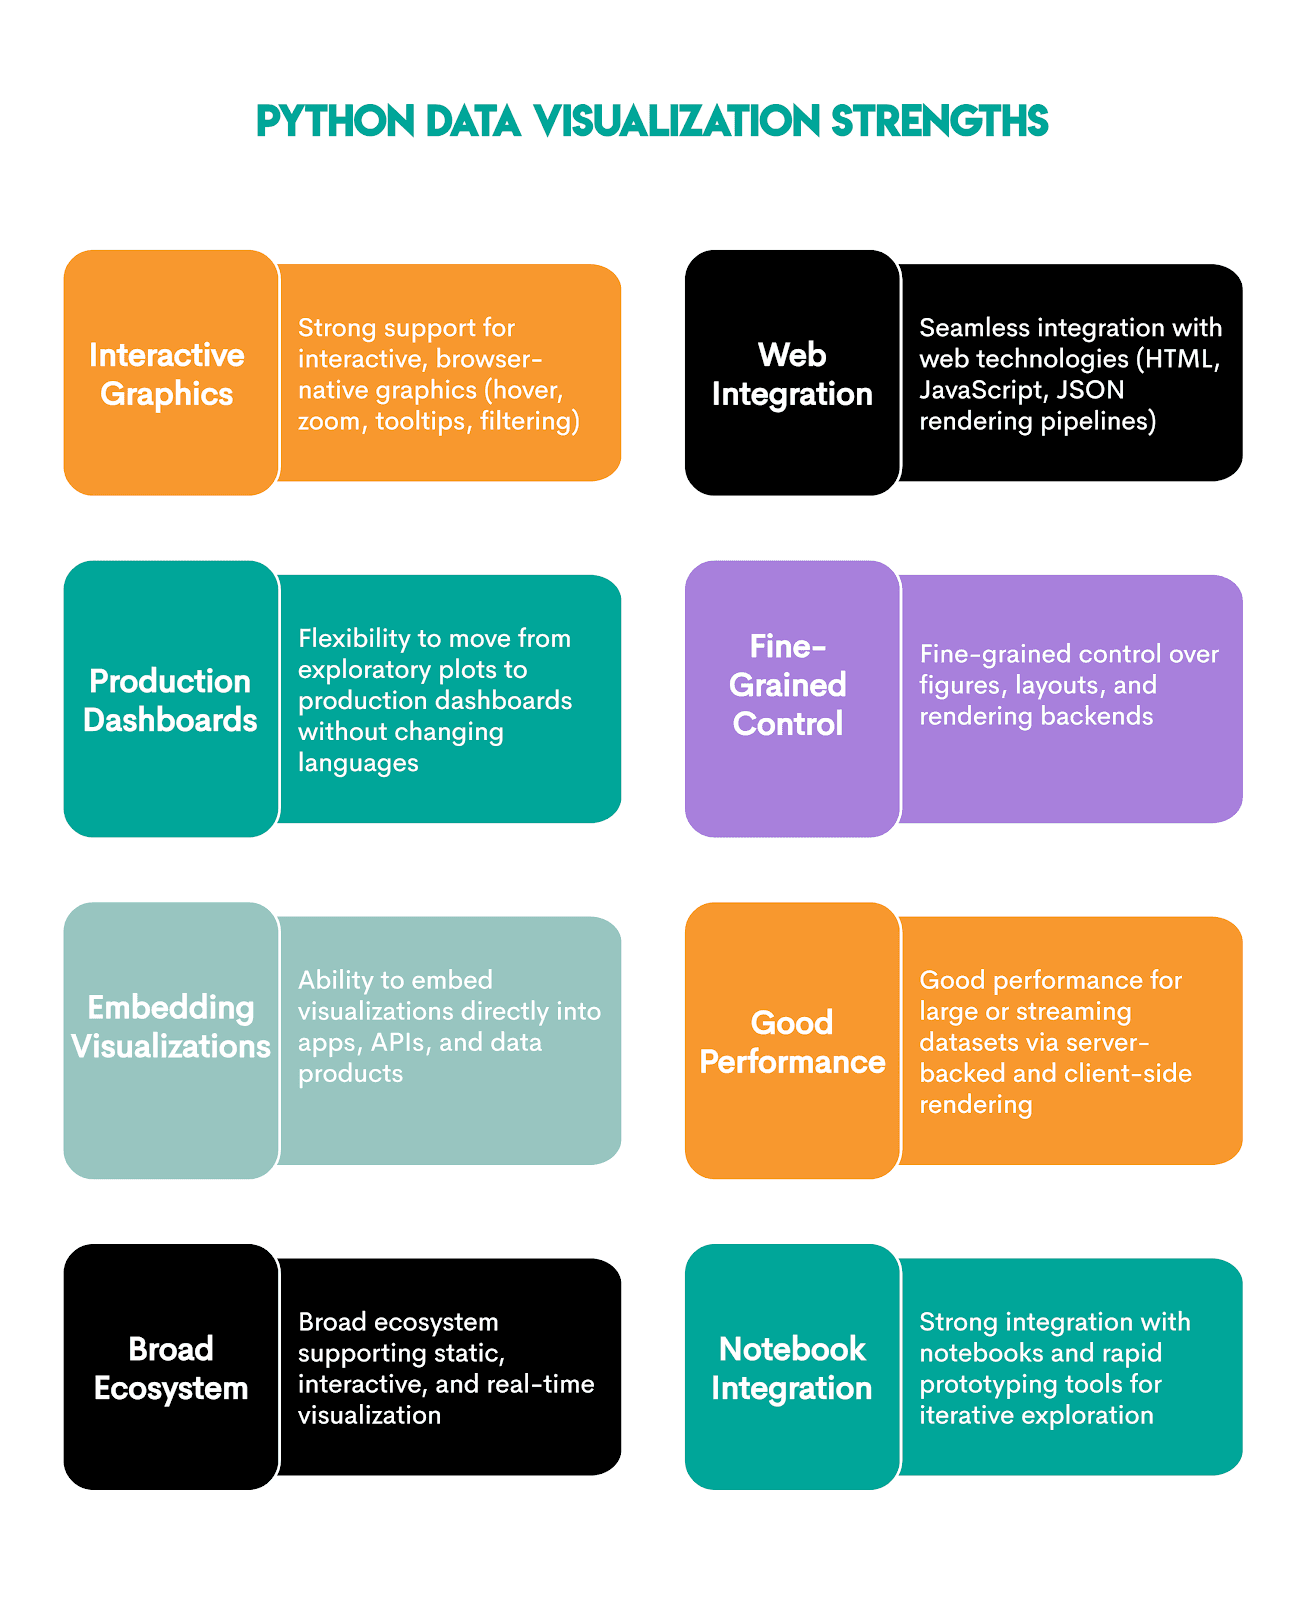
Python's visualization libraries are very diverse, allowing you to create virtually any visualization, from static plots to fully interactive, browser-based graphics. Many libraries integrate well with web technologies, so the visualizations can be easily fitted into data products, dashboards, and applications.
Here are the best and most popular libraries, with an overview.

With these libraries, Python really becomes a potent tool for making visualizations. Here are its advantages.
Data Visualization in R
The Grammar of Graphics is what makes R strong in data visualization. It makes a clear separation between data, aesthetics, and geometric layers. This makes it easier to understand what a plot is showing and why.
It makes R well-suited to EDA, statistical reporting, and research-grade visual communication.
These packages enhance R’s data visualization capabilities.
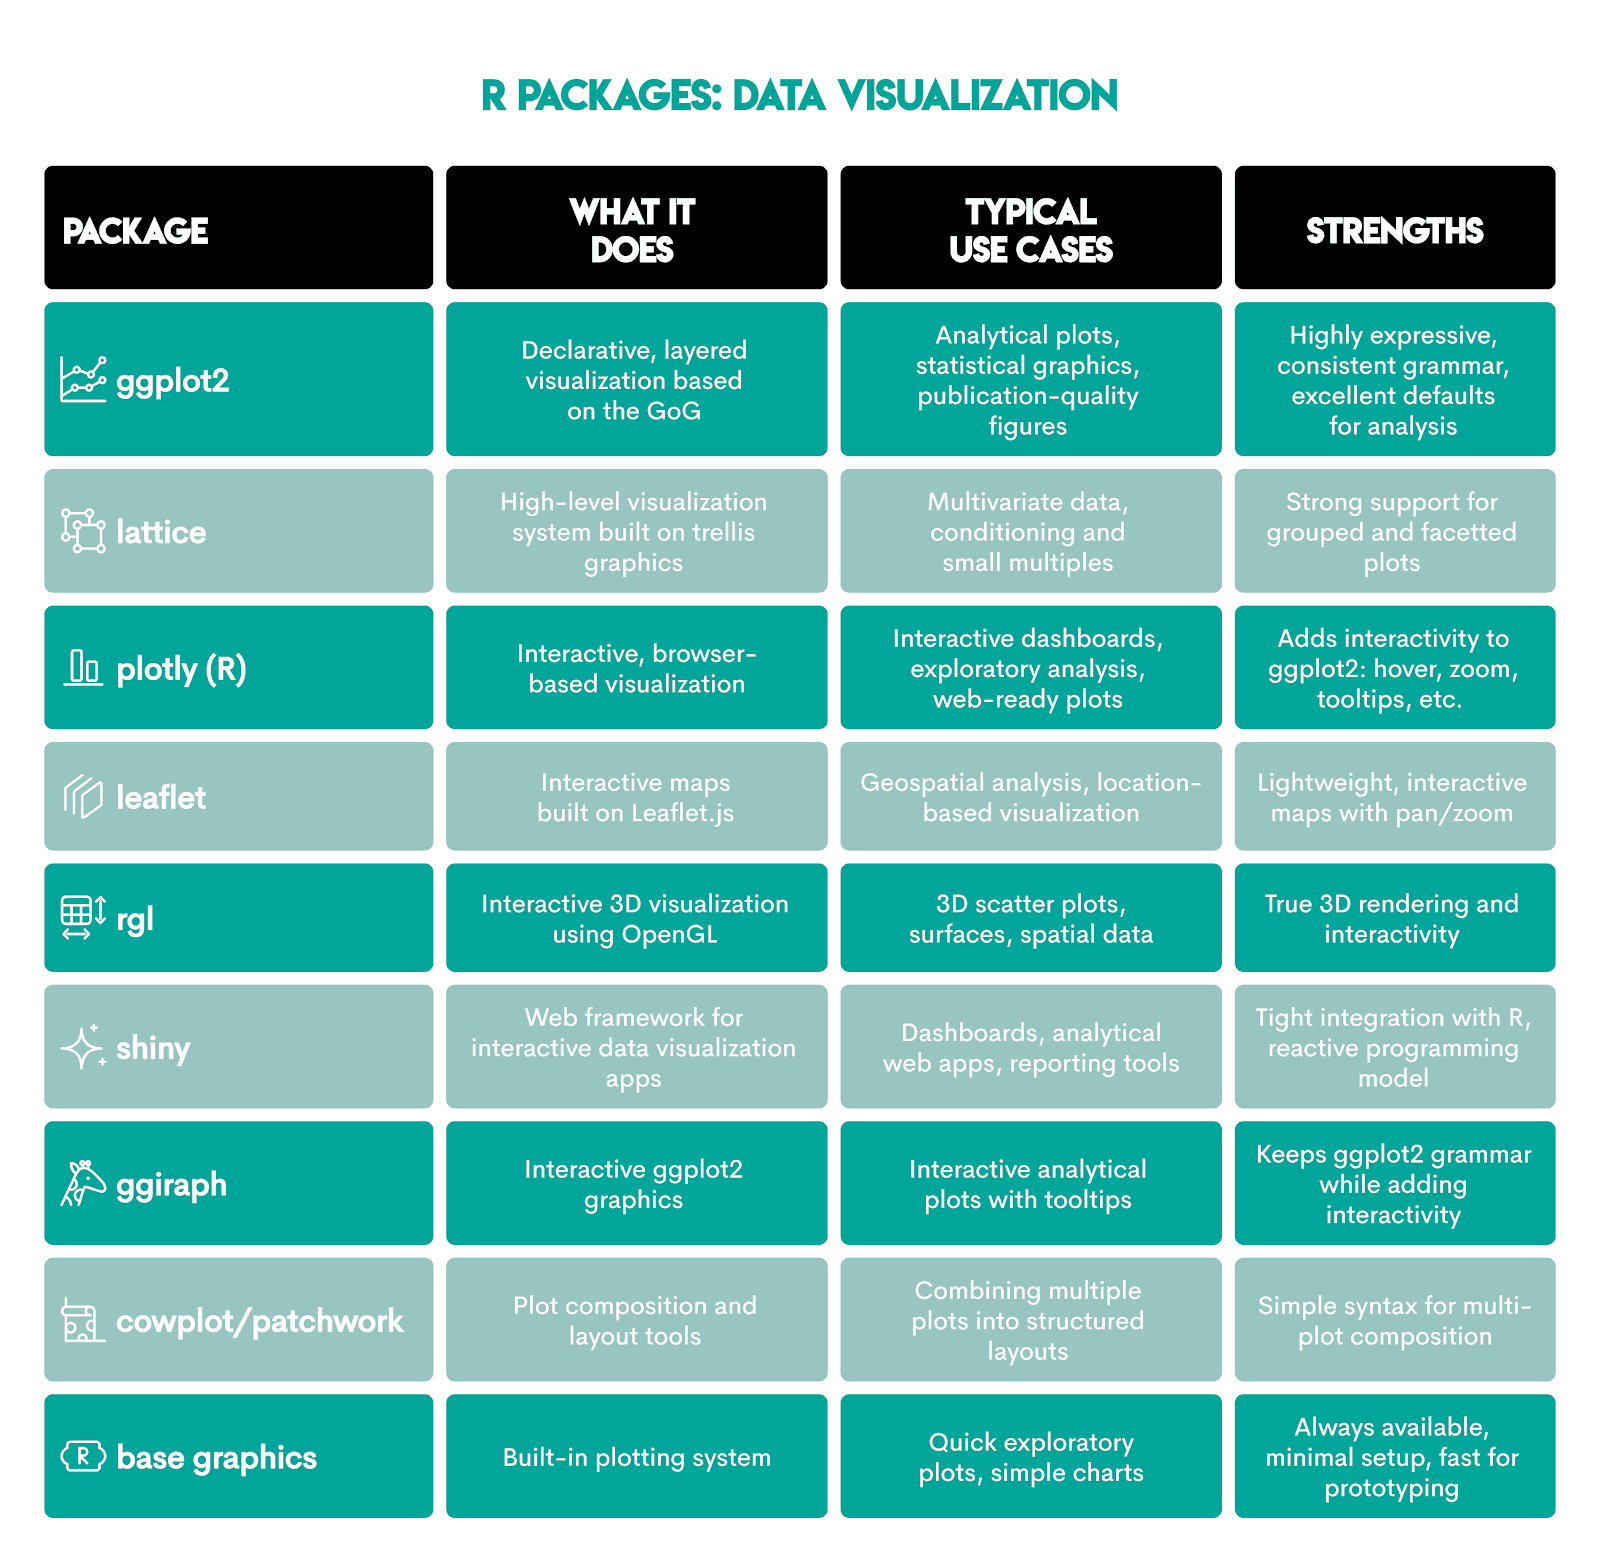
All in all, this is what makes R a good choice for data visualization.

Which Language is Better for Data Visualization?
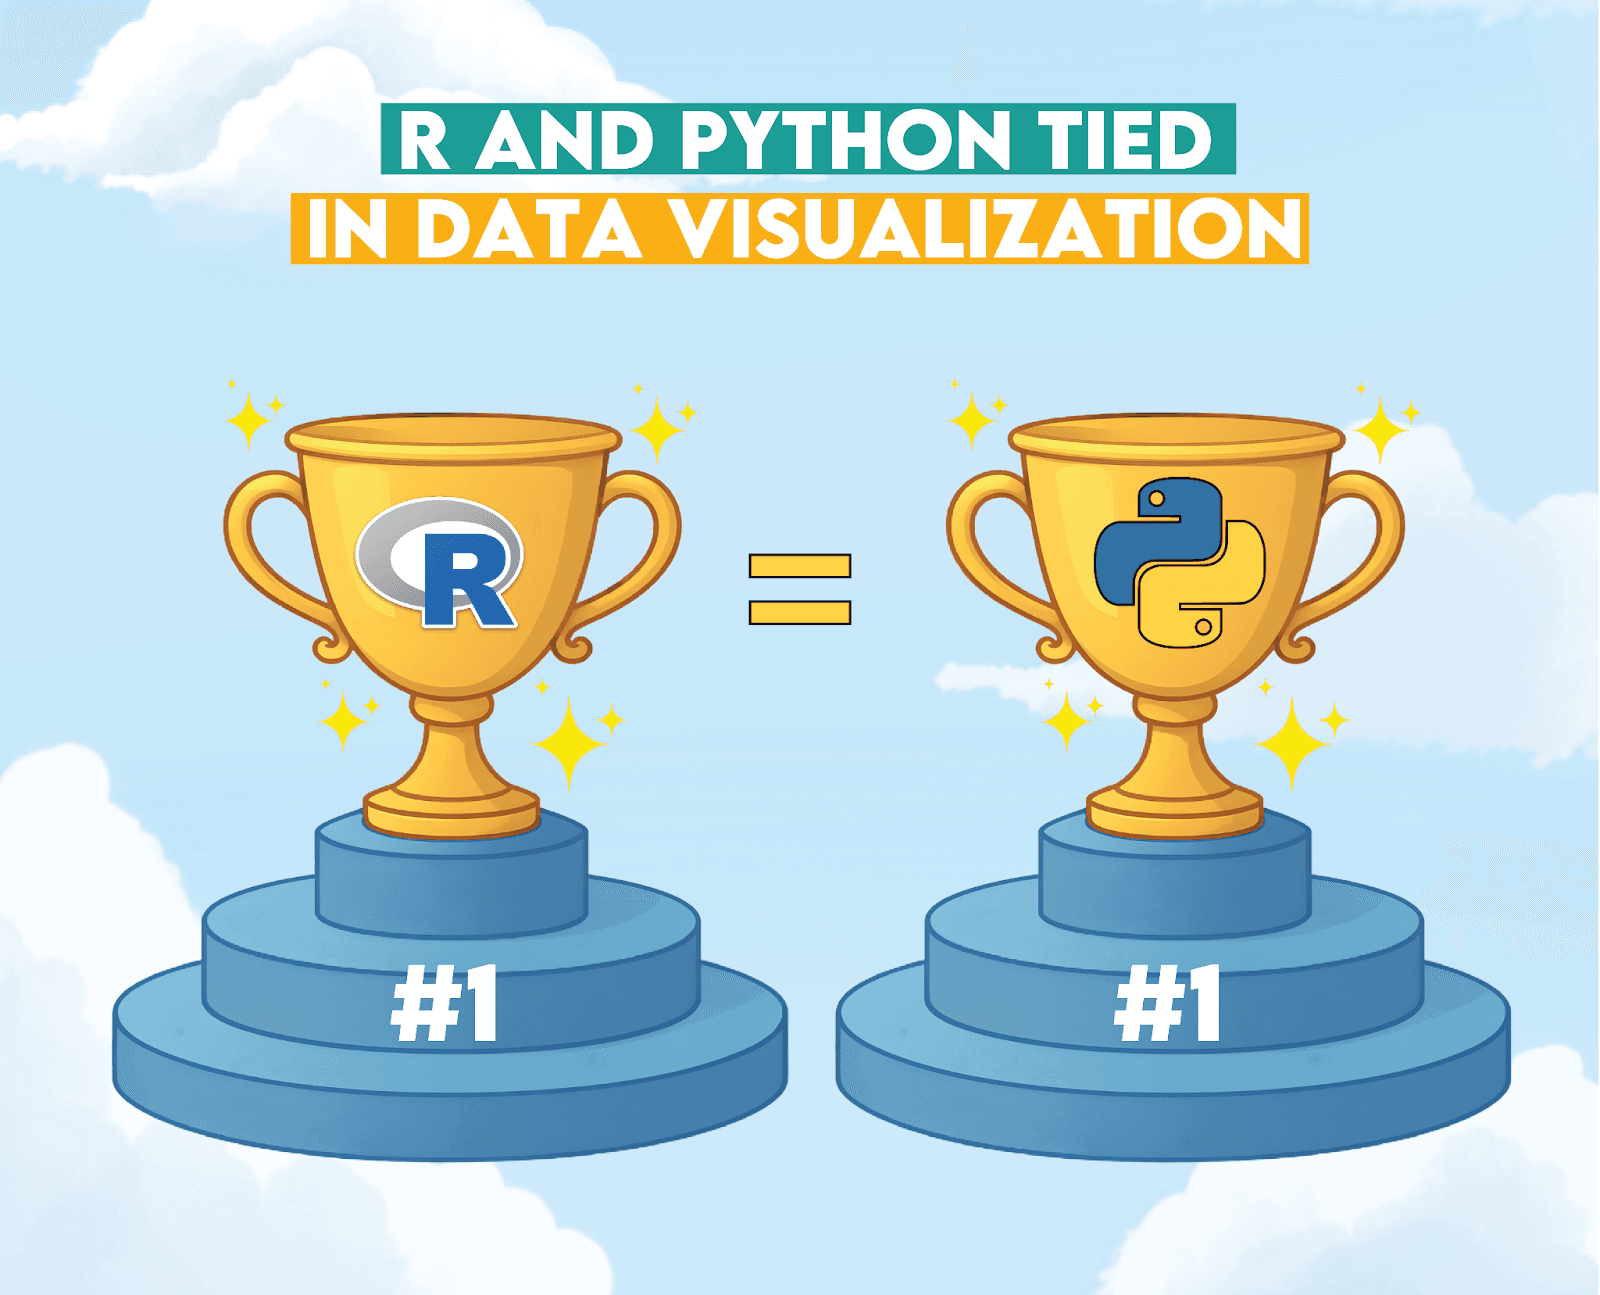
Verdict explanation:
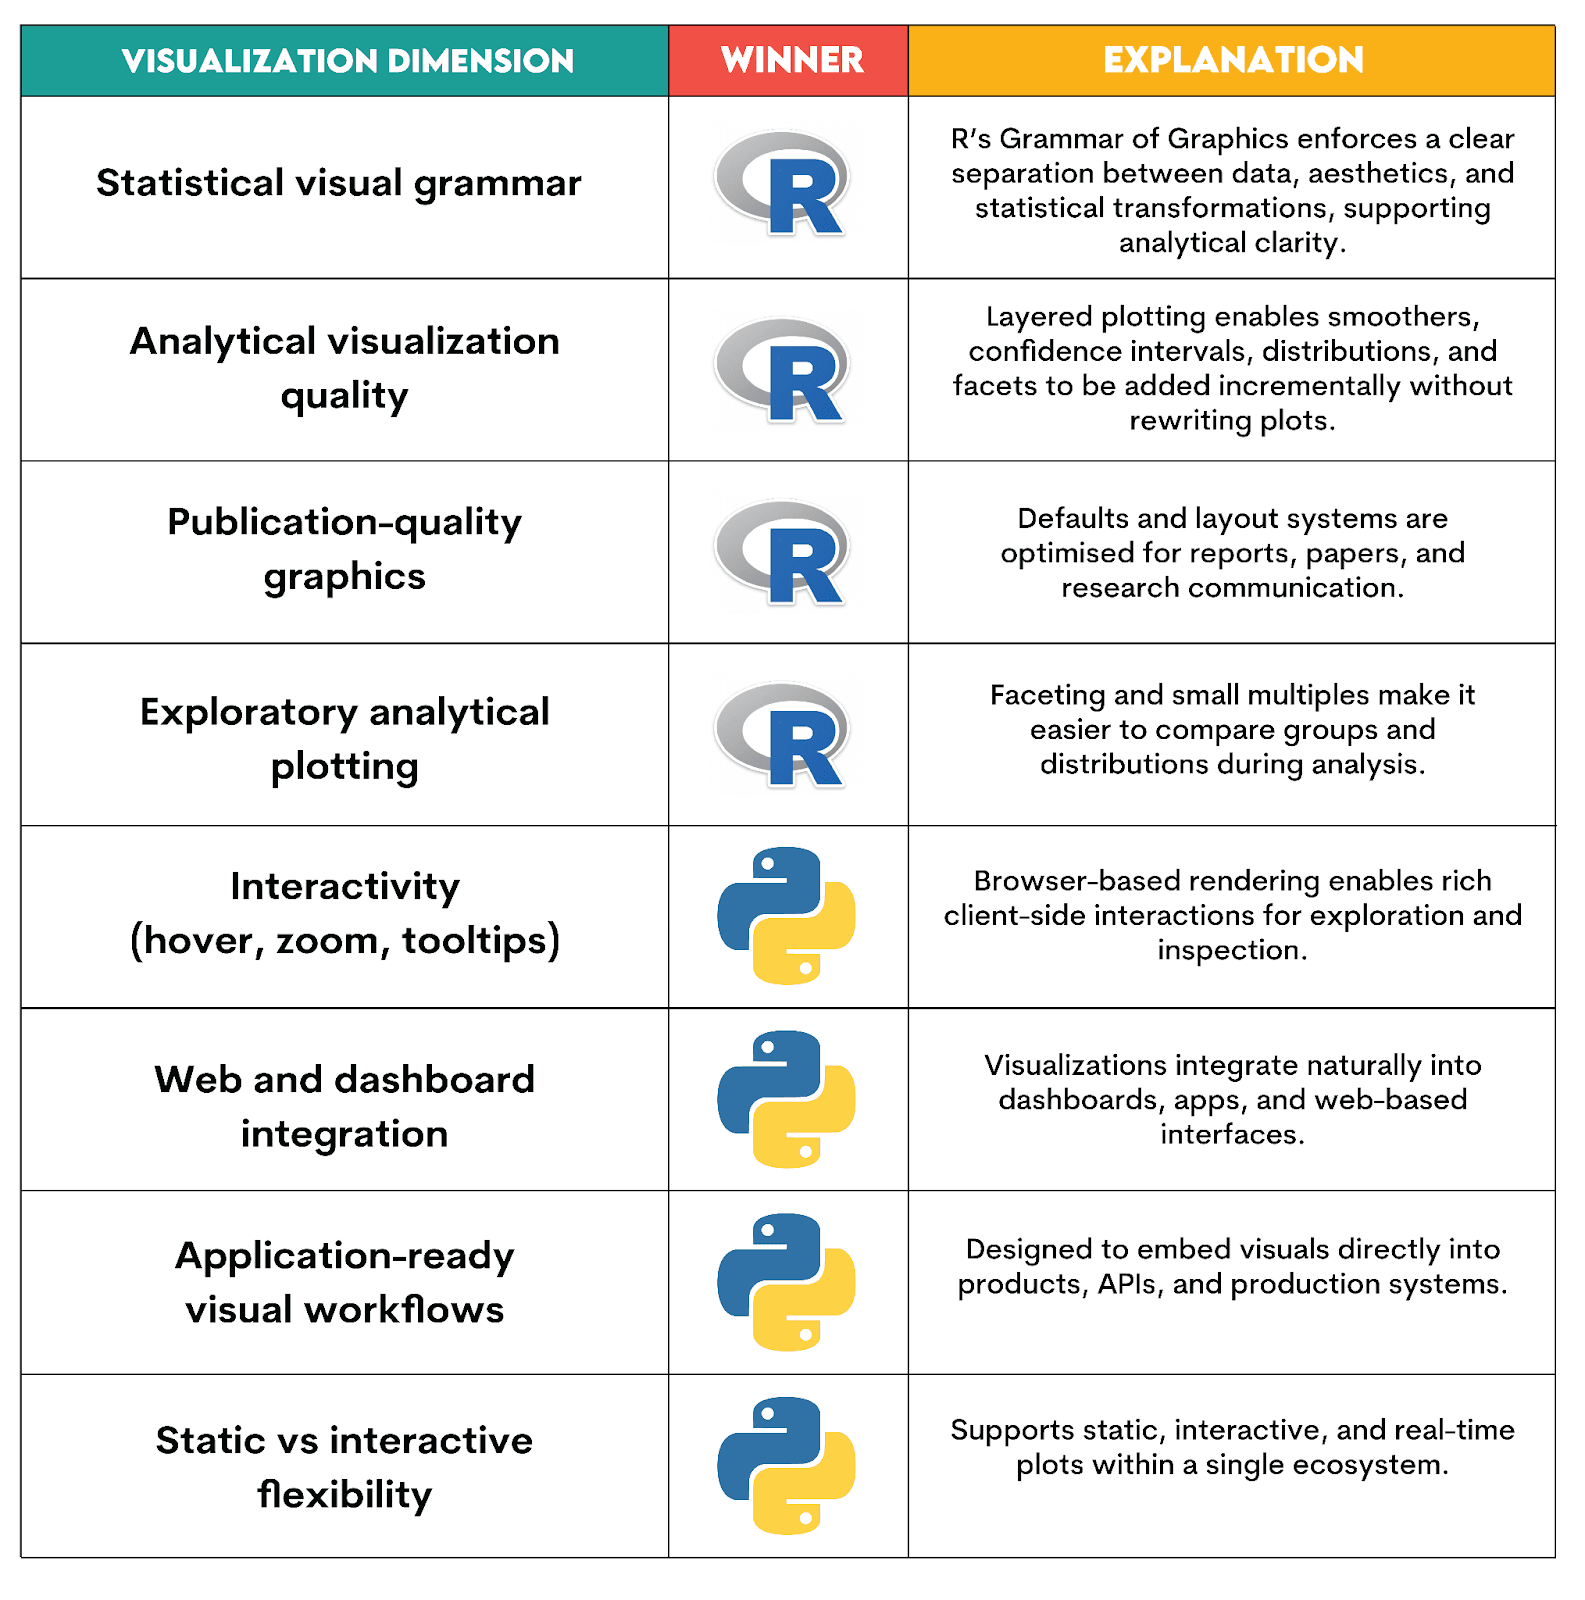
R is better for insight: it excels at analytical visualization and publication-quality graphics.
Python is better for interactive visualizations and application-ready graphics, e.g., dashboards, web apps, workflows that move beyond static plots.
Here’s what shaped our verdict.
Python vs R: Machine Learning and Deep Learning
This stage of the data science pipeline focuses on training models, optimizing performance, and handling large-scale data. (We’ll cover model deployment as a separate stage.)
But what is it exactly?
What Is Machine Learning? What Is Deep Learning?

Machine learning (ML) is a subset of artificial intelligence (AI) that allows systems to autonomously make predictions and/or decisions by learning from historical data without being explicitly instructed (programmed) what to do. Some examples of machine learning practical use are:
- search engine ranking, e.g., Google Search, Bing
- credit card fraud detection
- speech-to-text apps, e.g., Google Assistant, Siri
- GPS route optimization, e.g., Google Maps
- recommendation engines, e.g., Netflix, Amazon, Spotify
Deep learning (DL) is, in turn, a subset of ML. Unlike machine learning, DL models need less manual feature engineering, as they rely on artificial neural networks (often with many layers) to automatically learn features from raw, unstructured data, such as images, text, audio, and video. DL is applied in:
- Image recognition, e.g., face ID on smartphones, medical imaging, social media auto-tagging people in photos
- Natural language processing, e.g., email spam filters, chatbots, language translation (Google Translate)
- Autonomous driving, e.g., Tesla Autopilot or Waymo self-driving cars
- Social media ranking algorithms, e.g., YouTube video recommendations or Instagram feeds
- Virtual assistants, e.g., Siri, Alexa, Google Assistant
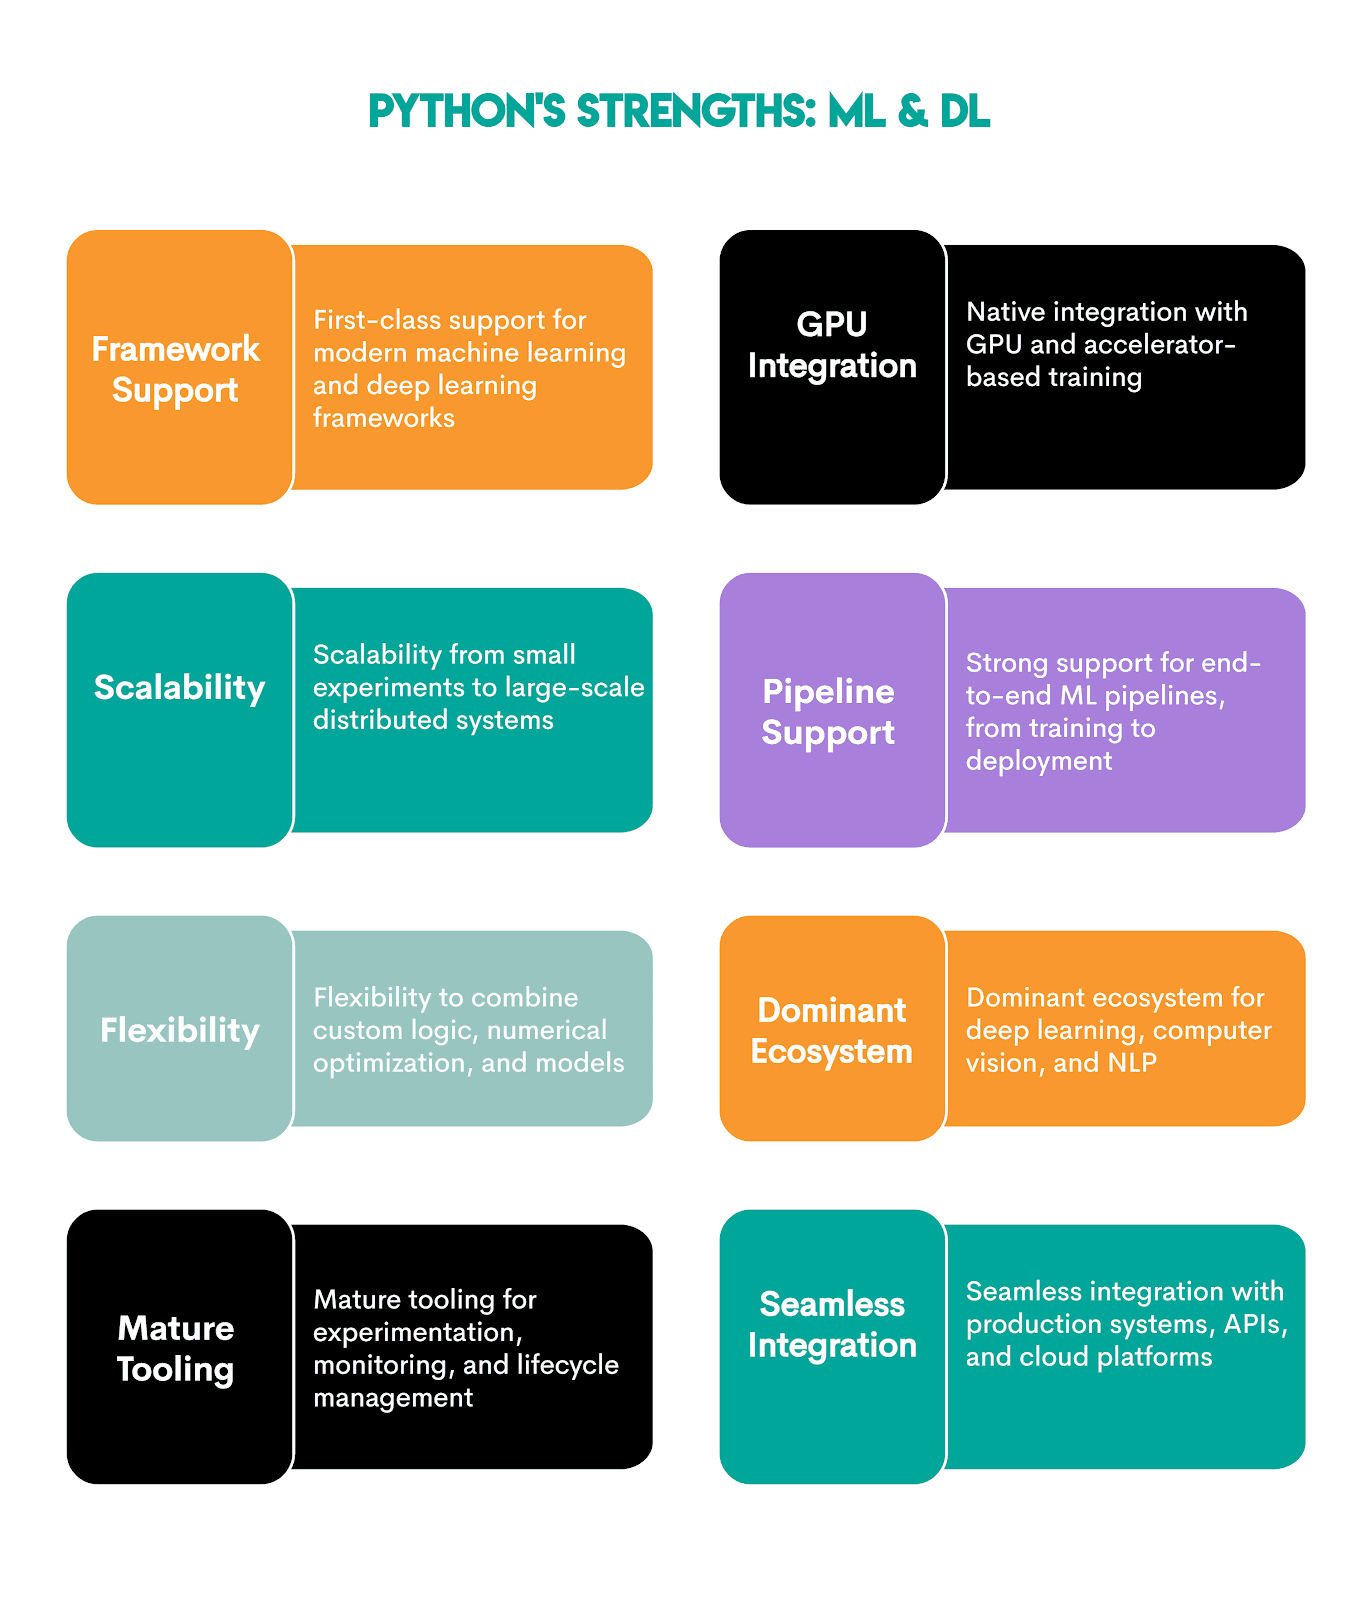
Machine Learning and Deep Learning With Python
Python has become dominant in machine learning and deep learning, establishing itself as an industry standard. That’s mainly because Python supports the entire ML/DL lifecycle, from data preparation and model training to deployment, monitoring, and scaling.
Apart from ML and DL, Python is widely used in computer vision, natural language processing, and large-scale AI systems.
A wide range of machine learning and deep learning libraries also helps.
- NumPy
- SciPy
- pandas
- scikit-learn
- XGBoost
- LightGBM
- CatBoost
- TensorFlow
- Keras
- PyTorch
- TorchVision/TorchText
- spaCy
- Hugging Face transformers
- OpenCV
Here are more details about the libraries.

Regarding Python’s strengths in ML & DL, here’s their overview.
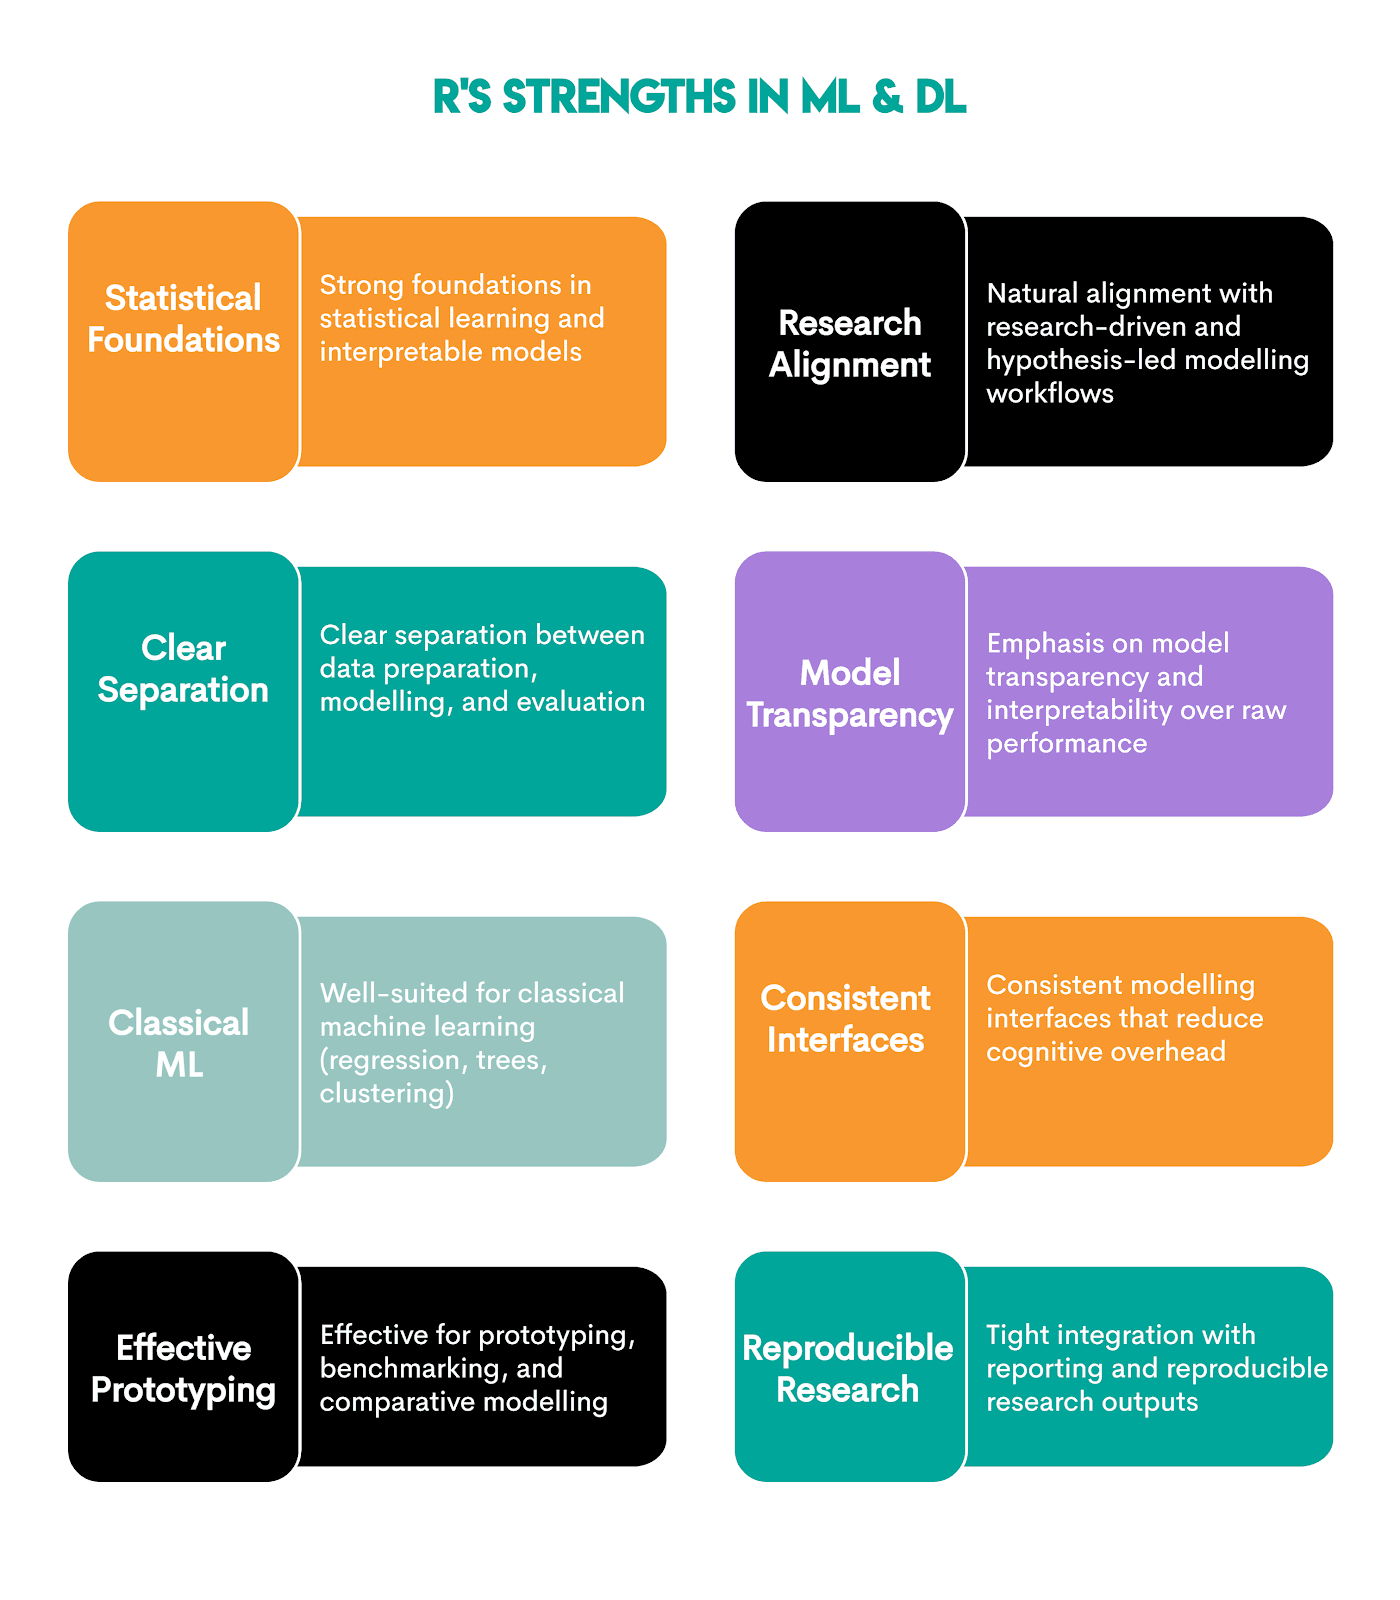
Machine Learning and Deep Learning With R
Although R was not designed with ML and DP in mind, it still offers strong capabilities for these tasks. Admittedly, it is better for traditional machine learning, especially in model development, experimentation, interpretation, and reporting, especially when working with tabular data.
The R packages used in ML and DL are:
Here are more details about each.
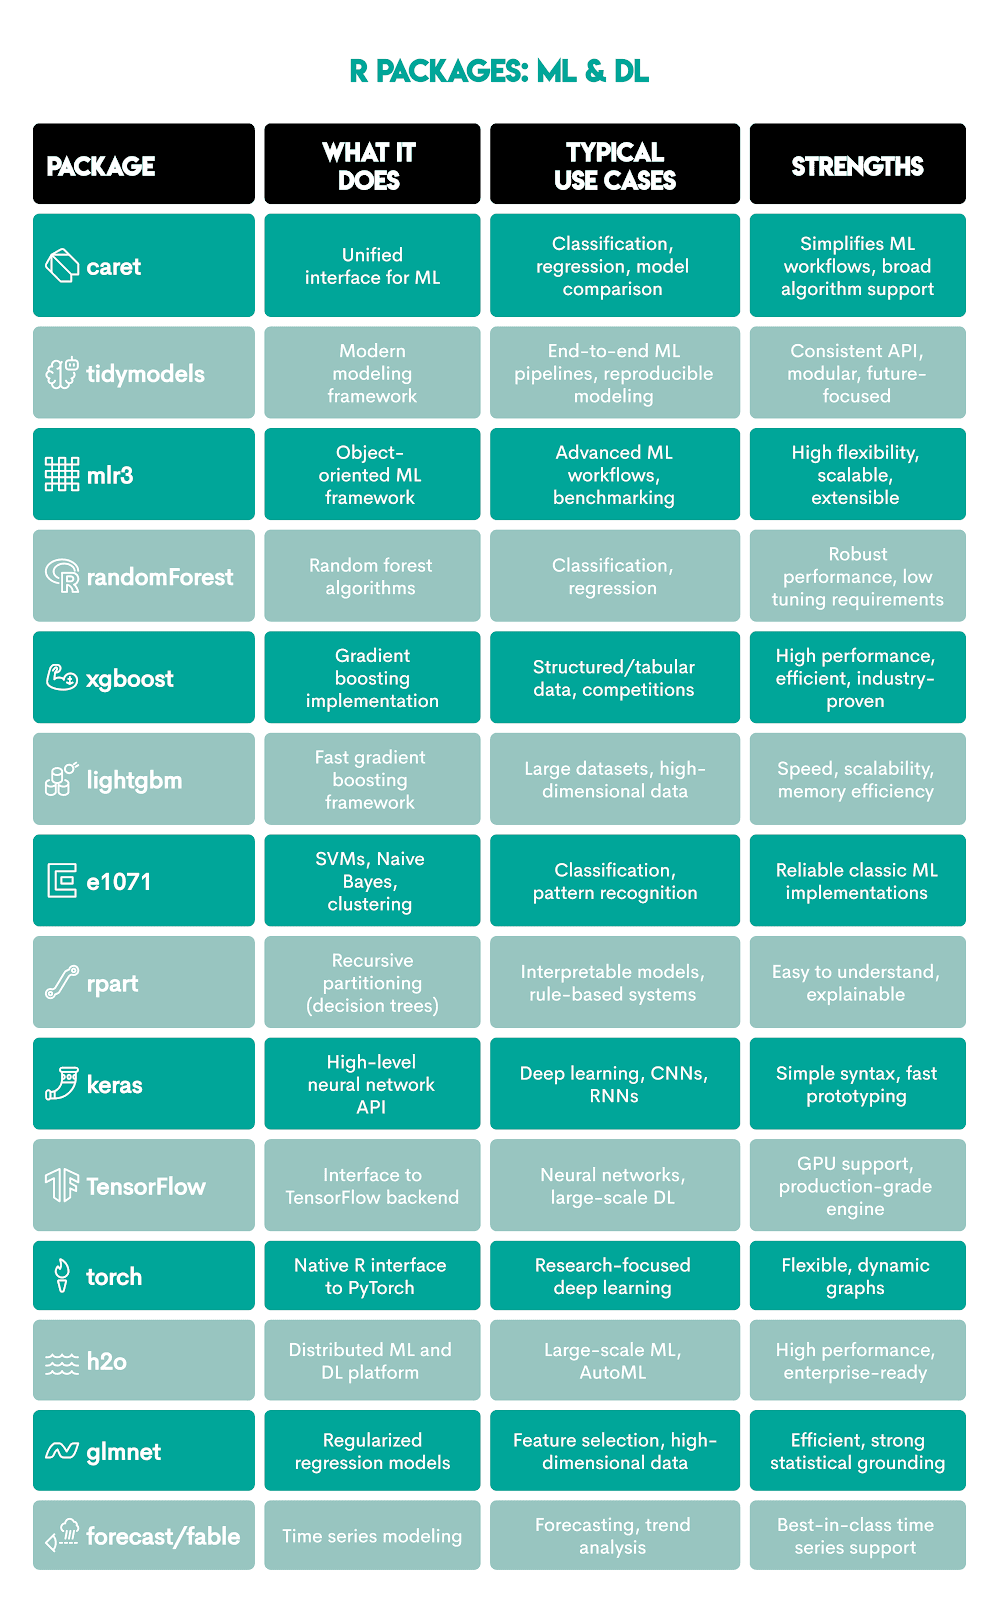
There are the R’s strengths in machine learning and deep learning.
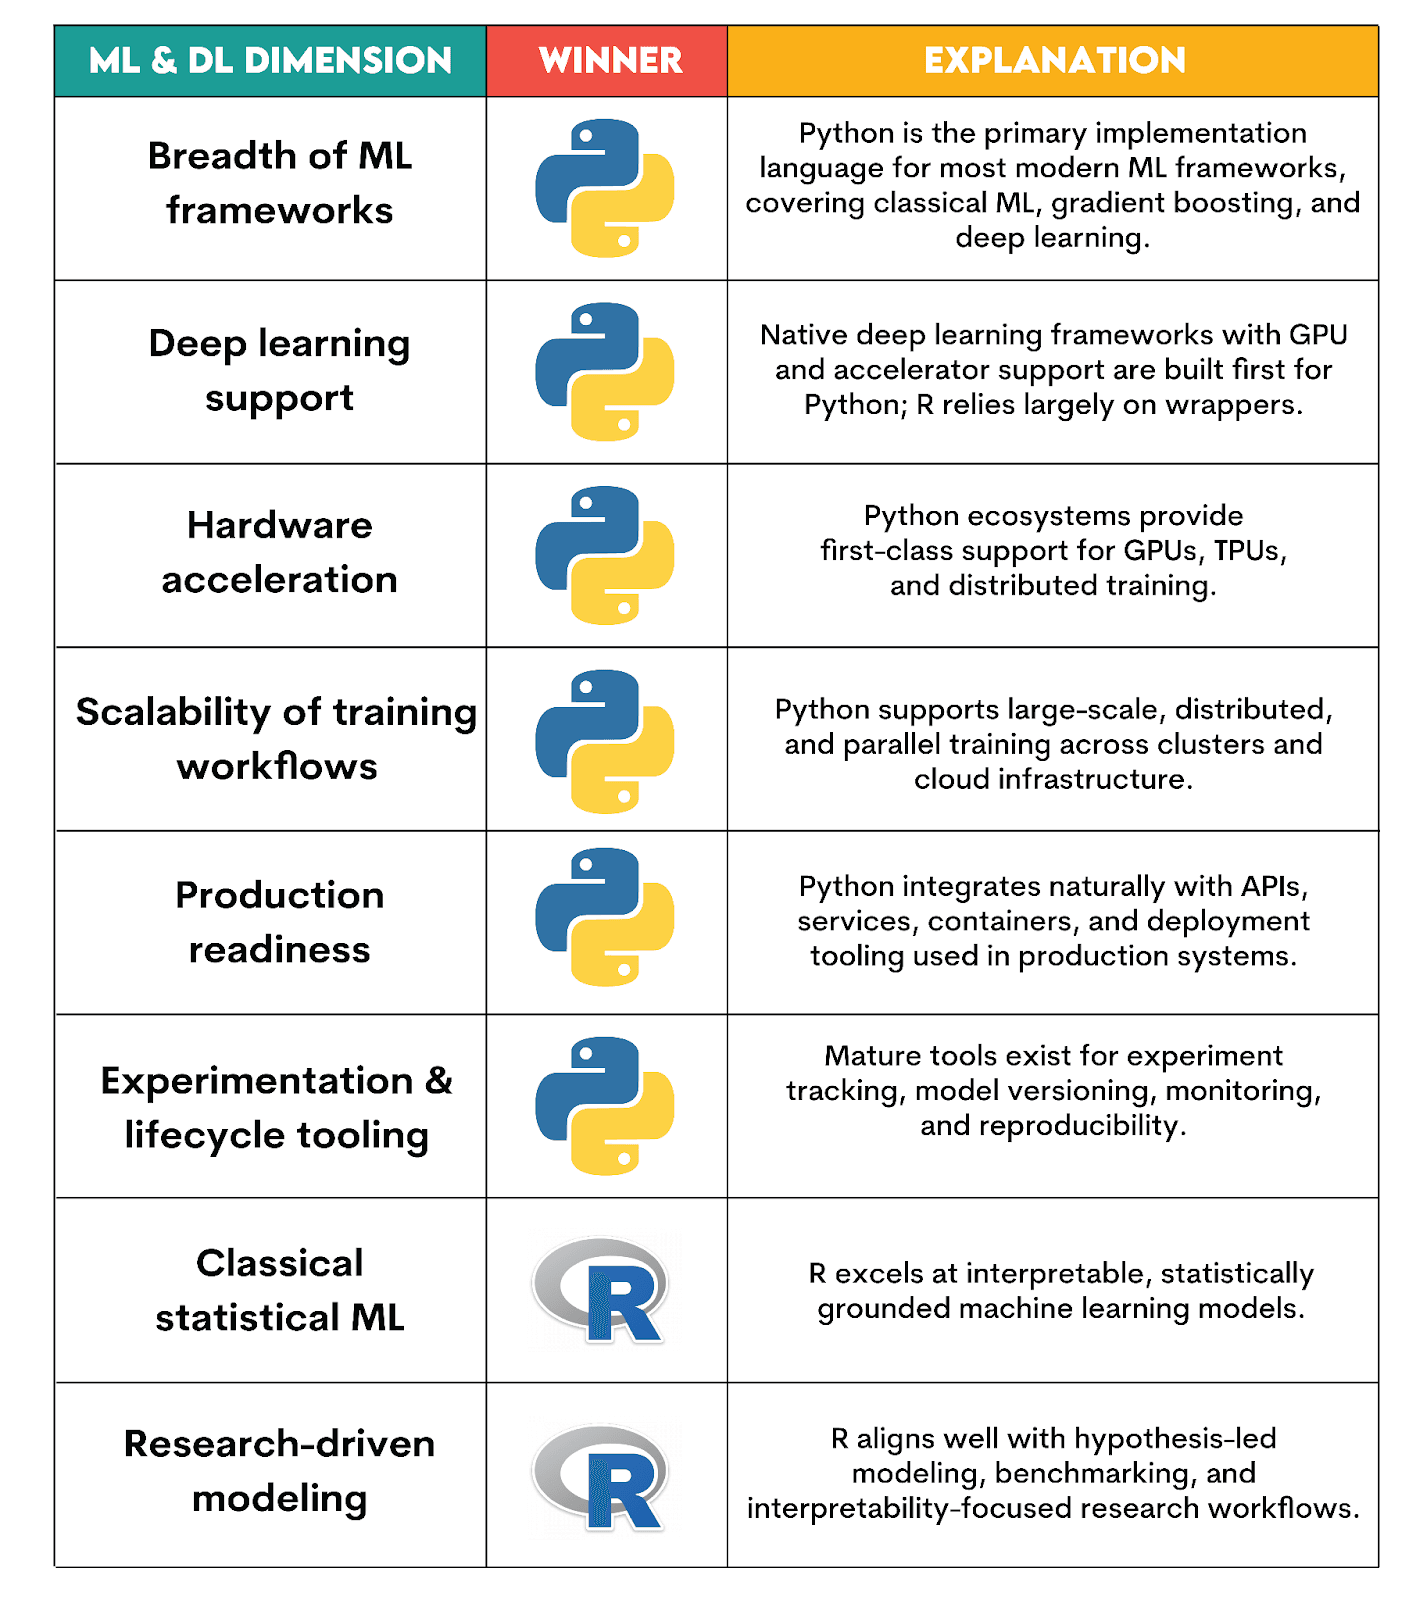
Which Language is Better for Machine Learning & Deep Learning?
Verdict explanation:
Python wins because it offers exactly what modern ML and DL systems require: scalable training, hardware acceleration, and experimentation infrastructure.
R is still valuable in classical machine learning, statistical learning, and research-driven modeling. However, it’s not competitive anymore when it comes to deep learning and production-scale machine learning systems.
Here’s what shaped our verdict.
Python vs R: Deployment, MLOps & Production Workflows
After you train models comes the final challenge: operationalization. This encompasses turning a machine learning model into a system that can be used, monitored, and maintained.
In this stage, you must address deployment, workflow orchestration, model lifecycle management, and integration with real-world applications.
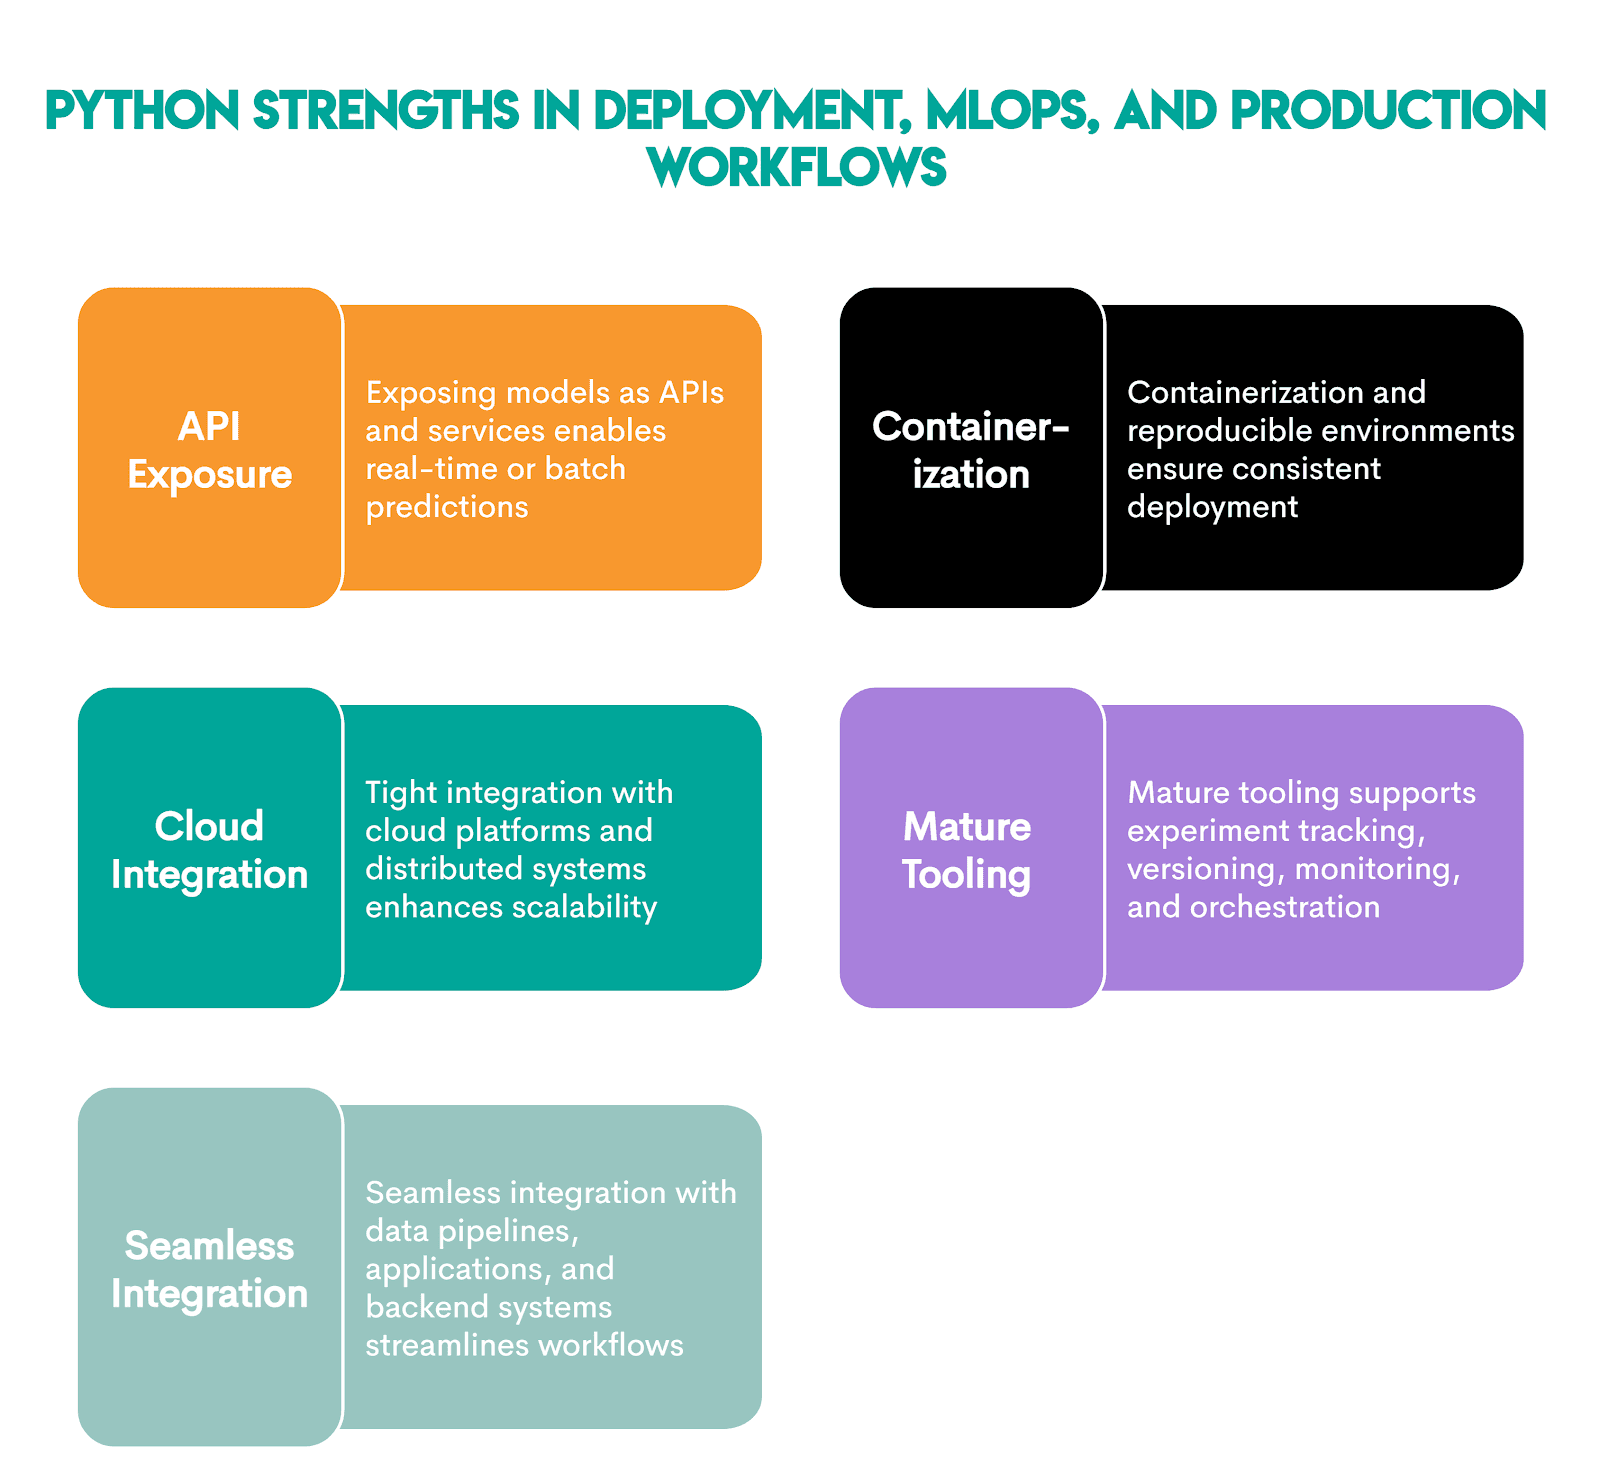
Deployment, MLOps, and Production Workflows With Python
Python was designed to be a production-first language, so it's no wonder it dominates the world of machine learning deployments at scale.
Its capabilities make it well-suited for:
- production ML systems
- scalable inference services
- continuous training and deployment pipelines
- MLOps-driven workflows
These libraries help its suitability.
- FastAPI
- Flask
- Uvicorn/Gunicorn
- SQLAlchemy
- Pydantic
- MLflow
- Apache Airflow
- Prefect
- Docker
- Kubernetes
- BentoML
- ONNX
- DVC
- Streamlit
Here are more details about each library.

These libraries enable Python to achieve these strengths in deployment, MLOps, and production workflows.
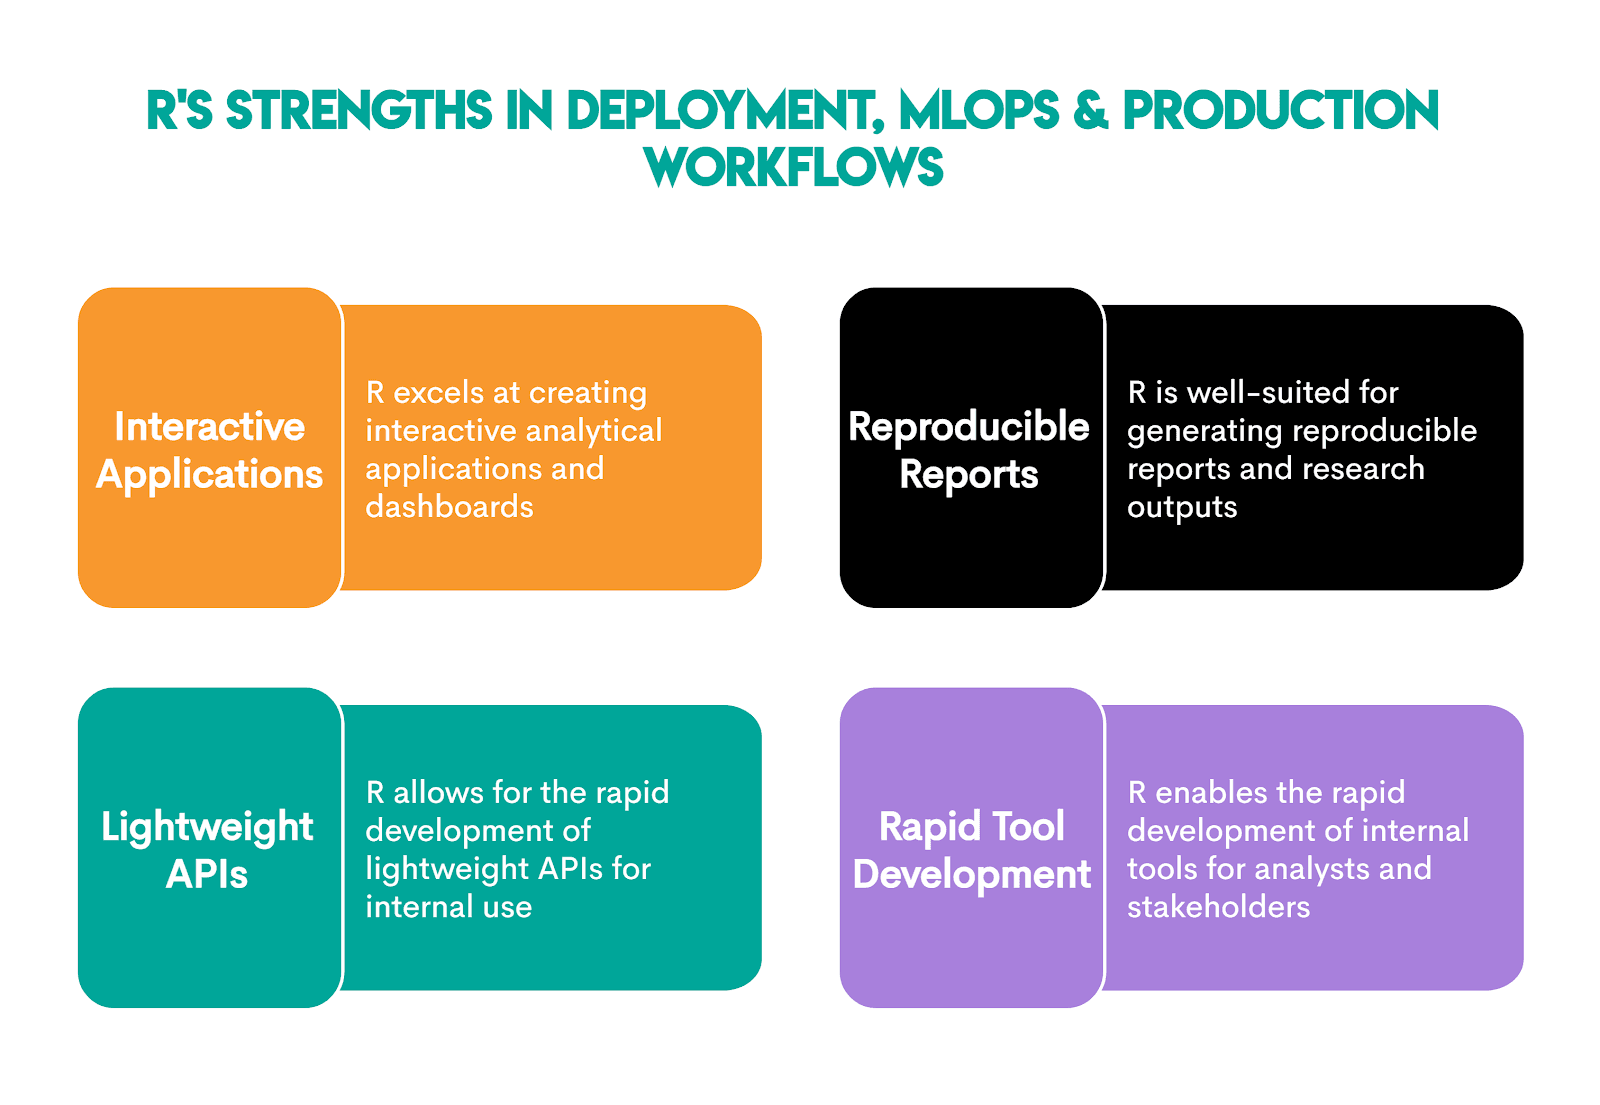
Deployment, MLOps, and Production Workflows With R
R approaches deployment from an analysis-first perspective, meaning it focuses on communication, interactivity, and reproducibility, not large-scale services.
Workflows in R primarily focus on human-facing outputs, not so much automated systems.
This makes R very useful for:
- Internal dashboards
- Exploratory tools
- Reporting pipelines
- Decision-support pipelines
Compared with Python, deploying R in production settings at scale requires additional infrastructure and engineering work.
When it comes to packages, these are commonly used for such tasks.
- shiny
- shinydashboard/bslib
- Plotly (R)
- R Markdown
- Quarto
- knitr
- bookdown
- plumber
- jsonlite
- httr/curl
- targets
- cronR
- renv
- Docker (Rocker images)
Here are more details.
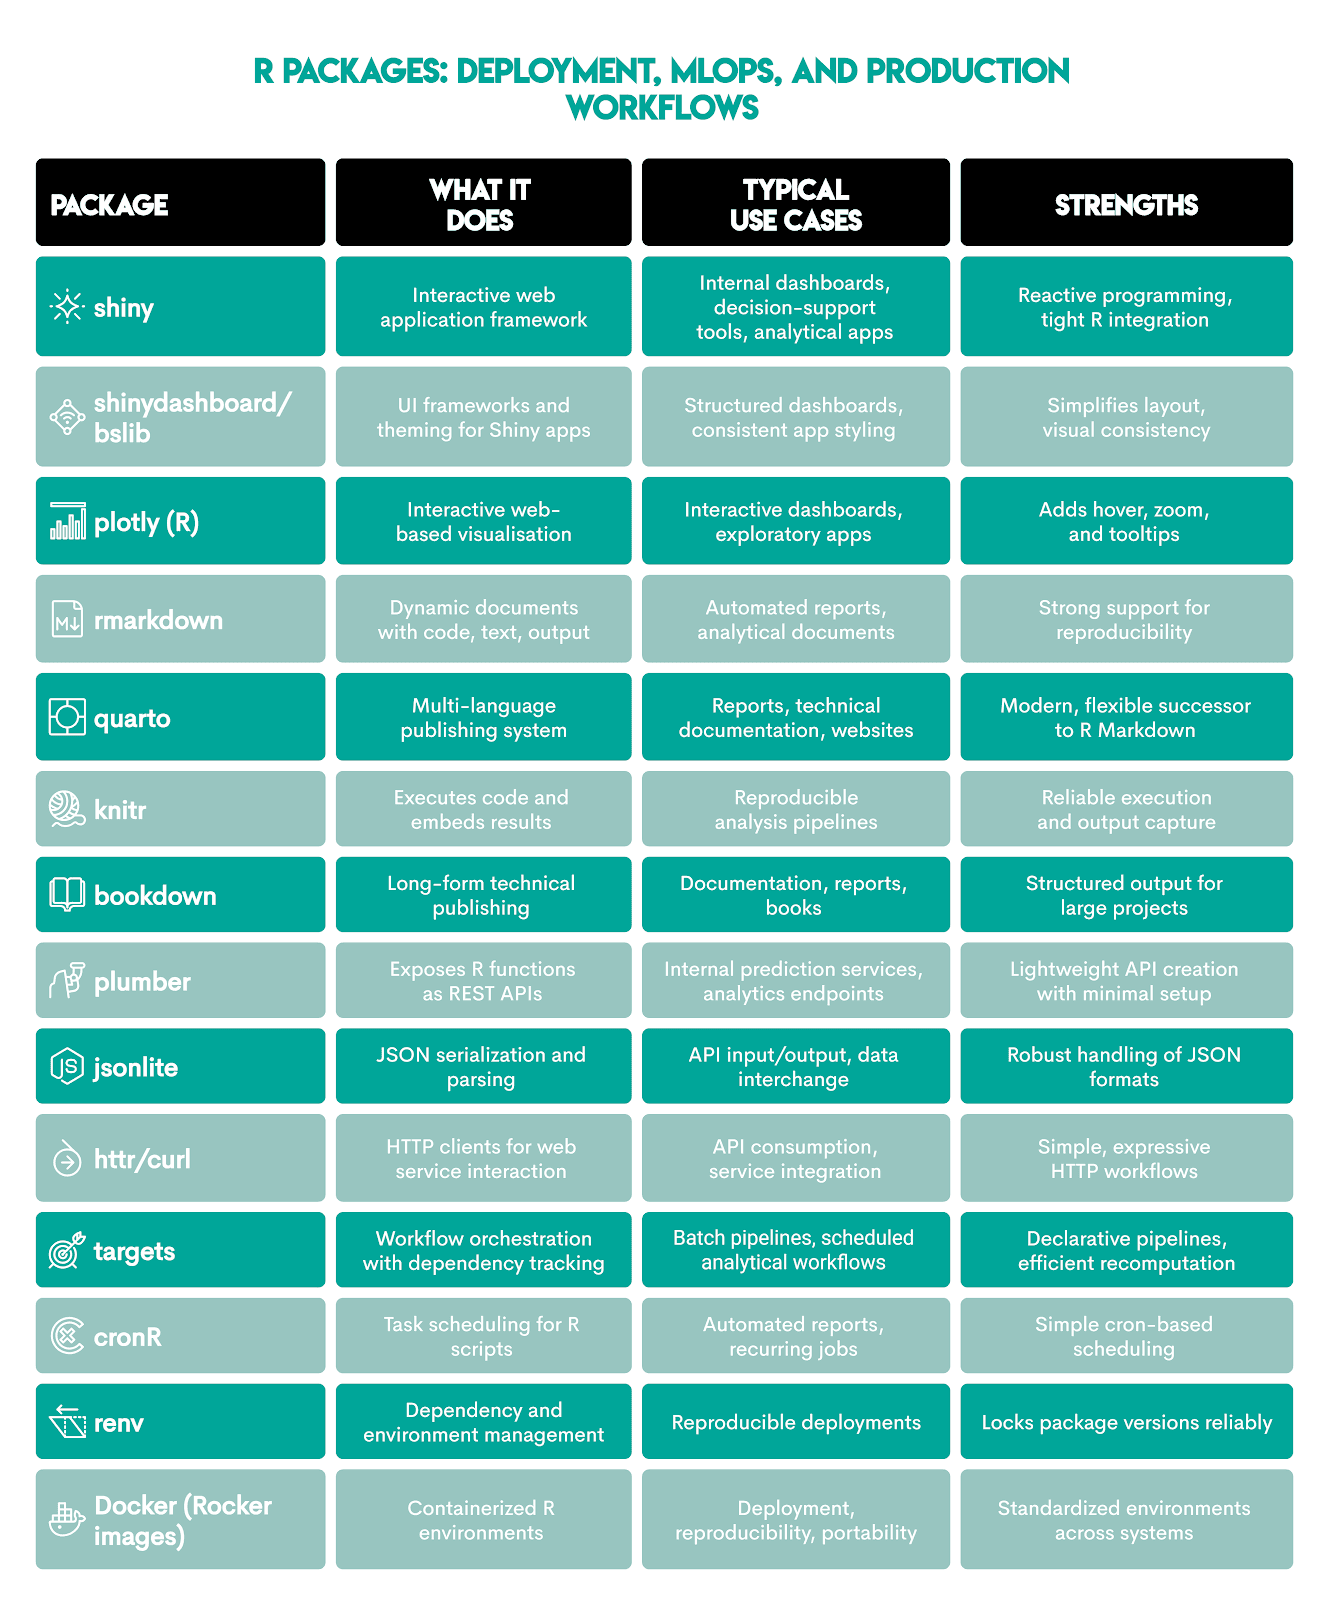
These packages create several of R’s key strengths in deployment, MLOps, and workflow tasks.
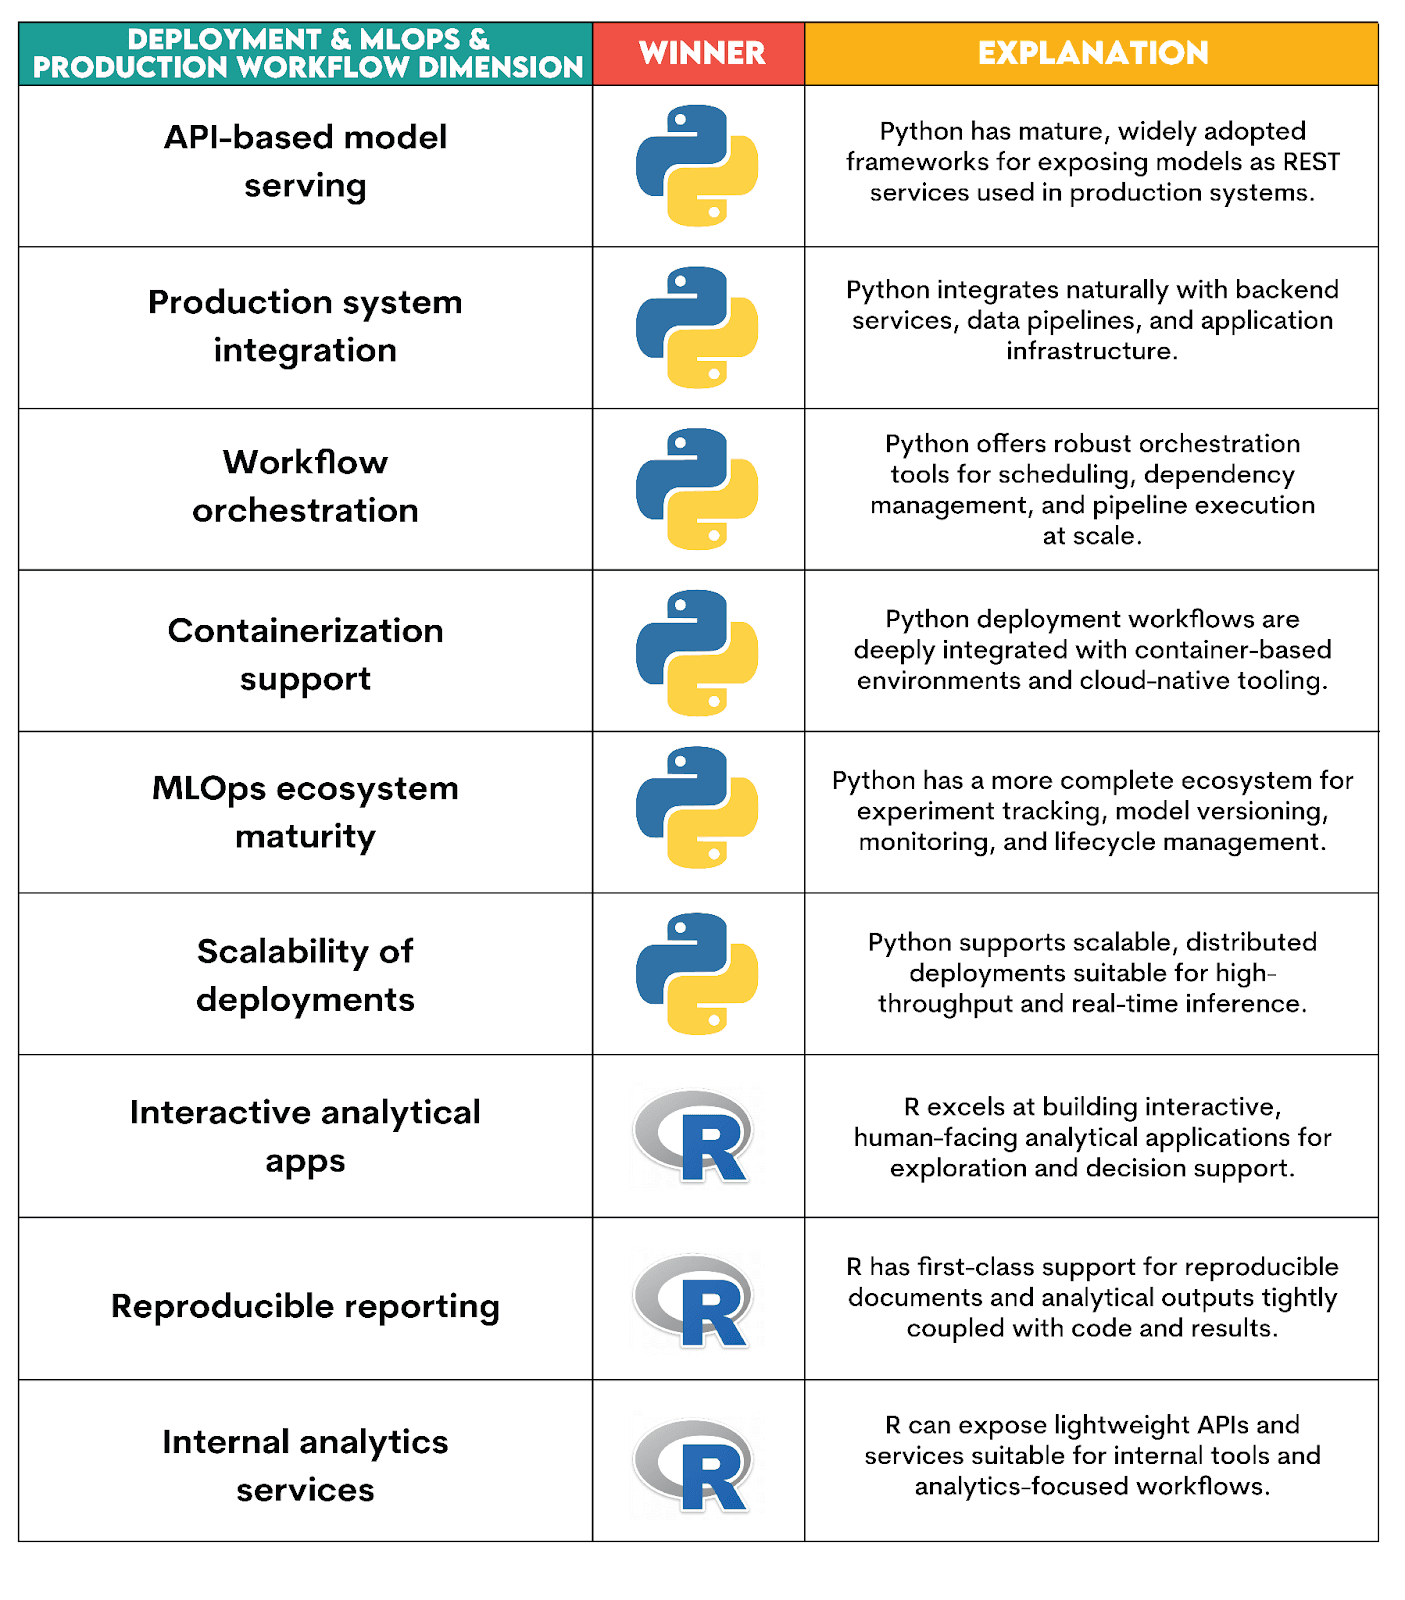
Which Language is Better for Deployment, MLOps, and Production Workflows?

Verdict explanation:
Python wins because it naturally integrates with containerization, cloud infrastructure, monitoring, orchestration, and automated ML pipelines.
R is still well-suited for analytical applications and reporting, where the focus is on communication and interpretability, not scalability.
Here are more details about the verdict.
Python vs R: Community & Jobs
When choosing a programming language, questions to consider include:
- How common is this programming language in the field?
- How hard or easy will it be for me to learn this language and use it on a daily basis?
- How easy will it be for me to find support when I need it?
- How easy is it for me to find a job?
- Does this skill pay well? Does it pay off learning it?
We’ll pit Python and R against each other in the following categories:
- popularity among the data science community
- job availability
Python vs R: Data Science Community Popularity
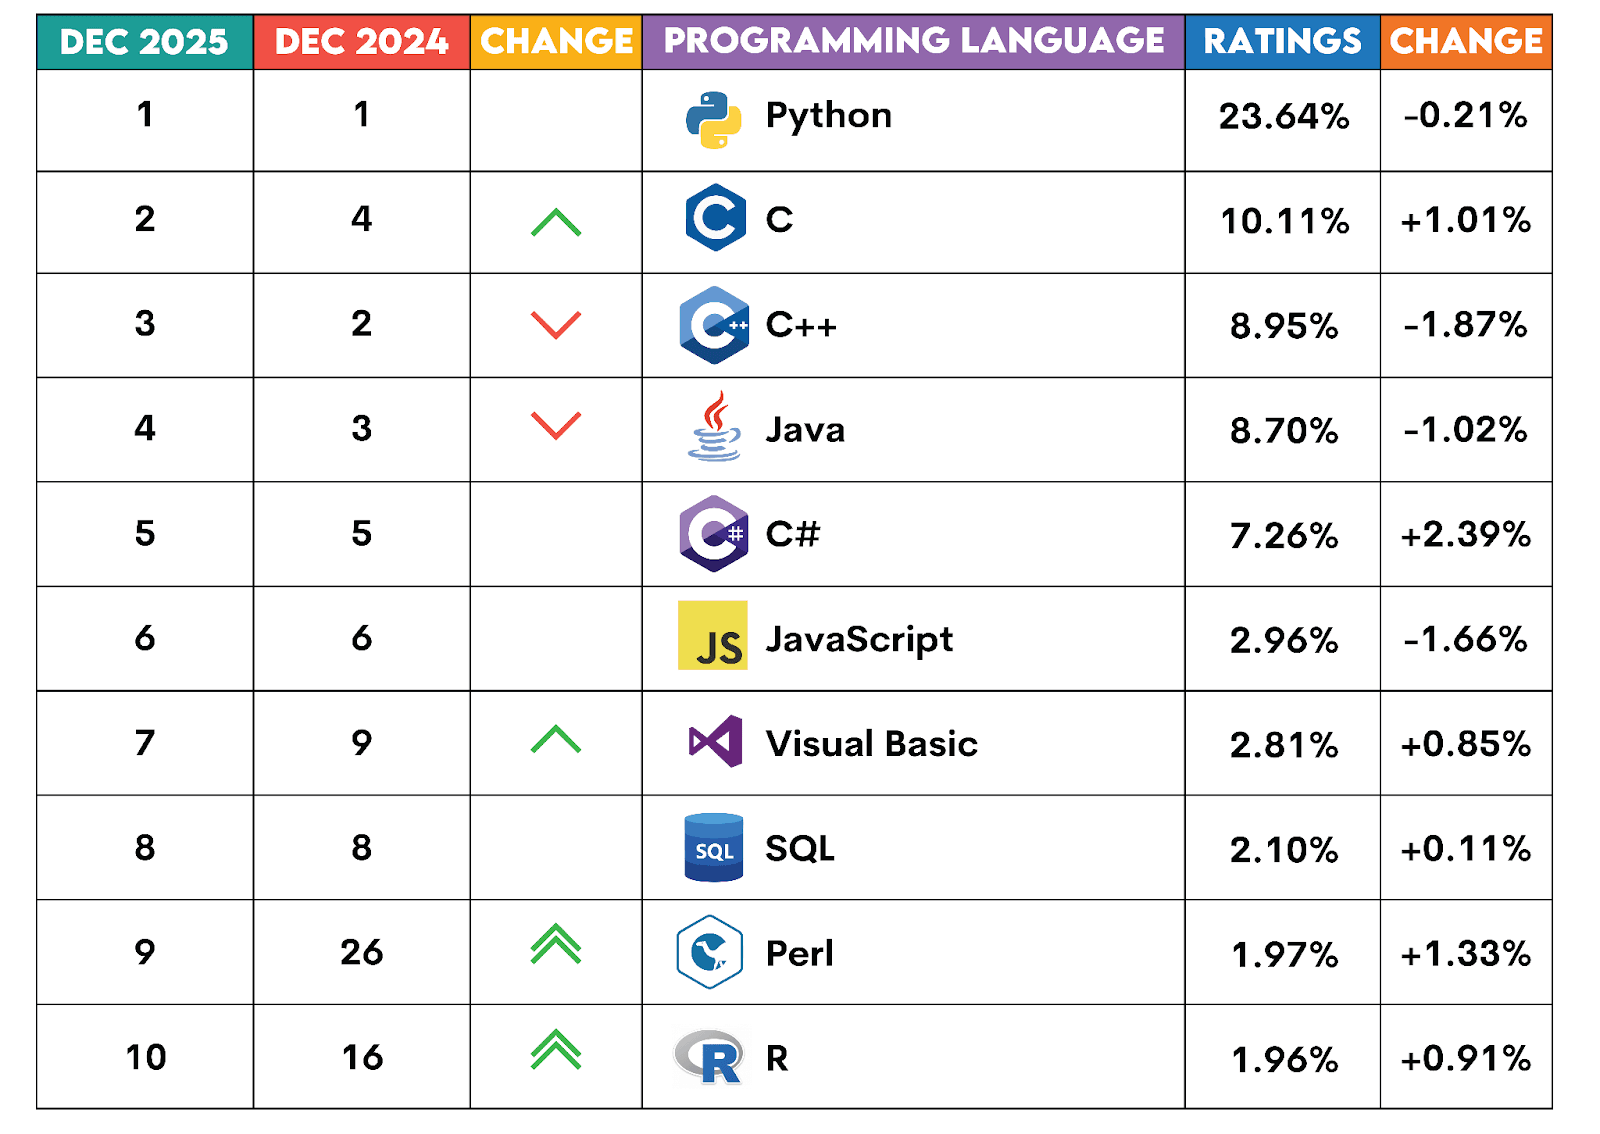
Data from the TIOBE Index is based on the number of worldwide courses, third-party vendors, and skilled engineers related to each language the TIOBE Index reports on.
It shows that, between December 2025 and December 2025, Python has solidified its position at the top.
R barely made it into the top ten. However, its popularity jumped from rank #16 to #10 over the year.
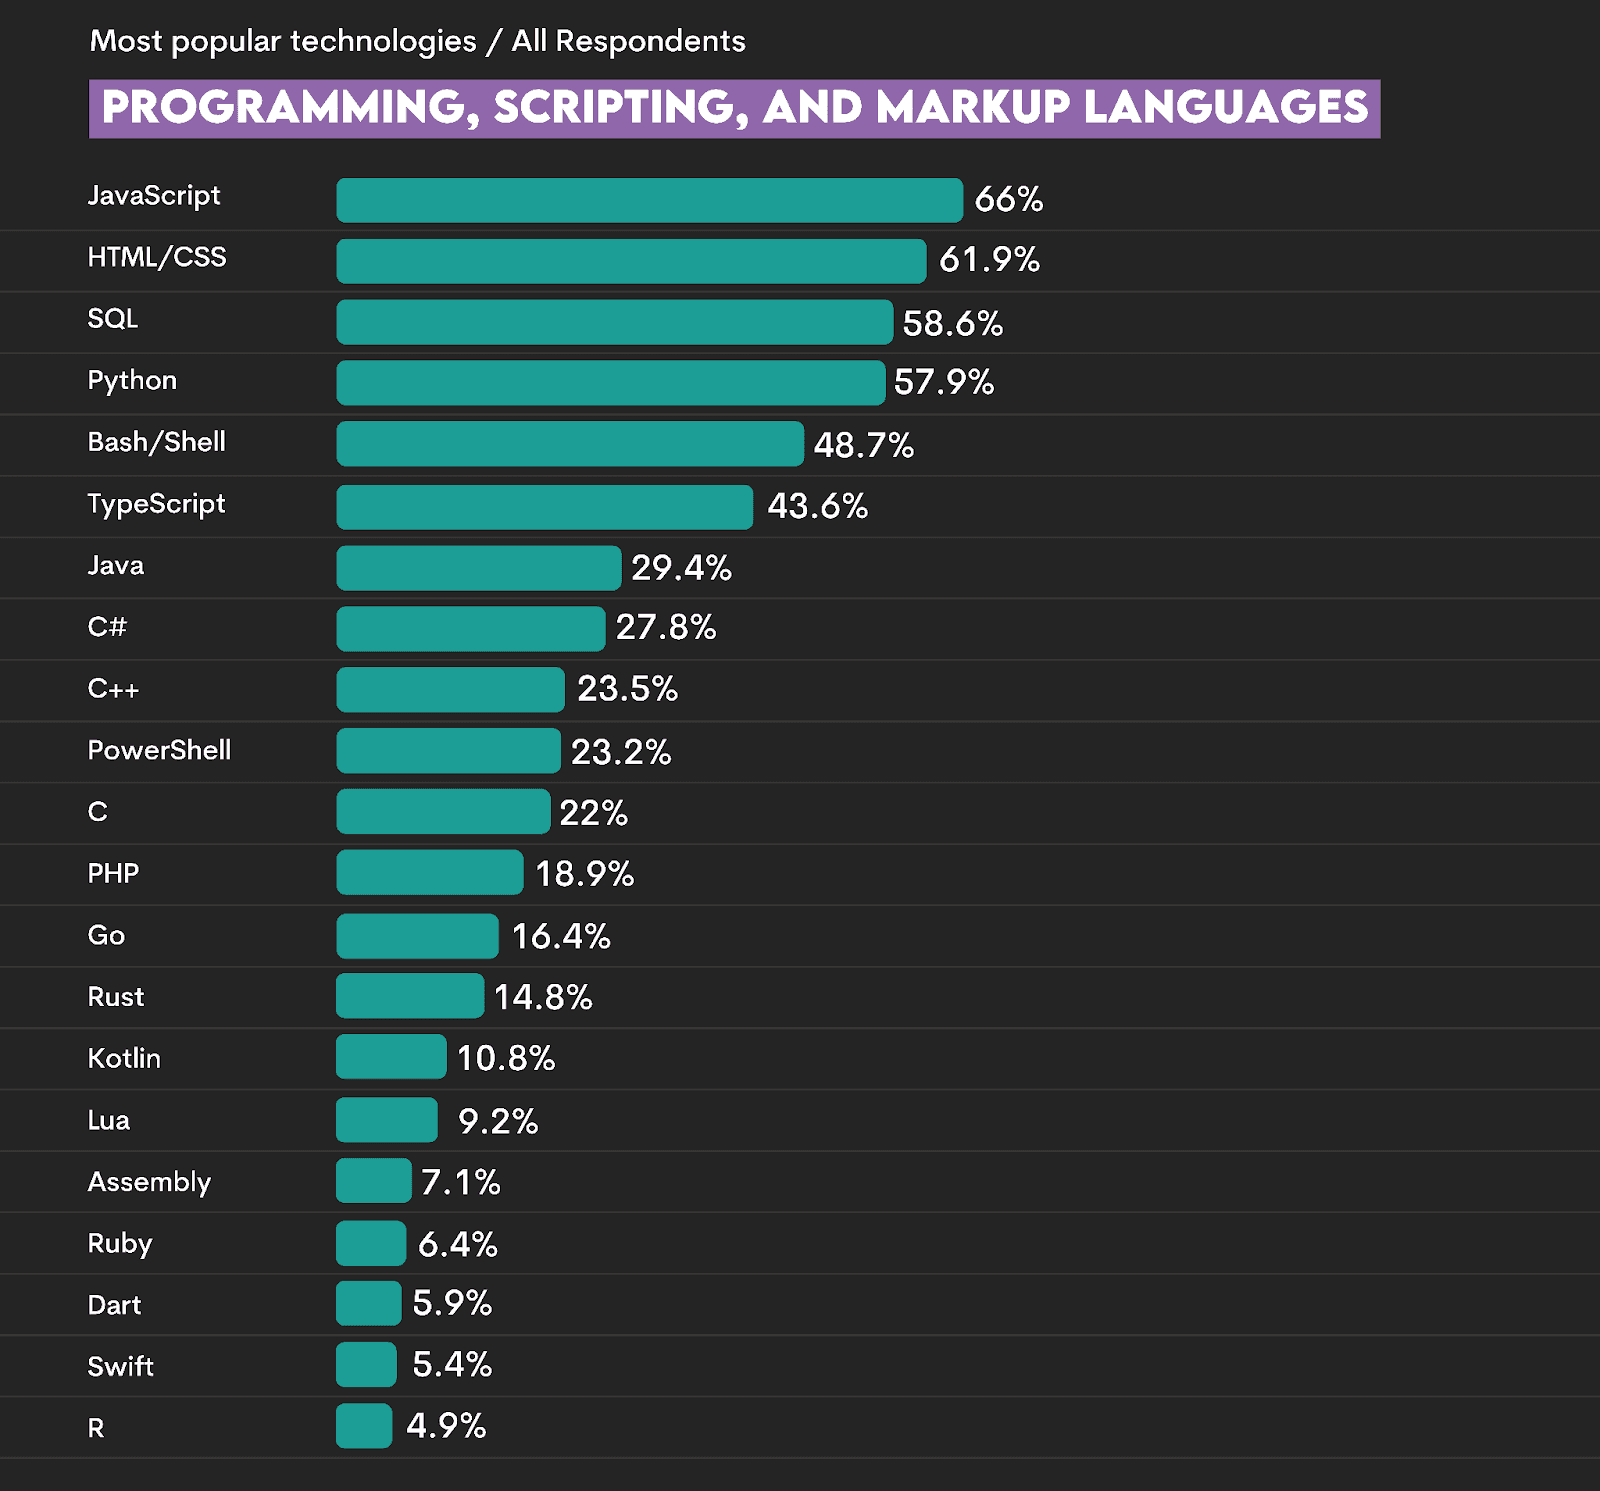
The Stack Overflow 2025 Developer Survey has Python ranked #4. There’s a 7% point increase from 2024 to 2025, which, according to the survey, “speaks to its ability to be the go-to language for AI, data science, and back-end development.
R is significantly lower, at #21.
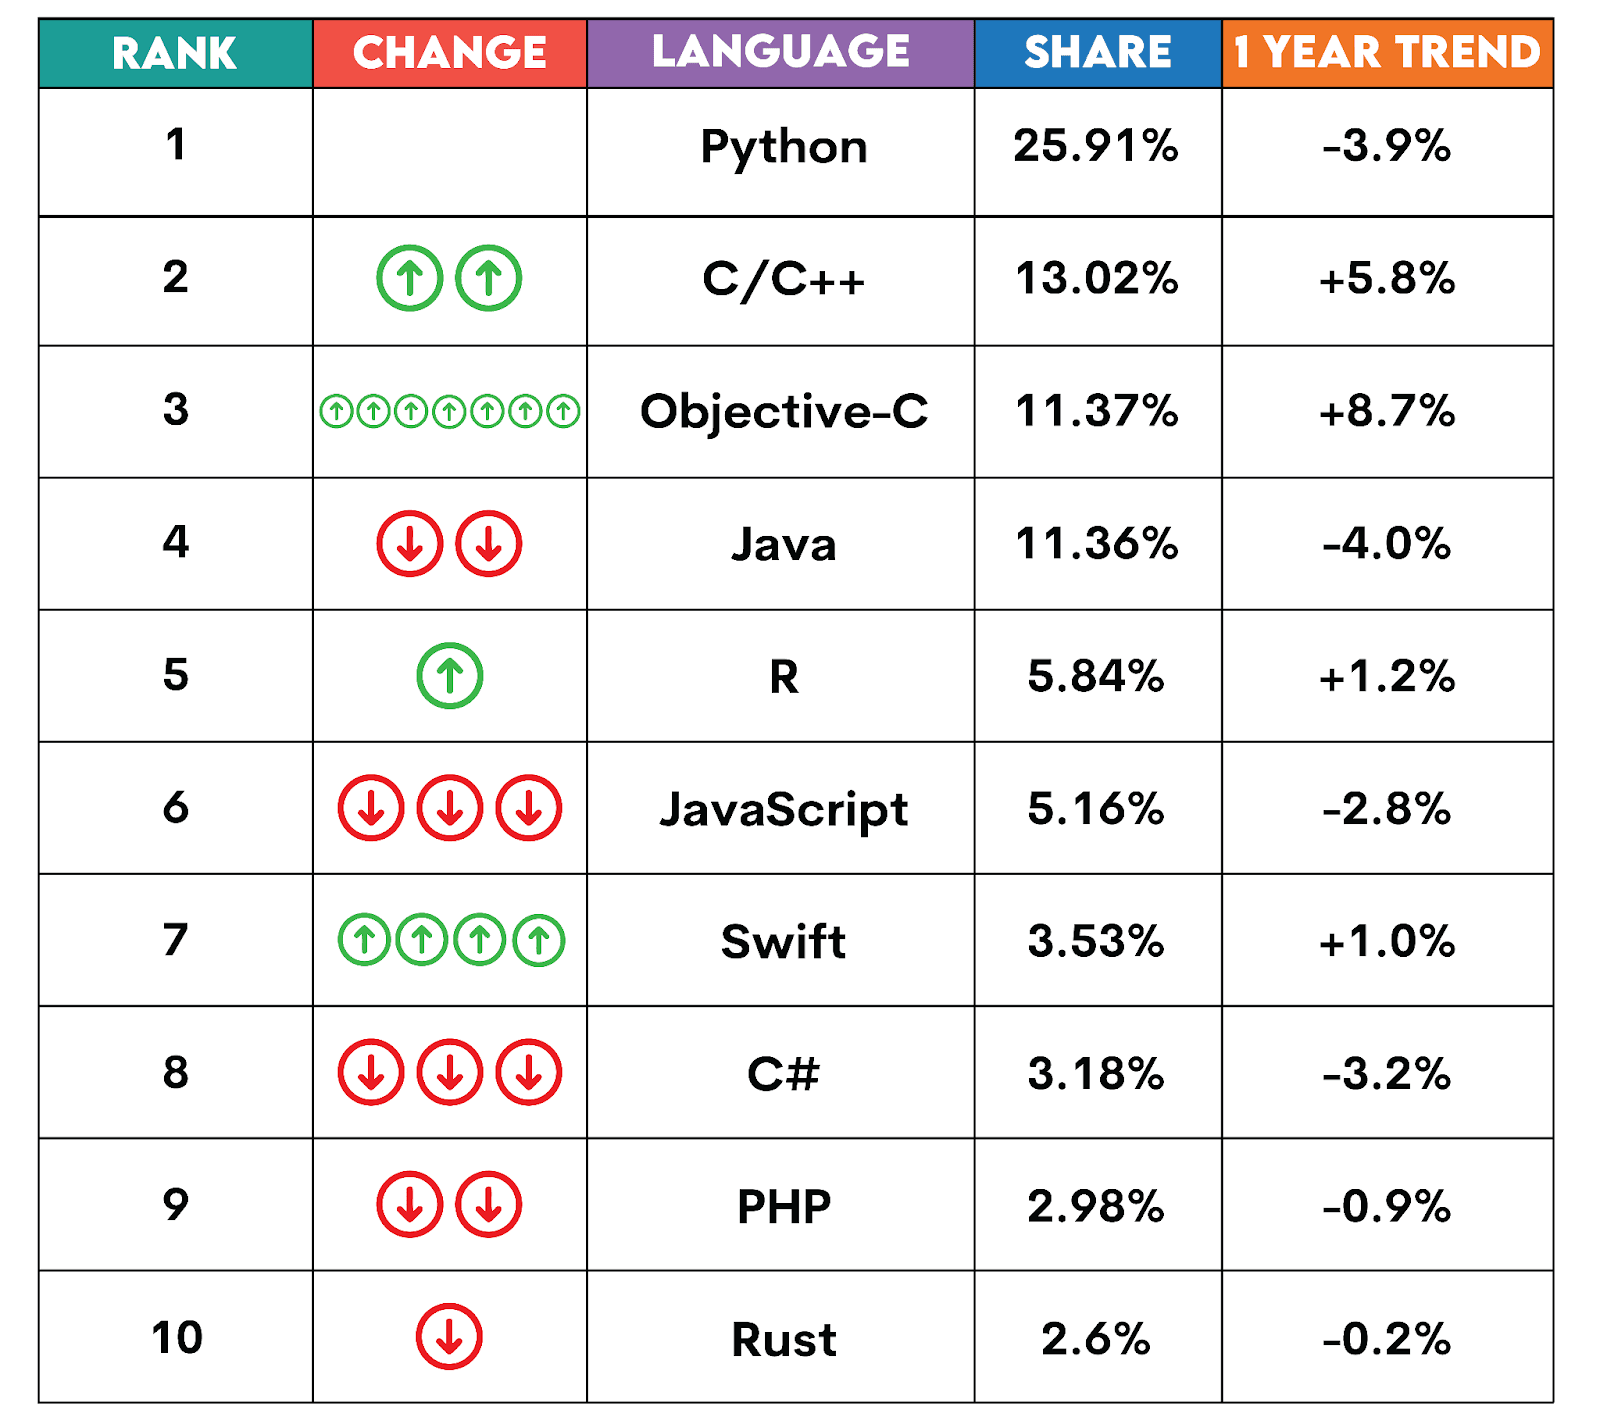
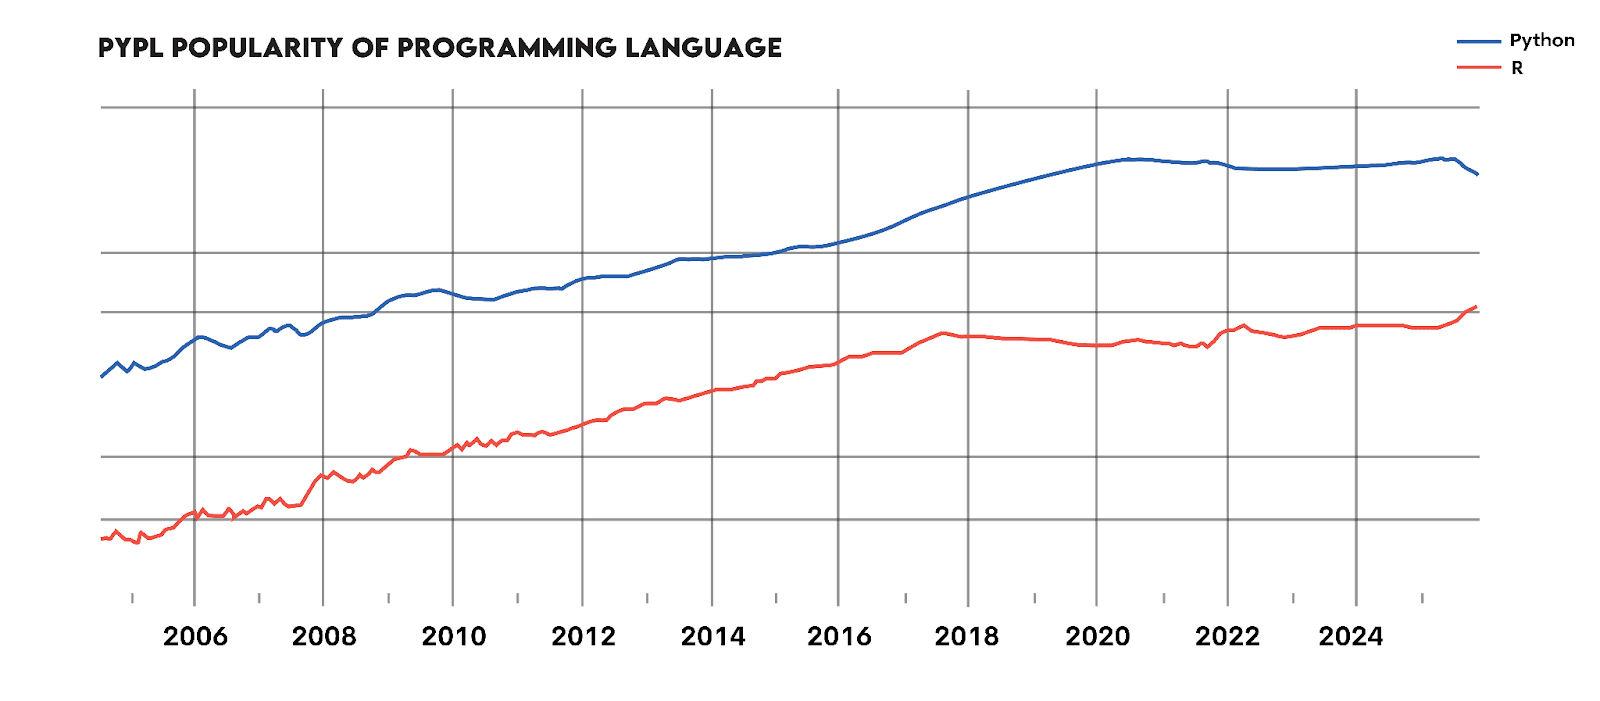
These trends are very similar to those in the PYPL Popularity of Programming Index, with December 2025 showing Python ranked #1 and R ranked #5 worldwide. PYPL uses raw data from Google Trends to determine the number of searches related to tutorials for each programming language in the market worldwide.
Despite dipping slightly (-3.9%) over the last year, Python still held the majority of searches at 25.91% of total tutorial searches in December 2025.
R saw a 1.2% growth, accounting for 5.84% of market searches.
The line chart below shows the development of the popularity of Python and R. The most important conclusion is that, in 20 years, R has never been as popular as Python, not even close. Saying it will never be is a safe bet.
Python vs R: Job Availability
We’ll now have a look at how common each programming language is in the data science job postings.
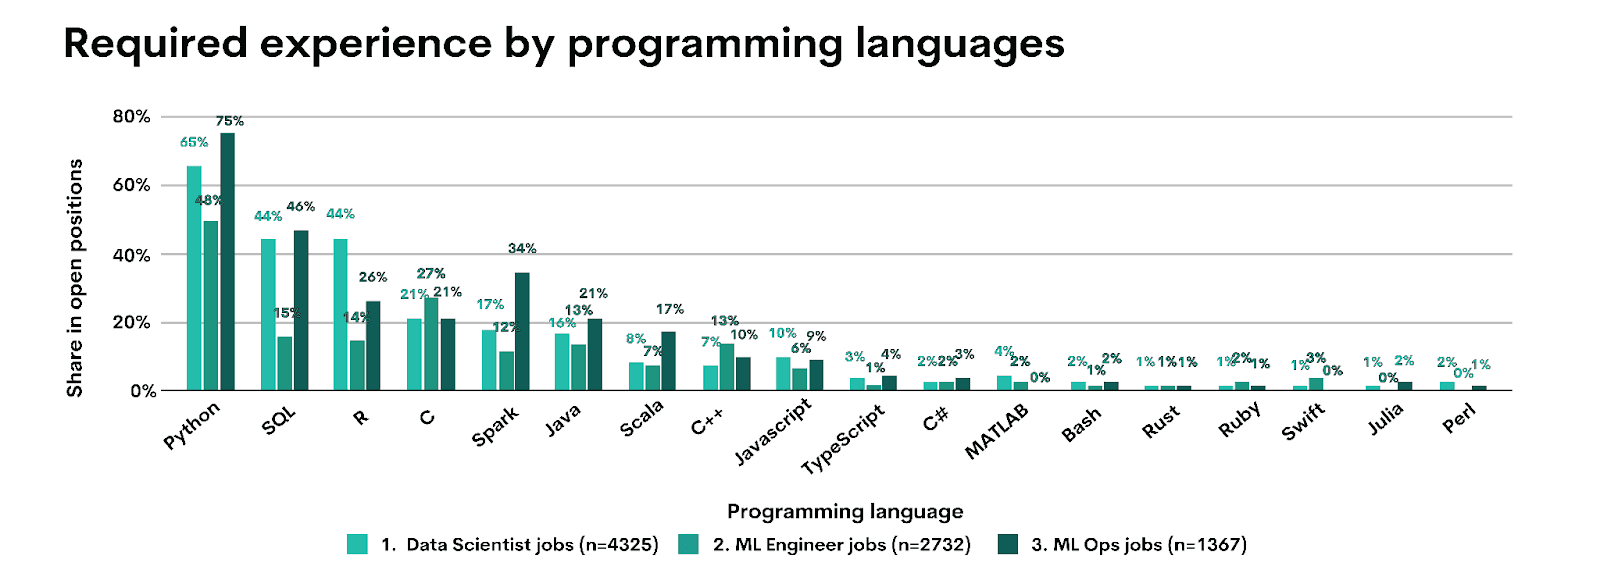
According to Jobs in Data, which analyzed 9,261 job postings in 2023, Python is the most sought-after programming language in data science, with 65% of roles requiring Python experience. R is third at 44%. While it shows that R is still important, Python is much more so.
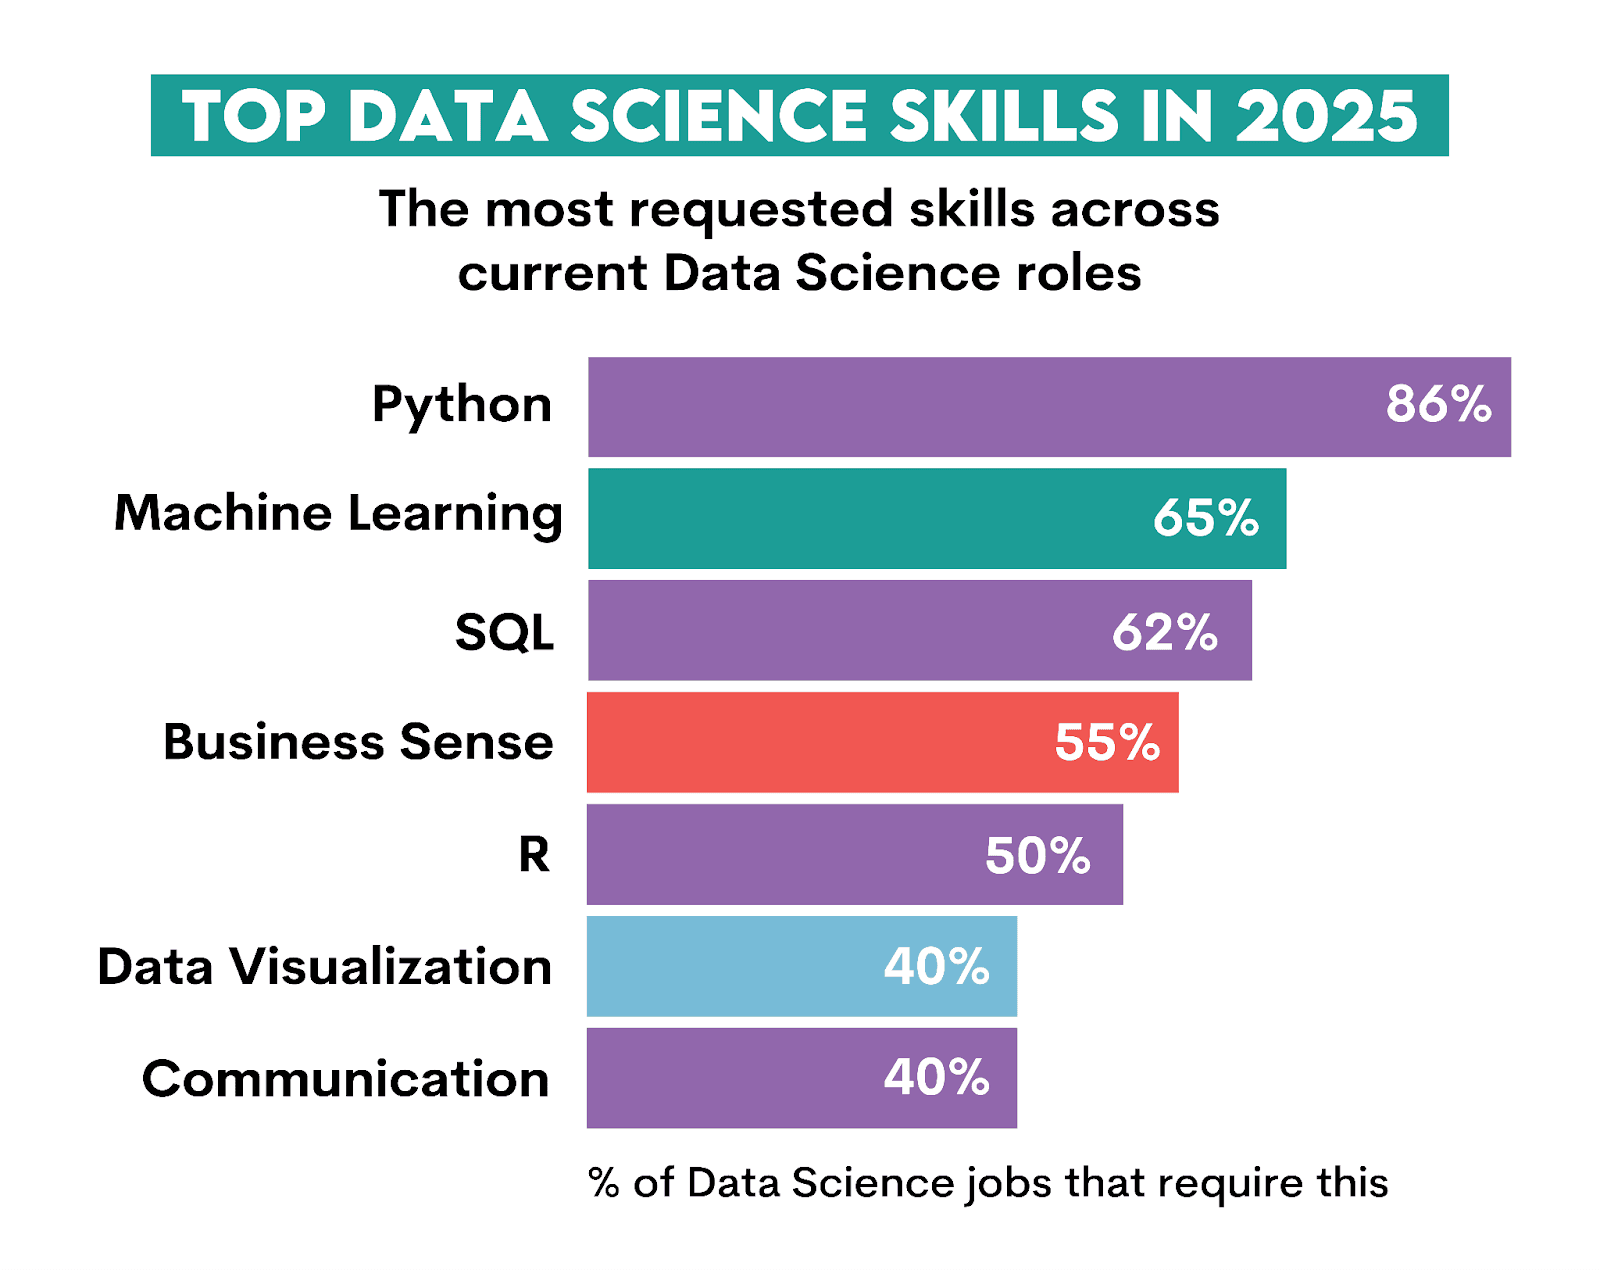
You could argue that this is old information. However, analysis by Dawn Choo shows similar development. Her analysis of LinkedIn job postings in 2025 – albeit a relatively small sample of 101 – shows Python is the most required data science skill, appearing in 86% data science job postings.
R comes fifth, with mentions in 50% job ads.
Another, rather primitive but very relevant, approach that proves Python’s popularity over R is a job search on Glassdoor. If you type “data scientist python” in its job search, it returns 4,812 job ads in the United States. Now, type “data scientist r”, and it will return 2,490 job postings; almost 50% fewer than Python.
Whenever you do that search, I guarantee that there will be significantly more jobs for Python than for R.
Which Language Has a Bigger Community and Better Job Opportunities
Verdict explanation:
Python wins because it’s adopted widely across a variety of industries and roles. This also makes it a sought-after skill, as reflected in numerous data science job postings that require Python proficiency. The community size also makes it easier to learn and find support.
R has a smaller but still strong community, especially as R keeps being used extensively in statistics-heavy fields, such as healthcare, finance, and academic research. However, it offers relatively fewer job opportunities compared to Python.
Here is a verdict breakdown.

The Ultimate Winner: Which Language is Better for Data Science
We’ve compared Python and R across five important data science categories. Now the time has come to pronounce the ultimate winner…AND THE WINNER IS…PYYYTHOOOOON!

In this ultimate fight, Python won in three rounds, while R won in two.
Recent Trends
The use of Python and R is impacted by these four main current trends.
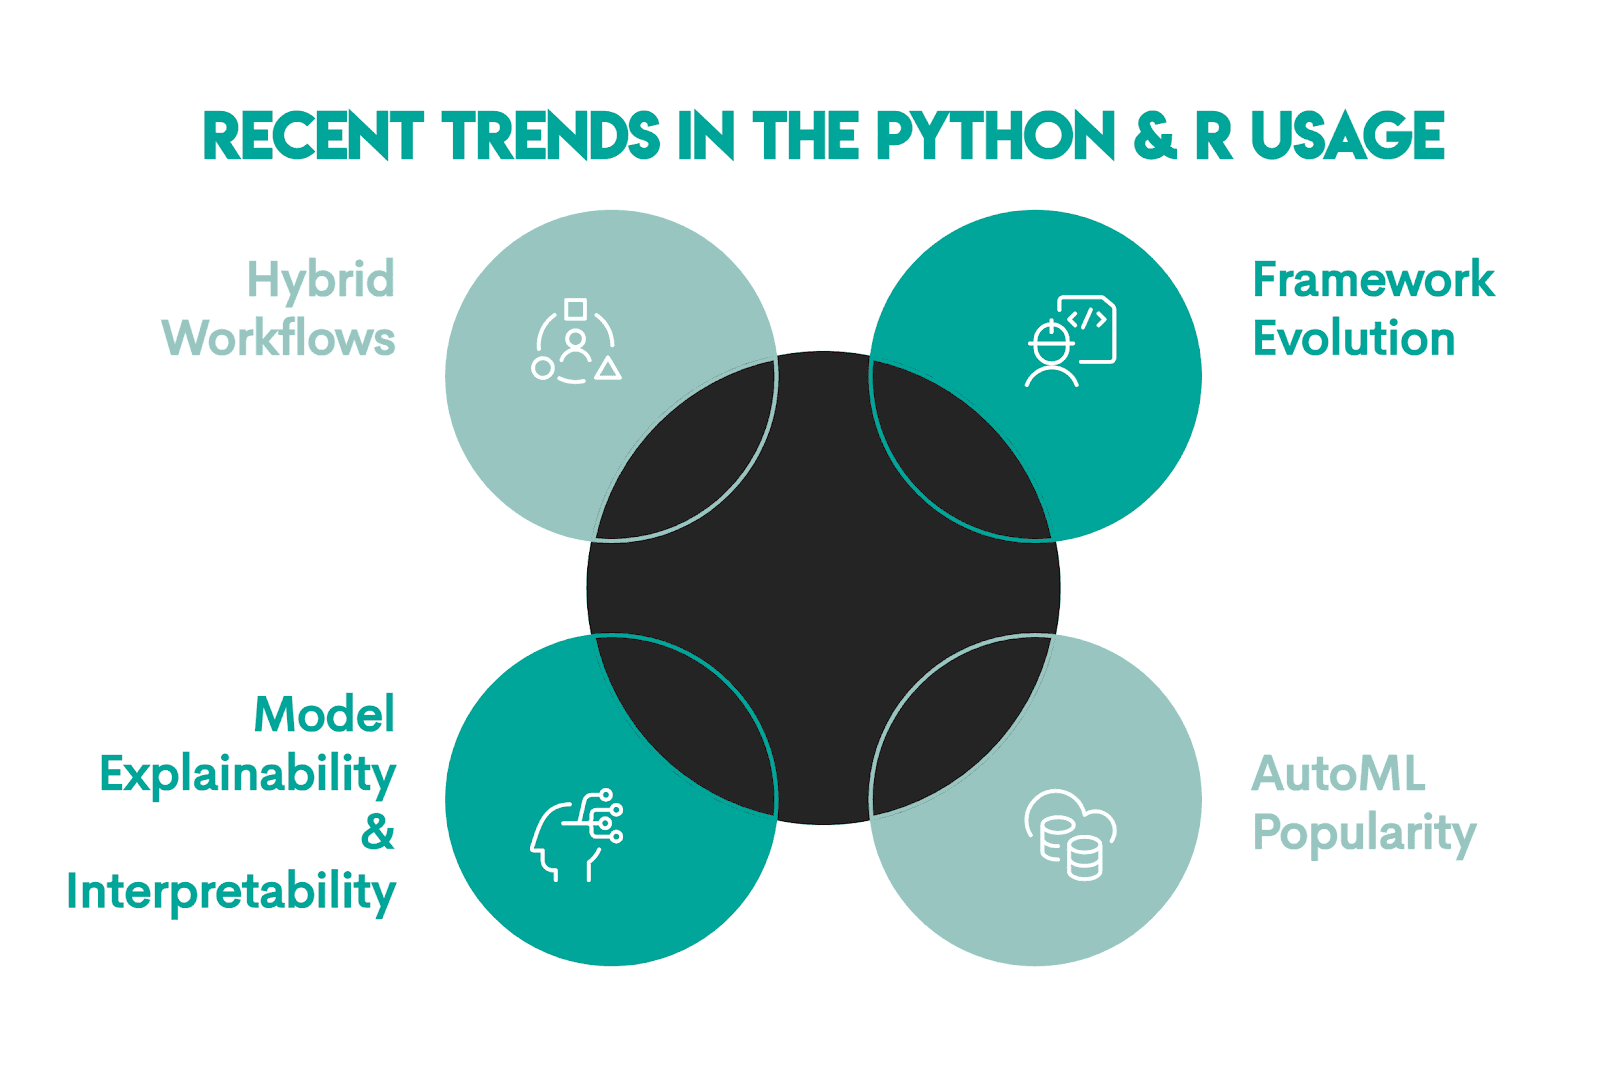
Framework evolution: The evolution of deep learning libraries (e.g., TensorFlow, PyTorch, scikit-learn), LLM tooling (e.g., Hugging Face Transformers, spaCy, OpenCV), and end-to-end ML platforms (e.g., H2O, Ray) has overwhelmingly favored Python. This further strengthens Python’s position in data science, especially in applied machine learning, experimentation, and production systems.
AutoML tools: There’s an increase in the popularity of automated machine learning (AutoML). It reduces manual work in ML, particularly in feature engineering and hyperparameter tuning. While statistical understanding remains important, AutoML shifts the emphasis of the ML workflow to orchestration, evaluation, and deployment. This is already Python’s strength.
Popular AutoML tools are:
Model explainability and interpretability: Machine learning is being applied more widely than ever and in increasingly impactful ways, so the ability to explain and interpret ML models has become essential. This is especially true in more regulated and high-stakes industries, such as healthcare, finance and banking, public policy and government, or hiring and HR analytics. Nowadays, explaining a model’s behavior is a standard feature in an ML workflow.
R naturally fits in here, due to its emphasis on interpretability and statistical transparency. Python is quickly catching up with its continually expanding tooling.
These are popular explainability and interpretability tools:
Hybrid workflows: Workflows that use both Python and R are becoming increasingly common. That way, you can get the best from both. Use R for exploratory analysis, statistical modeling, and reporting. When you get to machine learning, deployment, and scaling, switch to Python. You can manage interoperability through shared file formats, databases, and containerized environments.
What Support & Learning Resources Are Available?
Both languages have garnered substantial support from communities such as Stack Overflow, Stack Exchange, and GitHub.
Social media sites such as YouTube, Reddit, and X/Twitter are also fantastic resources for help and learning. You can find tutorials, walkthroughs, and discussions there.
There are multiple specialized subreddits:
- r/Python – offers assistance for Python users and learners
- r/datascience – data analysis, ML, workflows
- r/Rlanguage – assistance for R users and learners
- r/statistics – applied statistics discussions
- r/MachineLearning – ML-focused help, mainly for Python
In addition, each language has its own proprietary and official forums available. Python’s community forums offer boards for libraries, general support, new ideas, and other options. The Posit Community Forum (formerly RStudio Community) has a proprietary discussion board for help with R and package development.
Learning Python & R
The consensus is that Python is easier to learn than the other, especially for those with a programming background and familiarity with object-oriented languages.
Its syntax was modeled on natural language, making it easier to learn and to code.
R, being a functional language, is not as intuitive for learners coming from general-purpose languages. On the other hand, those with a statistics background might find it intuitive once they understand the analysis workflow and the packages.
There are extensive online learning resources for both languages. Here are several popular options for learning:
- Posit (ex RStudio) – official tutorials, primers, and documentation for R
- Python.org – official Python tutorials and guides
- YouTube – you can find many walkthrough videos, coding examples, and full courses, e.g., R Tutorial for Beginners 2026 by Simplilearn or Python Full Course by Bro Code
- StratScratch – real analytical interview questions (both R and Python), along with algorithm and data visualization questions + data projects (all in Python)
- Coursera, edX, Udacity – structured, highly valued courses for both Python and R
- freeCodeCamp – free Python, data analysis, and machine learning tutorials
- Kaggle Learn – courses and coding exercises for learning Python and machine learning
- Books – For example, R for Data Science or Python Data Science Handbook
Conclusion: Future Outlook & Which Language to Learn
I think the clue is already there in hybrid workflows. Both languages will stay important, each for the area where they demonstrate their strengths.
Which one should you learn, then? Both, ideally! That’s the case especially if your work means end-to-end involvement in the data science cycle.
Otherwise, learn Python if your focus is production. If analysis is your focus, learn R.
Share