Python Data Science Interview Questions


Categories:
 Written by:
Irakli Tchigladze
Prepare for a data science interview by studying this comprehensive list of Python questions with answers. Includes coding as well as theoretical questions.
Data science is a well-paid and meaningful career. To maximize their chances of success, data scientists maintain a rich set of skills like Python, SQL, R, and other tools for working on data science projects.
One way to improve your odds of landing a data scientist job is to have an in-demand data science technical skill like Python. It is one of the main programming languages used for data science, because it is simple, readable, and supports external libraries.
Data scientists use Python for statistics and mathematical calculations. It is widely used for Machine Learning, specifically for writing Natural Language Processing and sentiment analysis algorithms. It’s also possible to write Python algorithms to analyze medical images and help detect and prevent fraud.
Python is not the only language used for data science. R is another popular programming language for working with data. To learn about differences between Python and R, read our comparison article Python vs R for Data Science.
Python is considered a simple programming language, but it has a lot of features to remember. Supporting libraries like pandas can further enhance its capabilities. We compiled a list of python data science interview questions to help you remember and practice everything you need to know before going into the interview.
Basic Python Data Science Interview Questions

Let’s start with the simplest python data science interview questions. Interviewers use these questions to measure a candidate's knowledge of Python and their ability to write code.
Non-coding Python Data Science Interview Questions
Writing Python code is important, but knowing its underlying principles is just as important. Usually interview questions are basic. For example, what are variables in Python and how to use them for data analysis.
Let’s look at some questions asked of candidates during actual interviews:
Question #1: Data structures in Python


This python data science interview question was asked during an interview with Walmart. The easy answer is to list data structures in Python: list, set, tuple, dictionary.
It’s great if you can describe the characteristics and features of each data structure and explain differences between them. For example, a list can contain many different types of values and can be mutated, whereas tuples are an immutable pair of two values.
For a detailed answer, check out the ‘Solution Discussion’ section of this question on StrataScratch. Link is given above.
Question #2: Difference between sorted(somelist) and somelist.sort()


Link to the question: https://platform.stratascratch.com/technical/2115-python-list
This question comes from the General Assembly, and it is a good indicator of a candidate's depth of knowledge of Python.
The short answer is that the sorted(list) function results in a new list with sorted values, whereas somelist.sort() sorts the original list in place, keeping its identity.
Refer to the ‘Solution Discussion’ section of this question on StrataScratch platform to get a detailed breakdown of differences between two functions.
Question #3: Memory Stored and Retrieved in Python’s Dictionary


Link to the question: https://platform.stratascratch.com/technical/2091-python-dictionary
Dictionaries in Python store information as key-value pairs.
person = { 'age': 24, 'firstName': 'George', 'lastName': 'Smith' }We can retrieve a value of a specific key using square brackets - person[age], which would retrieve the value of ‘age’ key. Be prepared to answer similar questions. For example, to explain dictionary comprehension in Python.
To better understand how Python dictionaries store data, check the ‘Solution Discussion’ section of this question on the StrataScratch platform.
Question #4: Identifying Missing Values in a Data Set


Link to the question: https://platform.stratascratch.com/technical/2254-missing-values-in-data-set
The easiest way to identify missing values is to use df.isnull() or df.isna() functions, available for Pandas dataframes. We can check the entire dataset using the df.isnull.values.any() function, which returns true if there are missing values, and false if there are none.
For a more detailed answer, check the ‘Solution Discussion’ section on StrataScratch platform.
Question #5: Generate a sorted vector from two sorted vectors


Link to the question: https://platform.stratascratch.com/technical/2104-sorted-vectors
Experience and knowledge of list comprehension in Python can help you easily answer this question.
First, create a new array with the combined size of the first and second arrays. Then write a function that goes over arr_1 and arr_2 simultaneously, determines which is the smaller number from two arrays and adds it to the new array. And continues doing this until the end.
You can look at the actual code on the ‘Solution Discussions’ section on StrataScratch platform.
Coding Python Data Science Interview Questions
In the process of interviewing for a job, aspiring data scientists have to solve coding challenges as well. It’s a good idea to get used to writing Python code.
Follow these steps to easily solve even the most difficult questions:
1. Understand the question
Before answering the question, make sure you completely understand it. For example, what columns need to be returned and other details for solving the question.
When dealing with difficult questions, read them multiple times to wrap your head around them.
If you did your best to understand the question but some things are still unclear, ask the interviewer for clarification.
2. Analyze data
Looking at available table(s) can help you come up with a logical solution. Once you completely understand the verbal or written description of the question, look at the table and find columns that contain values that you’ll use in your calculations.
To get the general idea of columns and values contained in them, look at types of values in each column. It will tell you if you need to convert values in certain columns.
3. Plan your approach
Once you completely understand the formulation of the question and available data, you can start solving it. In theory, you can start writing Python code right away, but there’s a better approach.
We recommend you to think about the problem in logical steps. Think of all the operations and calculations you need to perform to go from available data to the final answer. Then write down these logical steps and important details for each step.
Python data science interview questions are usually very complex. One remedy is to organize your thoughts on paper. This way, you’ll find it much easier to follow along and write the code for each step.
4. Write code
Think about what Python features your solution is going to use. Import all necessary data science libraries like numpy and python.
If you’re confused about chaining multiple functions together, create variables to store the result of each function call.
Start with a basic solution, and gradually add complexity to it. Output the code to see if incremental changes have the desired effect.
Question #6: Expensive Projects
Let’s start off our list of coding challenges with this simple question from Microsoft. As always, finding the right answer comes down to paying attention to data, and laying out logical steps for solving the question.


Link to the question: https://platform.stratascratch.com/coding/10301-expensive-projects
Understand the Question
To get the answer, we have to calculate the average share of the budget allocated to each employee.
The question tells us to output project title, budget per customer and arrange numeric values in an ascending order.
Analyze data
It is not practical to start writing Python code before you completely understand the available data.
Answering this question requires you to work with two tables - ms_projects, which contains information about projects and ms_emp_projects which stores details of each employee.
First, let’s look at type of values in every column of available data:


Looking at actual data in the table can be even more illustrative and help you put this into context:
ms_projects table:
The id column contains numbers to identify each project. The title column contains names of each project, and the budget contains the total budget for each one.
ms_emp_projects table:
This emp_id column is simply a list of numbers to identify each employee, and the only other column is used to specify the project that the employee is assigned to.
Plan your approach
To answer this question, we need to calculate the budget-to-employee ratio and arrange the final list in a specific order.
Since information about projects and employees are split in two tables, we will have to combine them.
Next, we need to find the number of workers per project. We use the same principle as in SQL - create groups of employees who work on the same project, and then get the number of employees in each group.
We can calculate the budget per employee ratio by dividing the budget by the number of employees assigned to each project.
Finally, we need to arrange rows so that those with the highest budget per employee come first, followed by lower values.
Write Code
Let’s translate our logical approach into Python code.
Step 1: Combine data from two tables
We use the merge() function from Pandas library, which is the alternative to JOINs in SQL. It allows us to combine data from two dataframes.
We use the ‘on’ keyword to specify the shared dimension between two data sets and the ‘how’ keyword to tell Python what to do with records that don’t have matching values.
import pandas as pd
import numpy as np

df=pd.merge(ms_projects, ms_emp_projects, how = 'inner',left_on = ['id'], right_on=['project_id'])
Step 2: Aggregate the number of workers per project
In this step, we use the groupby() function to create groups of employees working on different products. We use the size() function to get a total number of employees in each group. This function in python works similar to the count() aggregate function in SQL.
df1=df.groupby(['title','budget'])['emp_id'].size().reset_index()Once we have calculated the number of employees for each group, we use the reset_index() to go back to default behavior. By default, each row in a dataframe is assigned a numeric index to identify it.
Step 3: Calculate budget-per-employee ratio
We created a new property called ‘budget_emp_ratio’. We calculate values for this property by dividing the values in the budget column by the total number of employees.
df1['budget_emp_ratio'] = (df1['budget']/df1['emp_id']).round(0)Note that in the previous step, we aggregated values in the emp_id column for each group. So the emp_id column now contains a total number of employees.
We also round the result of this division to the nearest whole number.
Step 4: Output ordered values
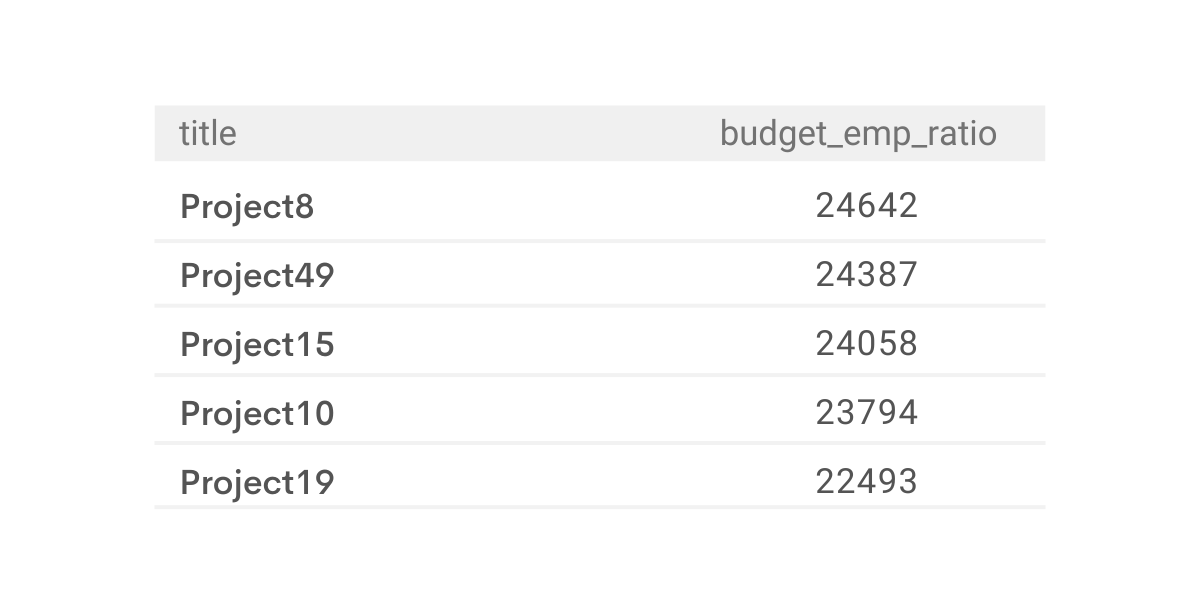
Next, we use the sort_values() function to arrange budget_emp_ratio values in a descending order (from highest to lowest), and output them as well as project names in the final result.
df2=df1.sort_values(by='budget_emp_ratio',ascending=False)
result = df2[["title","budget_emp_ratio"]]
Here is what our final solution looks like:
import pandas as pd
import numpy as np

df=pd.merge(ms_projects, ms_emp_projects, how = 'inner',left_on = ['id'], right_on=['project_id'])
df1=df.groupby(['title','budget'])['emp_id'].size().reset_index()
df1['budget_emp_ratio'] = (df1['budget']/df1['emp_id']).round(0)
df2=df1.sort_values(by='budget_emp_ratio',ascending=False)
result = df2[["title","budget_emp_ratio"]]
Output
The widget allows us to run our code, see the output and check if it’s the right answer.
Our output exactly matches the expected output, so it is accepted as correct.

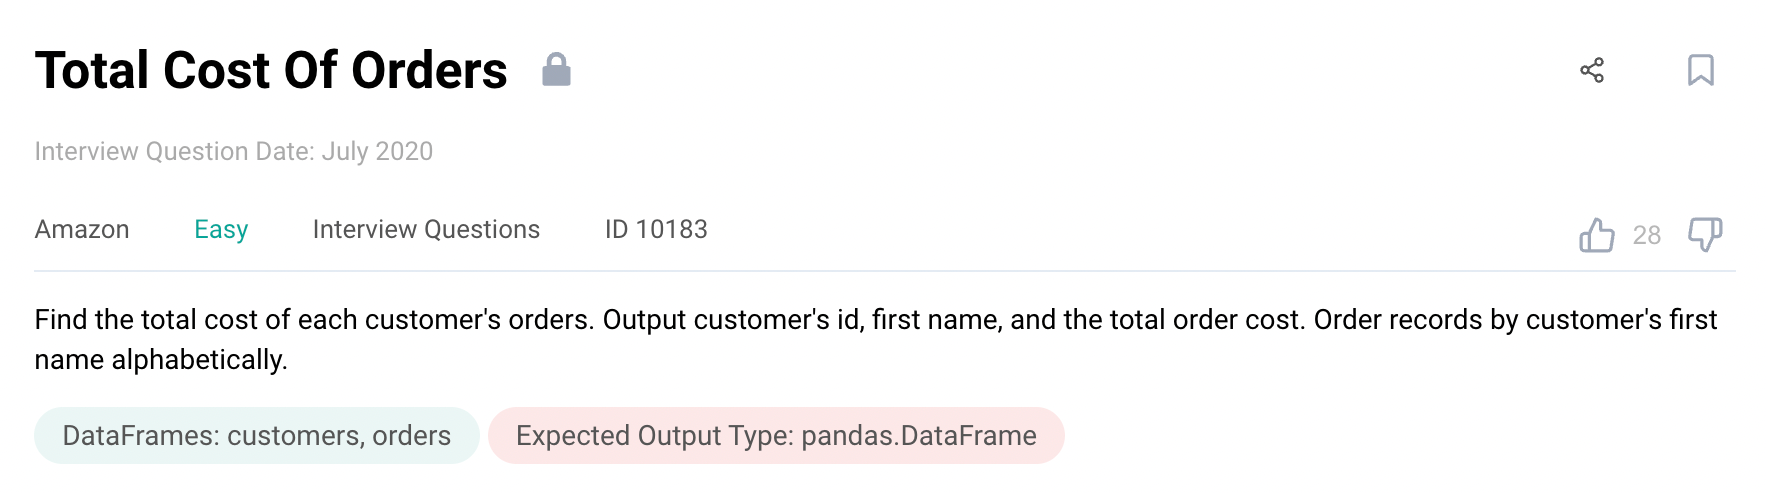
Question #7: Total Cost Of Orders
A prime example of a Python data science interview question where a candidate has to use functions from pandas and numpy libraries to get the answer.

Link to the question: https://platform.stratascratch.com/coding/10183-total-cost-of-orders
Understand the question
We are asked to calculate the total of values in a certain column. Another condition is that we calculate the total for each different user.
Question description tells us to output the id, first_name, and aggregate total_order_cost. It also specifies the way to order records.
Analyze data
Let’s take a quick look at the types of columns in two tables. You might need to change the type of data, or use specific functions depending on type of data.

The customers table contains typical information to describe each customer - their name, location, and contacts.
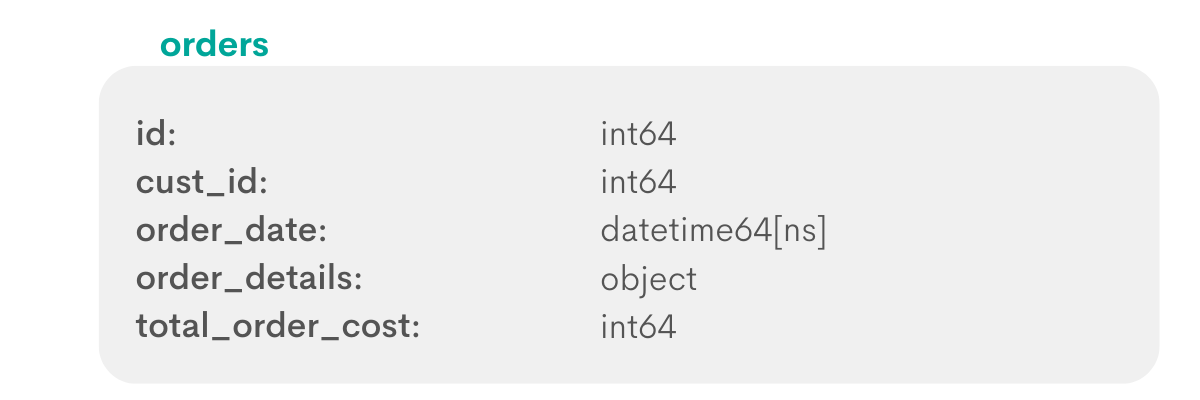
Each record in the orders table stores information like a unique identifier for each order, identifier for customer who placed the order, order date, description, and cost.
One important detail is to notice the cust_id column of the orders table. Values of this column reference the identity of each customer, stored in the id column of the customers table.
Next, look at actual tables filled with data:
customers table:
orders table:
We must aggregate dollar values of each customer’s orders, stored in the total_order_cost column of the orders table.
Plan your approach
Solving questions like this one requires a thorough understanding of simple concepts like variables in Python, as well as knowledge of merge(), groupby() and other functions from the pandas library.
We need data from both tables to aggregate the value of orders placed by individual customers. Then we create a group of rows for each individual customer to store the information about orders placed by each order.
Finally, we need aggregation Python functions to calculate the total of values in each group.
Write the code
For more discussion about different approaches to the question, check out the question on our platform.
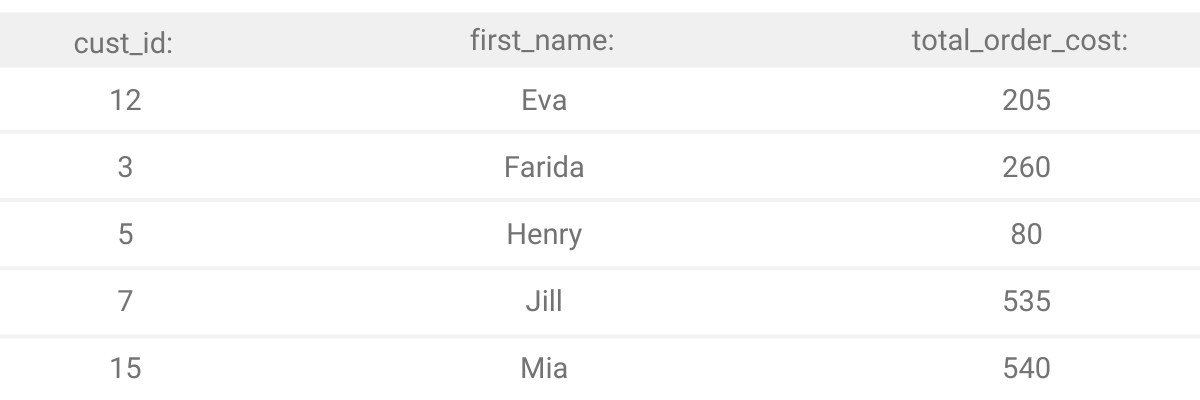
Output
Question description says the output should be these three columns, with customer’s first names arranged alphabetically.
Intermediate Python Data Science Interview Questions

Now let’s look at python data science interview questions that are a bit more complex. You might have to answer these if you’re interviewing for a middle data analyst or similar data scientist role.
Question #8: Distances Traveled
This is a question from Lyft, where you have to find 10 users with highest distance values.


Link to the question: https://platform.stratascratch.com/coding/10324-distances-traveled
Understand the question
The conditions for this python data science interview question are fairly clear. We need to find users with TOP 10 distance traveled, and output three following columns: id, name, and distance.
Analyze data
In this question, available data is stored in two tables. We need to work with data from both tables to arrive at the final answer.
First, let’s look at the type of values in each column. First, is the lyft_rides table, that contains information about rides booked through Lyft app:
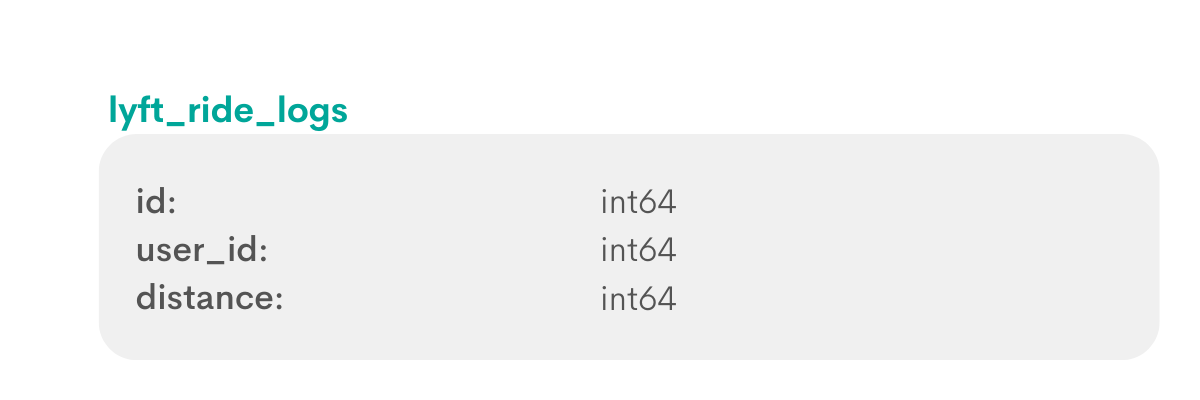
The second is lyft_users, which stores information about users of the app:

The user_id column of the lyft_rides_log table identifies the customer who booked the ride. One user might’ve booked multiple rides, so it’s safe to assume that this column can have duplicate values.
User ids and their names are stored in the lyft_users table.
It would help to look at actual data in these two tables:
lyft_rides_log table:
lyft_users table:
Look at the fifth row in the lyft_rides_log table. Its user_id value is 1, which we can look up in the lyft_users table to get more information about the user. In this case, we can find out their full name, which was not available in the lyft_rides_log table.
Plan your approach
Breaking down any coding challenge into a few manageable steps can help you avoid errors.
To get full information about users and the rides they booked through the app, we’ll have to combine two tables into one.
Next, we need to separate rides into groups, one group for each unique user who ordered the ride. Then we can add up distances for each user.
Once we aggregate distances for each user, then we need to rank groups based on this value.
The final step would be selecting users with TOP 10 ranks and returning the specified columns.
Write the code
To solve this question, we will need Python functions to combine data, group values and rank rows based on values in a specific column.
Step 1: Combine data from two tables
We can use the merge() function to combine data from two tables.
import pandas as pd
import numpy as np

df = pd.merge(lyft_users, lyft_rides_log, left_on='id', right_on='user_id')
Step 2: Aggregate miles traveled and arrange data
We can use the groupby() function to create groups of rows based on the user's identity.
We also need the sum() aggregate function to add up all distance values for each group.
Then we use the sort_values() to arrange values in a descending order.
result = df.groupby(['user_id', 'name'])['distance'].sum().to_frame().sort_values(by = 'distance', ascending = False).reset_index()
We use the to_frame() function to convert series values to a dataframe. This is necessary to chain the sort_values() function to order rows.
Step 3: Rank rows based on their distance
Next, we create a ‘rank’ column and use the rank() function to generate values for it. We determine the rank based on values in the ‘distance’ column of each row.
result['rank'] = result['distance'].rank(ascending = False)Step 4: Return the final output
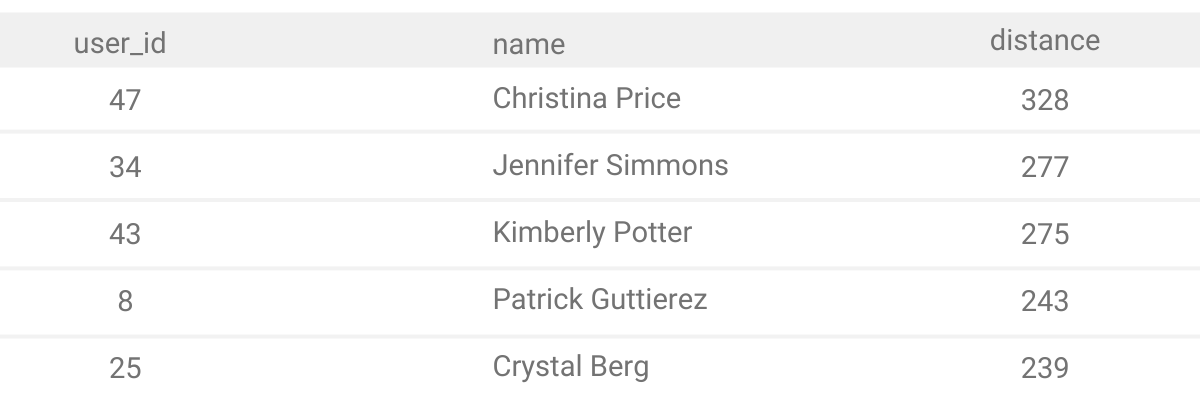
We set the condition to select values with 10 highest values in the distance column, and output ‘user_id’, ‘name’ and ‘distance’ columns.
result[result['rank']<=10][['user_id', 'name', 'distance']]And the final solution:
import pandas as pd
import numpy as np

df = pd.merge(lyft_users, lyft_rides_log, left_on='id', right_on='user_id')
result = df.groupby(['user_id', 'name'])['distance'].sum().to_frame().sort_values(by = 'distance', ascending = False).reset_index()
result['rank'] = result['distance'].rank(ascending = False)
result[result['rank']<=10][['user_id', 'name', 'distance']]
Output
Running our final solution will return the right output:
Question #9: Spam Post
Facebook interviewers ask this question to test a candidate's ability to write Python code. More importantly, this question can be useful to check their ability to pay attention to details.


Link to the question: https://platform.stratascratch.com/coding/10134-spam-posts
Understand the question
Read the question multiple times to properly understand the task at hand. Also, the question explains what constitutes a spam post, and how to identify such posts in available data.
Analyze data
Looking at the type of values in each column can help you form a first impression about available data.


facebook_posts seems to be the main table that contains most of the information, except for the viewing data.
If deemed necessary, you can access the viewing data for each post by cross-checking the post_id values. Both tables share this column.
Let’s preview these two tables with actual data:
facebook_posts table
facebook_post_views table:
Plan your approach
First, you should find facebook posts that can be classified as spam. As per question description, we need to look at values in the post_keywords column of each row to see if it contains the word ‘spam’.
We also need some way to calculate spam posts. One way is to create a new column and store 1 if the post is spam, and 0 if it’s not. For that, we need to apply a function on values in the ‘is_spam’ axis. We can use the apply() function from pandas library to do this. It takes one argument, a lambda function that assigns 0 or 1 depending on classification of the post.
In case you don’t know, Lambda function is just a shorter syntax to define a function. Usually useful for simple one-line functions.
Next, we can add up values in the new is_spam column and calculate the share of such posts compared to the total number of posts. It’s a simple calculation of percentage, where you divide one number by another and multiply the result by 100.
To calculate the share, we need to store the total number of spam posts and the number of all posts. Once calculated, we can discard those two columns and output date and share of spam.
Write the code
Try to write the solution yourself in the widget below:
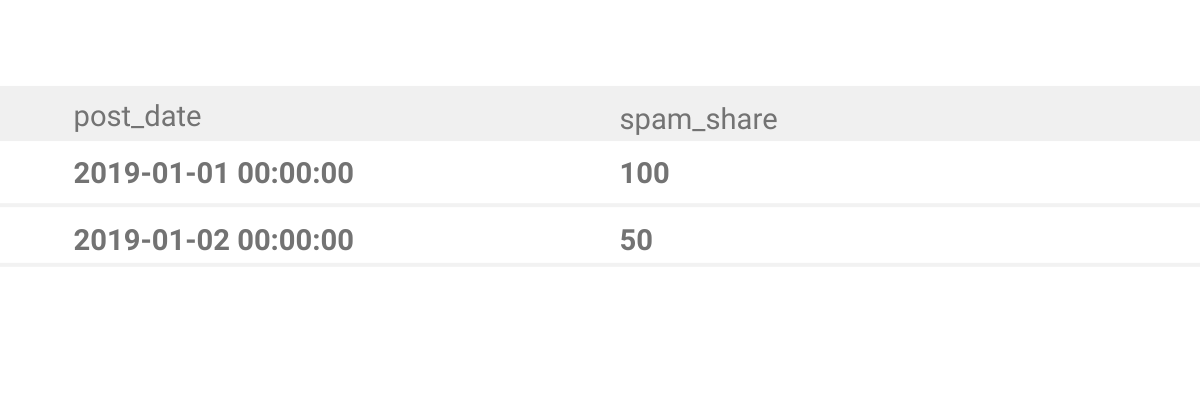
Output
Final answer should contain these two columns:
Question #10: Cities With The Most Expensive Homes
This is a question from Zillow, a platform where you can browse home listings.


Link to the question: https://platform.stratascratch.com/coding/10315-cities-with-the-most-expensive-homes
Understand the question
Premise of this python data science interview question is fairly clear. Interviewers expect you to output cities where homes are on average more expensive than national average price.
Analyze data
To solve this question, we need to work with just one table, which contains the listing id, the state, city, and address of the property, and its market price.
First, let’s consider the types of values in the column:
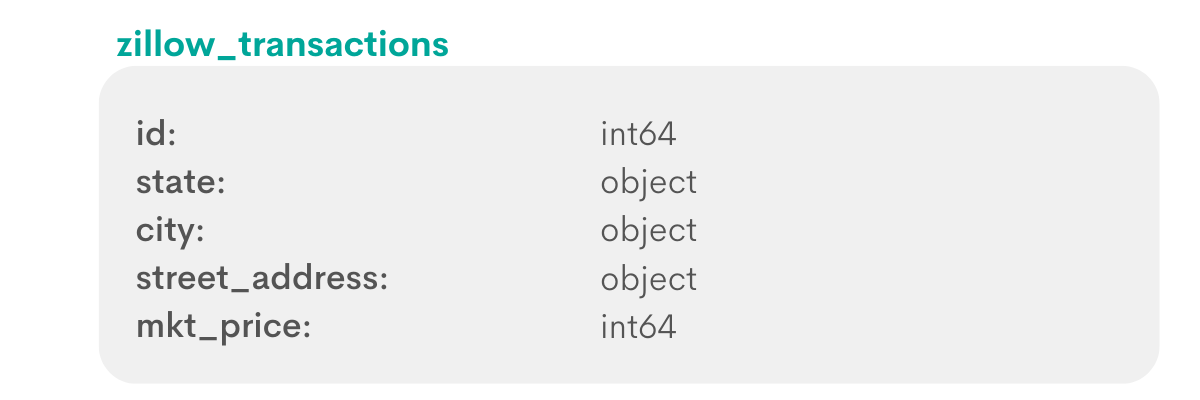
Column names for this table are descriptive. It’s safe to assume that the id column identifies each individual property listing on the platform. Whereas state, city and street_address denote its location. The mkt_price table stores an integer value for the price of the property in dollars.
As for value uniqueness, it’s safe to assume that the city and state columns can contain duplicate values. However, values in the id identify each individual property and must be unique.
Next, let’s look at the actual zillow_transactions table:
Looking at the available data confirms our assumptions were correct.
Plan your approach
The first step is to find an average price of properties in each city. Each record in the available table describes every individual listing, but does not show information about average prices for each city.
However, we can use the mean() function from numpy library to aggregate individual listings and find the average price of homes for each city. We can do the same to find the average price of all homes in the country.
Finally, we will compare two averages and output the cities that are higher than the national average.
Write the code
Try to write the solution in the widget below:
Output
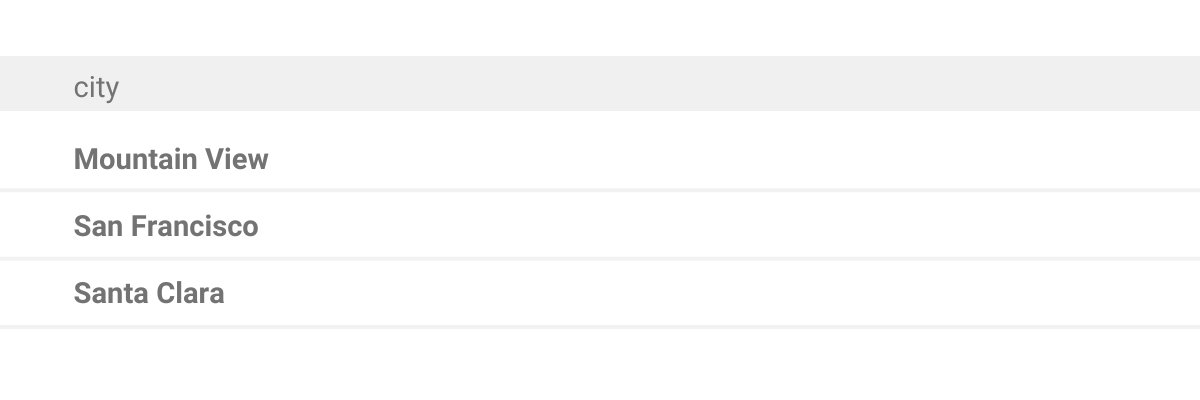
As per the question description, the output should be a list of cities that satisfy the criteria.
Advanced Python Data Science Interview Questions

Finally, let’s see some examples of the most difficult python data science interview questions. You are more likely to encounter these questions when interviewing for senior positions.
Looking at available data can help you understand these difficult questions. Before attempting to solve it, read the question premise multiple times to wrap your head around it. Then think about the solution and how to translate it into Python code.
Question #11: Days At Number One
If you do end up working at Spotify, you might be assigned to similar tasks. For example, to make statistics about each song, or do accurate data analysis for recommendation engines etc.

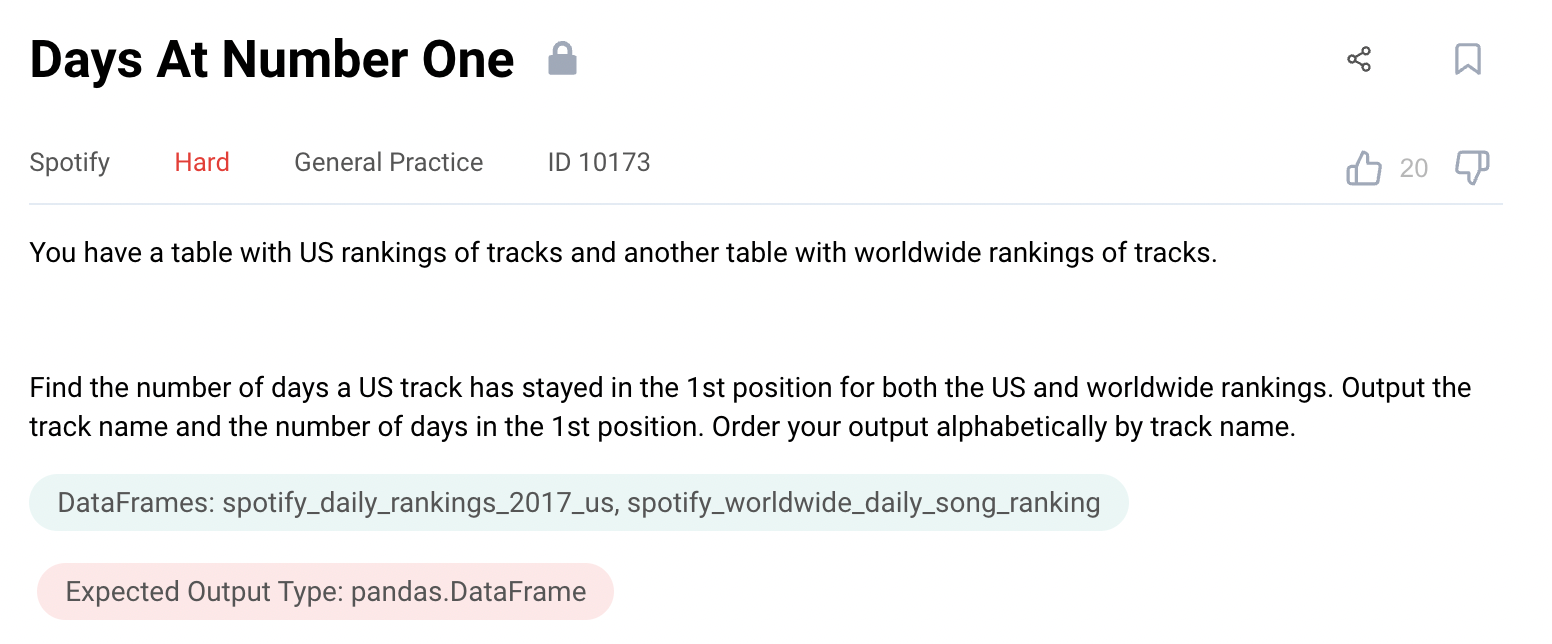
Link to the question: https://platform.stratascratch.com/coding/10173-days-at-number-one
Understand the question
First, let’s understand the task at hand. We are asked to find out how long each song spent in the number one position on Spotify, both on international and domestic rankings.
Analyze data
Looking at data can help you get in the mindset for solving the question.
First off, look at the question description and find the columns that contain important values for calculations.
For this question, we have two tables with many columns, so it might take a while to find important values.

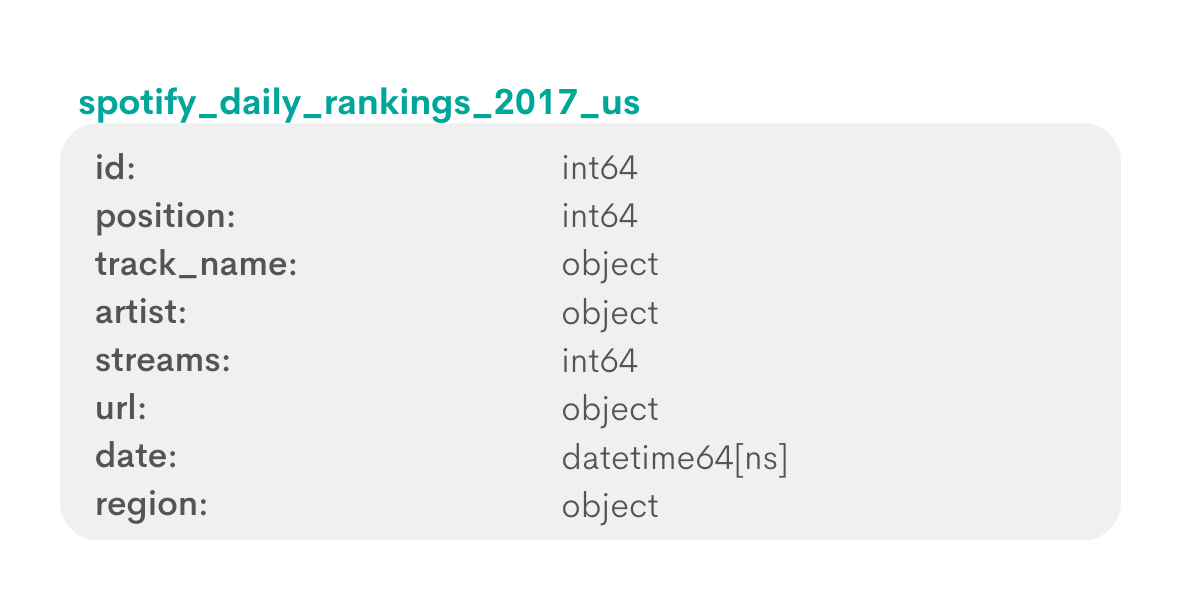
Now that we have a general idea about values in each column, let’s look at actual data.
Pay attention to position, trackname and date columns in spotify_daily_rankings_2017_us table:
The same values are available in the spotify_worldwide_daily_song_ranking table:
One thing is clear - we will have to work with date values to find time differences between them.
Plan your approach
Being able to break down the question into a few easily manageable steps can help you write error-free code, even if you are writing outside of a code editor, like on a whiteboard, or a piece of paper.
We have to track song rankings on both domestic and international charts, so we should combine two tables.
Question clearly states that we need to count the number of days each song spent in the number one position. We need to find instances when a record satisfies number one position both for the US and worldwide.
The next step is to create a column to store the number of days each individual song has stayed as number one both in the US and worldwide.
Finally, we must output the highest number of days each song lasted in the number one position.
Write the code
Step 1: Combine data from table
Pandas library provides a merge() function which combines data from two tables, similar to JOINs in SQL.
import pandas as pd
import numpy as np

merged = pd.merge(spotify_daily_rankings_2017_us,spotify_worldwide_daily_song_ranking, on = ['trackname','date'])
We can use the second parameter to specify the columns that are common between two tables.
Tables we merged have many columns with identical names. When merged, all of these columns will be combined into one table. Since columns in one table can not have identical names, they will be assigned a suffix.
For example, the position column from the first (left) table will become position_x, whereas the position from the second table will become position_y.
Step 2: Find songs that satisfy the condition
This question has a very clear condition - we need to find instances when a US track has stayed on number 1 on both domestic and international spotify rankings.
We create the top1 variable to store all records of number one songs in the US. We achieve this by checking the values of the position_x column, which contains values of the position column that stores all records of number one songs in the US.
top1 = merged[merged['position_x'] == 1]
top1['world_position'] = (top1['position_y'] == 1).astype(int)
Then we take values where the value of position_y column is 1, and store them as integers in a new column called world_position.
Don’t forget that position_y values are the values of the position column in the worldwide ranking table.
We need to use the astype() function to ensure that values are stored as integers. Later on, we will calculate the sum of values in this column.
Almost all of the functions mentioned above are from the Pandas library. Read this article to better understand why and how to import Pandas as pd in Python.
Step 3: Calculate the number of days
We use the groupby() function to get unique groups for each value in the trackname column. In other words, create an arbitrary group of records for each song. Finally, calculate the aggregate sum of values in the world_position column for each group and store it in the ndays column.
We use the transform() function to calculate the total number of days. It works similarly to window aggregate functions in SQL. It calculates the total value in the world_position column for each group, and stores the total in a new column. Unlike normal aggregate functions, transform does not collapse all records into one.
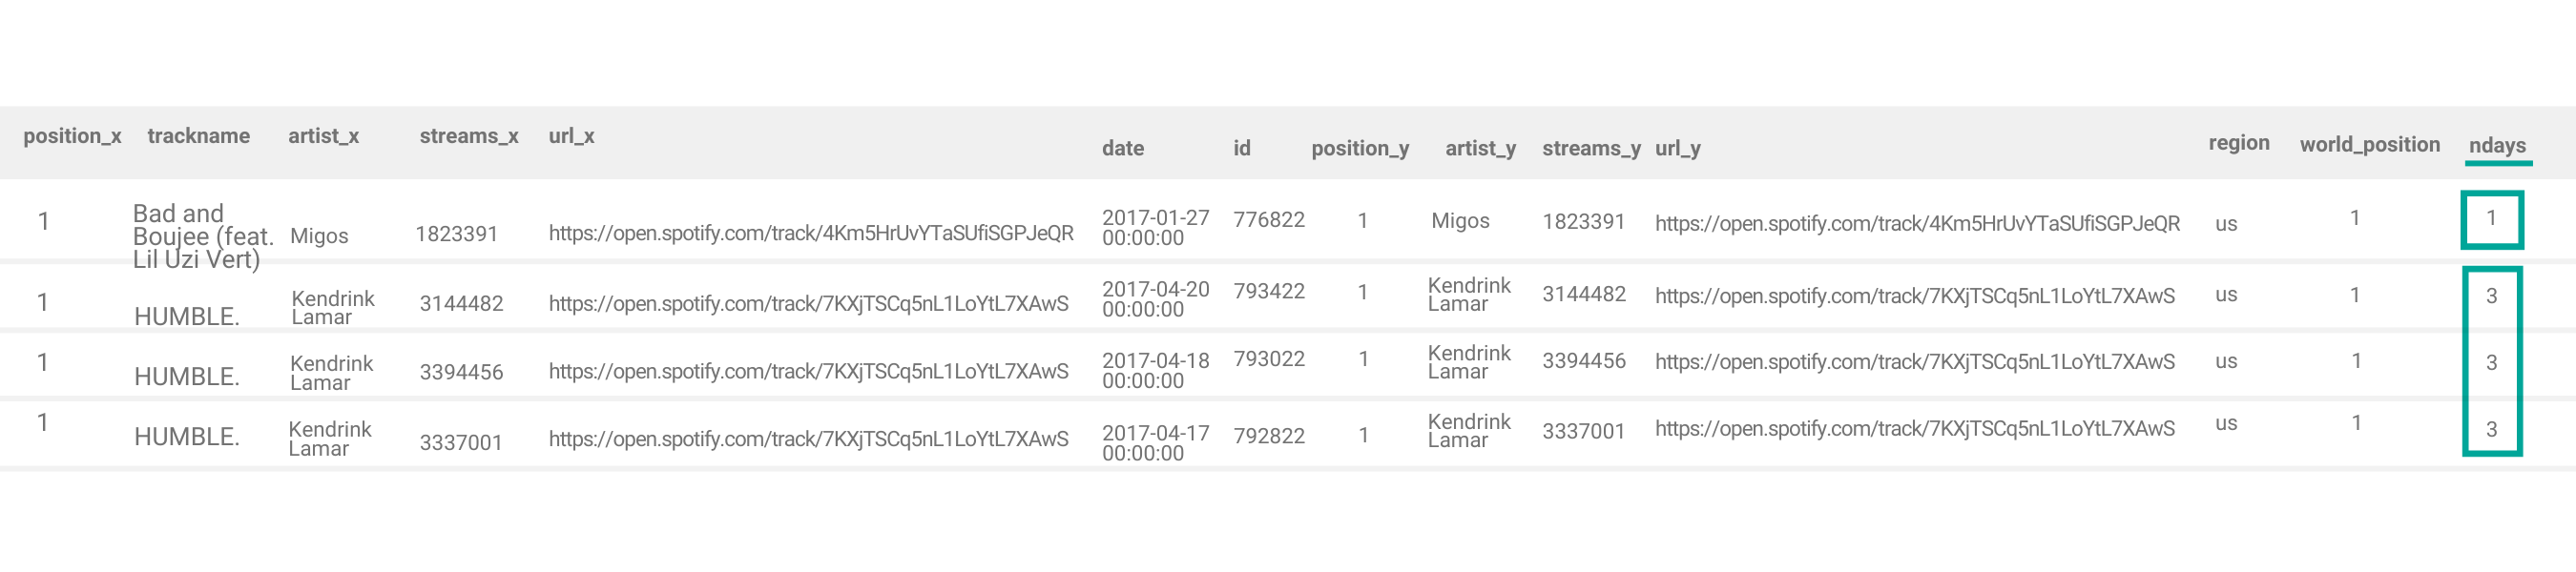
top1['ndays'] = top1.groupby(['trackname'])['world_position'].transform('sum')This step is easier to understand if we look at the actual table before we apply transform() function on it:

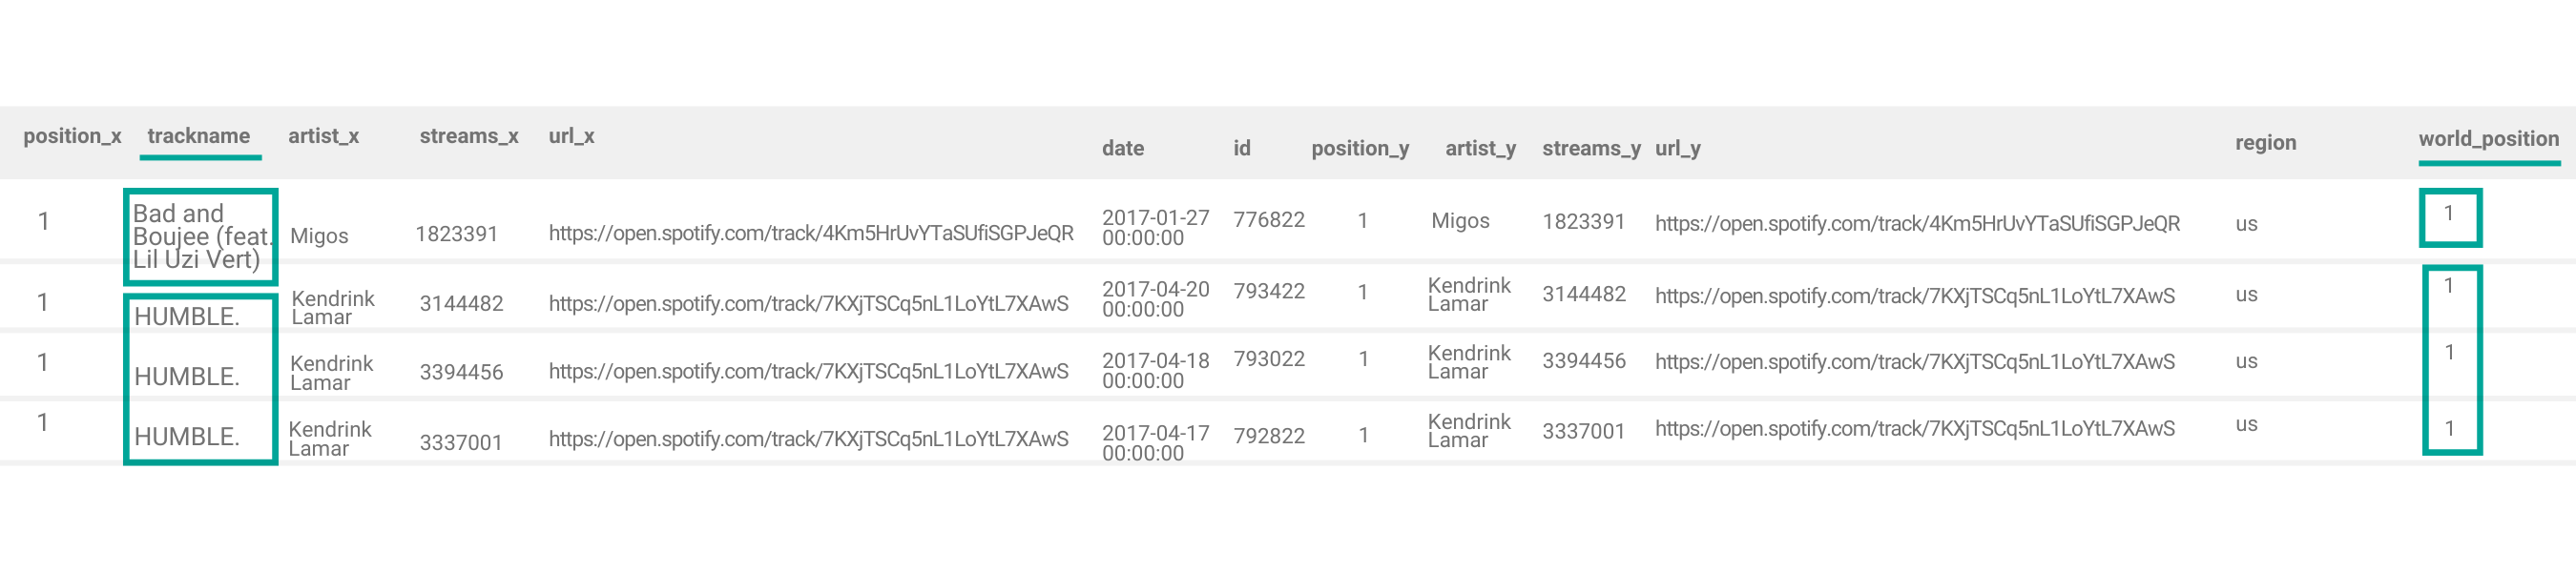
Python will look at values in the trackname column, and separate rows into two groups, one for each distinct value in this column. For each group, it will add up values in the world_position and store them in the ndays column.
Step 4: Order songs alphabetically
We use the groupby() to make sure we’re working with unique songs, and max() function to get the highest ndays value from each group.
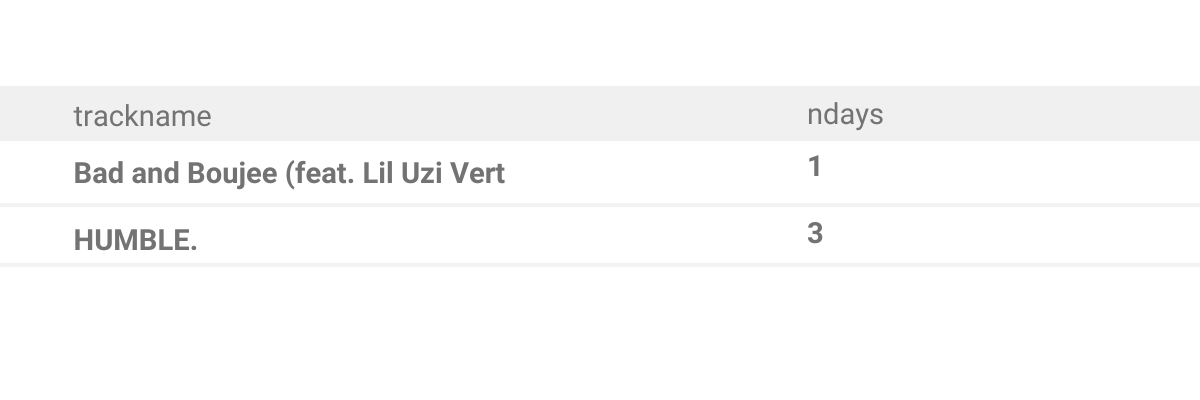
result = top1.groupby(['trackname'])['ndays'].max().to_frame('ndays').reset_index().sort_values('trackname')Then we use the to_frame() function to convert ndays series to dataframe format.
As a final step, we use the reset_index() function to reset the index column, and arrange songs in an alphabetical order.
With that, we arrive at the final solution:
import pandas as pd
import numpy as np

merged = pd.merge(spotify_daily_rankings_2017_us,spotify_worldwide_daily_song_ranking, on = ['trackname','date'])
top1 = merged[merged['position_x'] == 1]
top1['world_position'] = (top1['position_y'] == 1).astype(int)
top1['ndays'] = top1.groupby(['trackname'])['world_position'].transform('sum')
result = top1.groupby(['trackname'])['ndays'].max().to_frame('ndays').reset_index().sort_values('trackname')
Output
Question #12: Apple Product Counts
This is a question from Google, but candidates have to analyze apple product data.


Link to the question: https://platform.stratascratch.com/coding/10141-apple-product-counts
Understand the question
Reading the first sentence of the question should be a sign that we will use aggregation to solve this question.
Description contains important details and assumptions to help you approach the question the right way. Candidates are given specific instructions on how to format and arrange output values.
Analyze data
The data necessary to find answers is split between two tables.
Finding a solution will require some way to combine data in two tables. To merge them, we’ll have to find the shared dimension - a common column between two tables.
Let’s scan the table and look at types of values in each column:

The user_id column in both tables seems to contain unique values to identify the user.
It’s safe to assume that other text values (type object), like event_type, event_name, location, and device, can be duplicate. Likely we will have to sort values in the device column.
playbook_events table:
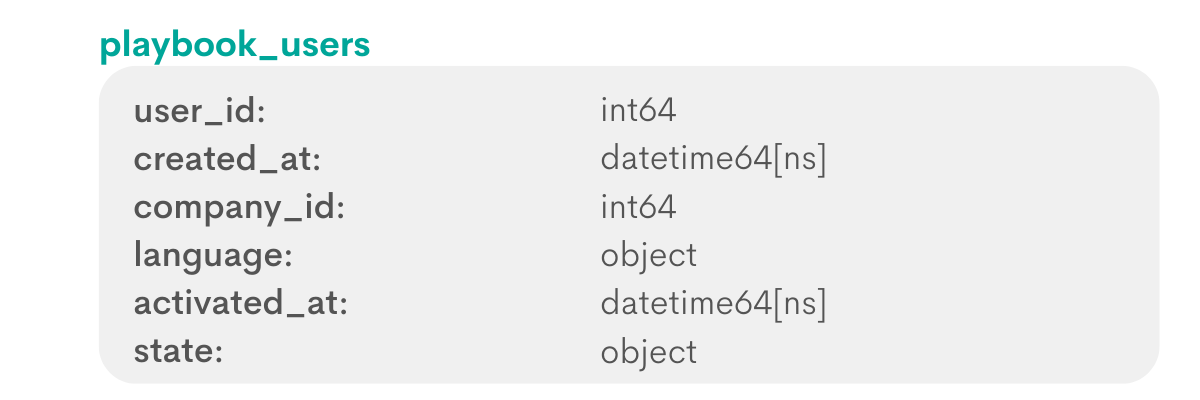
playbook_users table:
Plan your approach
This question asks us to find users with Apple devices. So we need to make a Python list that contains names of specified Apple products in a lowercase string format.
We need to work with data from both dataframes, so we need to merge two tables.
Once we have combined data from two tables, we need to divide users into groups with different language values and find the number of users in each group.
It’s also a good idea to give the aggregated column a new name, to make it clear that this column contains a total number of users for each language.
Then you need to create a new column. The value of this column will be 1 for Apple users, and 0 for others. There are multiple ways to accomplish this. One is to filter the dataframe to keep only users with Apple devices and then merge it with the list of all users.
Write the code
Try to solve the question yourself:
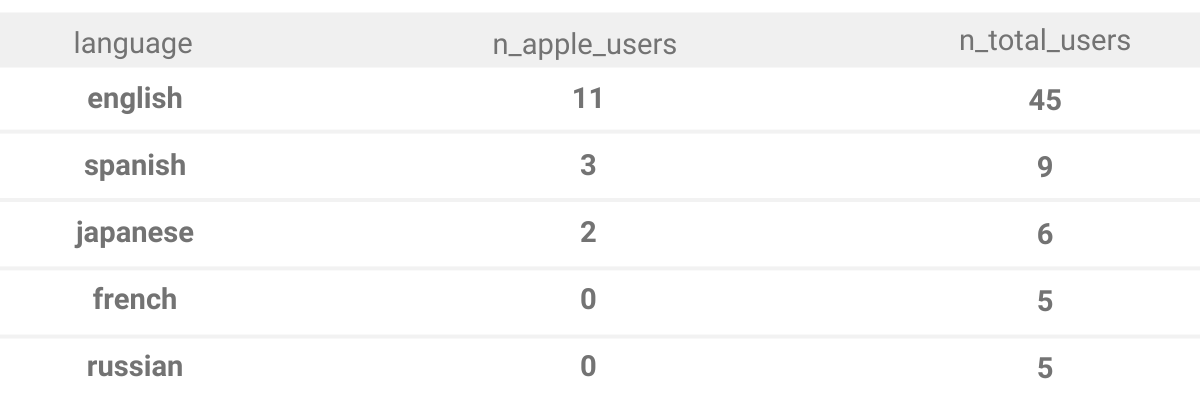
Output
The final answer should have three columns. Rows should be ordered based on the number of total users.
Question #13: Best Selling Item
Interviewers at Amazon ask this question to check a candidate's ability to solve complex data science problems in python. Solving this question requires discipline to carefully read the question, pay attention to its concepts and start writing code only after everything is clear.


Link to the question: https://platform.stratascratch.com/coding/10172-best-selling-item
The question clearly states that you don’t have to worry about monthly sales from different years. It also defines the criteria for finding a best selling product.
Analyze data
We have just one table with numerous columns. First, let’s look at types of values:
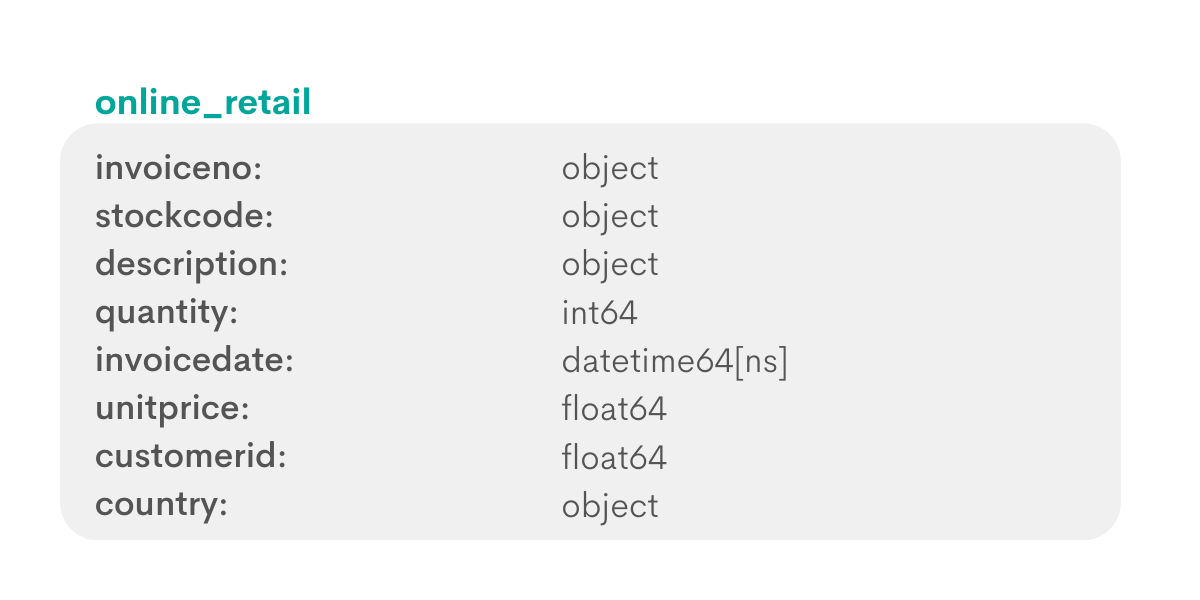
Let’s start with the invoiceno column, which probably contains unique numbers for each transaction.
stockcode values likely also describe the product, but most likely we will not work with this column.
description should be a name or short description of the product. The question specifically indicates that we should return values in this column.
The quantity column likely contains the number of products purchased in each transaction. We will need to multiply values in this column by unitprice to get the total value of the transaction.
The invoicedate is important, because the datetime value shows when the transaction took place.
The question doesn’t ask us anything about individual customers, so the customerId and country columns can be ignored.
Now, let’s preview the online_retail table with data.
Plan your approach
Solution to this question can be broken down into three steps:
In the first step, we need to take datetime values in the online_retail dataframe and convert them to months.
Then aggregate total price paid for each item, and store it in a new column.The question tells us that best-selling stands for highest dollar amount paid, not units sold. Calculating the total dollar amount paid for each product is obvious - multiply price by quantity.
Since each record in the table describes just one transaction, it’s safe to assume that there are many transactions for each product. We need to make sure to get the total of all transactions.
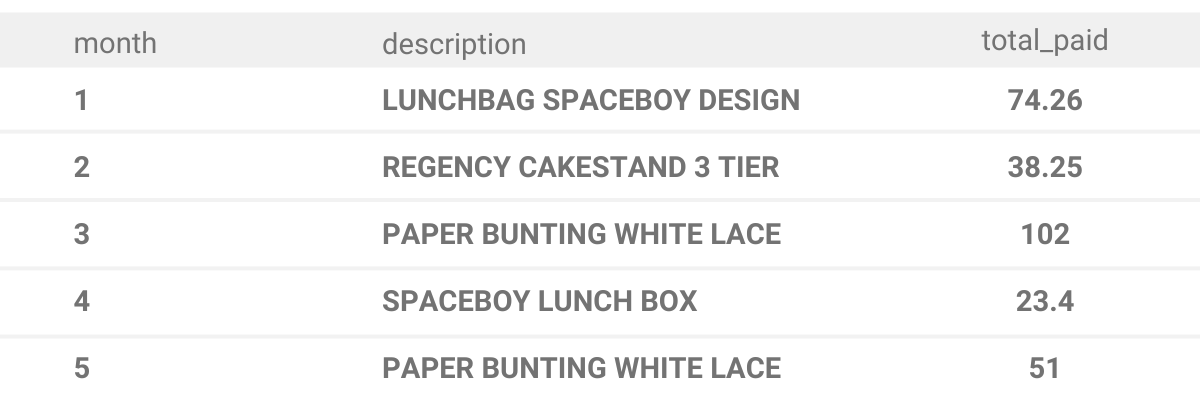
You will also need to use the rank() function to rank months by their sales. Finally, output the following columns - month, description, and total_paid.
Write the code
Try to solve the challenge yourself:
Output
The answer should have three columns - month, the description of the best selling item for that month and total amount paid for the item.
Summary
In this article, we went over common Python data science interview questions asked during interviews today. We covered both coding and non-coding types of questions. We saw how to combine data from two tables, rank records based on values in a specific column, divide rows into groups, calculate totals for each group, and other common operations in Python.
If you found this article useful, you can also check out a longer list of “python interview questions” or “data science interview questions”.
StrataScratch allows you to practice solving actual questions asked during interviews today. We have over one hundred Python data science interview questions from Google, Amazon, Uber, Microsoft and other large companies in this field.
You can use the built-in Python widget to write the code and get immediate feedback. If you get stuck, there are hints for approaching a question. There’s even a discussion section where experienced professionals share and discuss their solutions.
Share