A No-Fluff Guide to Polars vs Pandas

Categories:
 Written by:
Nathan Rosidi
Comparing Pandas and Polars using a real Uber business modelling task — here's who came out faster (and by how much).
Comparing Pandas and Polars using a real Uber business modelling task — here's who came out faster (and by how much).
Python or Polars? Many data scientist have had to answer this question in their lifetime.
Whether working on a pretty large dataset or experimenting with new algorithms or functions, saving time or resources would be a great option.
In this article, we will achieve this by using a real-life dataset, where Uber asked data scientists to conduct partner business modeling. Before going to the comparison, let’s understand the dataset we’ll use in this article.
Understanding the Dataset: Partner Business Modeling
This data project has been used as a take-home assignment in the data science recruitment process. Here is the link to this project: https://platform.stratascratch.com/data-projects/partner-business-modeling
Now that we are using this assignment to compare polars to pandas, it's cool, right?
So let’s read the dataset first.
import pandas as pd
df = pd.read_csv("dataset_2.csv")
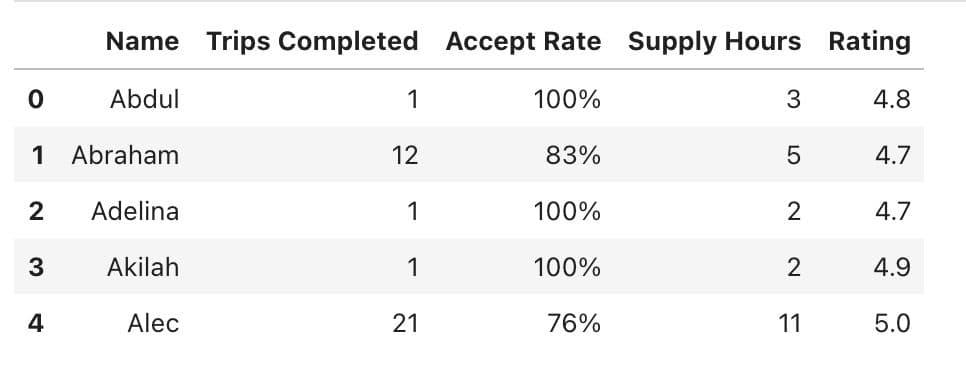
df.head()
Here is the output.
Good, now we know a frame of our dataset. But how many columns do we have? Are these columns all of them??? What are their data types? Let’s see.
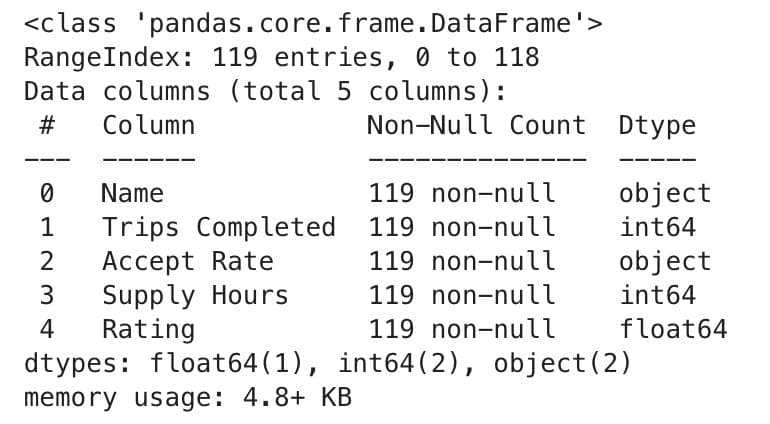
df.info()Here is the output.
Good, let’s statistically analyze the dataset.
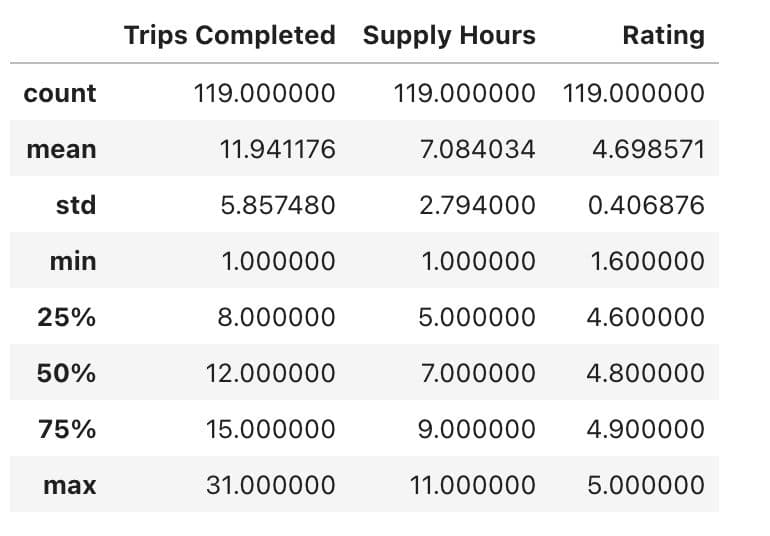
df.describe()
Here is the output.
We're all set now.
Pandas vs Polars: The Basics You Should Know
Pandas is a popular data manipulation library among data scientists for almost a decade now. Especially, the dataframes have become a new term in data analysis, similar to googling. It is similar to SQL tables and Excel sheets, and you can easily analyze data using this, as you saw in the previous section.
On the other hand, Polars is newer and built in Rust. The reason it was built is to solve problems that Pandas has. We can say speed and scalability. The famous term in Polars is lazy evaluation, if you did a bit of research about it. This feature makes Polar faster.
Now, we know this information, but is this all? We will test it using the previously mentioned Uber Partner modeling dataset with various scenarios. This will not only be a fun one, but it will be an informative one.
Installing Polars
If Polars is not installed in your environment, you can install it using the following code.
!pip install polars
Now you are, and we are all set, so let’s go.
Scenario 1 - Filtering with Conditions
Now let’s start with a small task. As you know, Uber categorizes their drivers based on the conditions. Similar to this, we will first convert the Accept Rate column into a float and then filter for drivers who accepted more than 90 percent and have a rating above 4.7.
We will do this with both Pandas and Polars. To avoid leaving this test to chance, we will conduct this experiment 10 times for each condition with loops and calculate the average. And at the end, we will compare the results. Let’s see the code first.
Pandas
import time

def run_pandas():
    df["Accept Rate"] = df["Accept Rate"].astype(str).str.rstrip('%').astype(float)
    return df[(df["Accept Rate"] > 90) & (df["Rating"] > 4.7)]

pandas_times = []
for _ in range(10):
    start = time.time()
    _ = run_pandas()
    pandas_times.append(time.time() - start)

print(f"Avg Pandas Time: {sum(pandas_times)/len(pandas_times):.4f} seconds")
Here is the output.

Polars
def run_polars():
    df_pl_mod = df_pl.with_columns(
        pl.col("Accept Rate").str.strip_chars("%").cast(pl.Float64)
    )
    return df_pl_mod.filter((pl.col("Accept Rate") > 90) & (pl.col("Rating") > 4.7))

polars_times = []
for _ in range(10):
    start = time.time()
    _ = run_polars()
    polars_times.append(time.time() - start)

print(f"Avg Polars Time: {sum(polars_times)/len(polars_times):.4f} seconds")
Here is the output.

Comparison
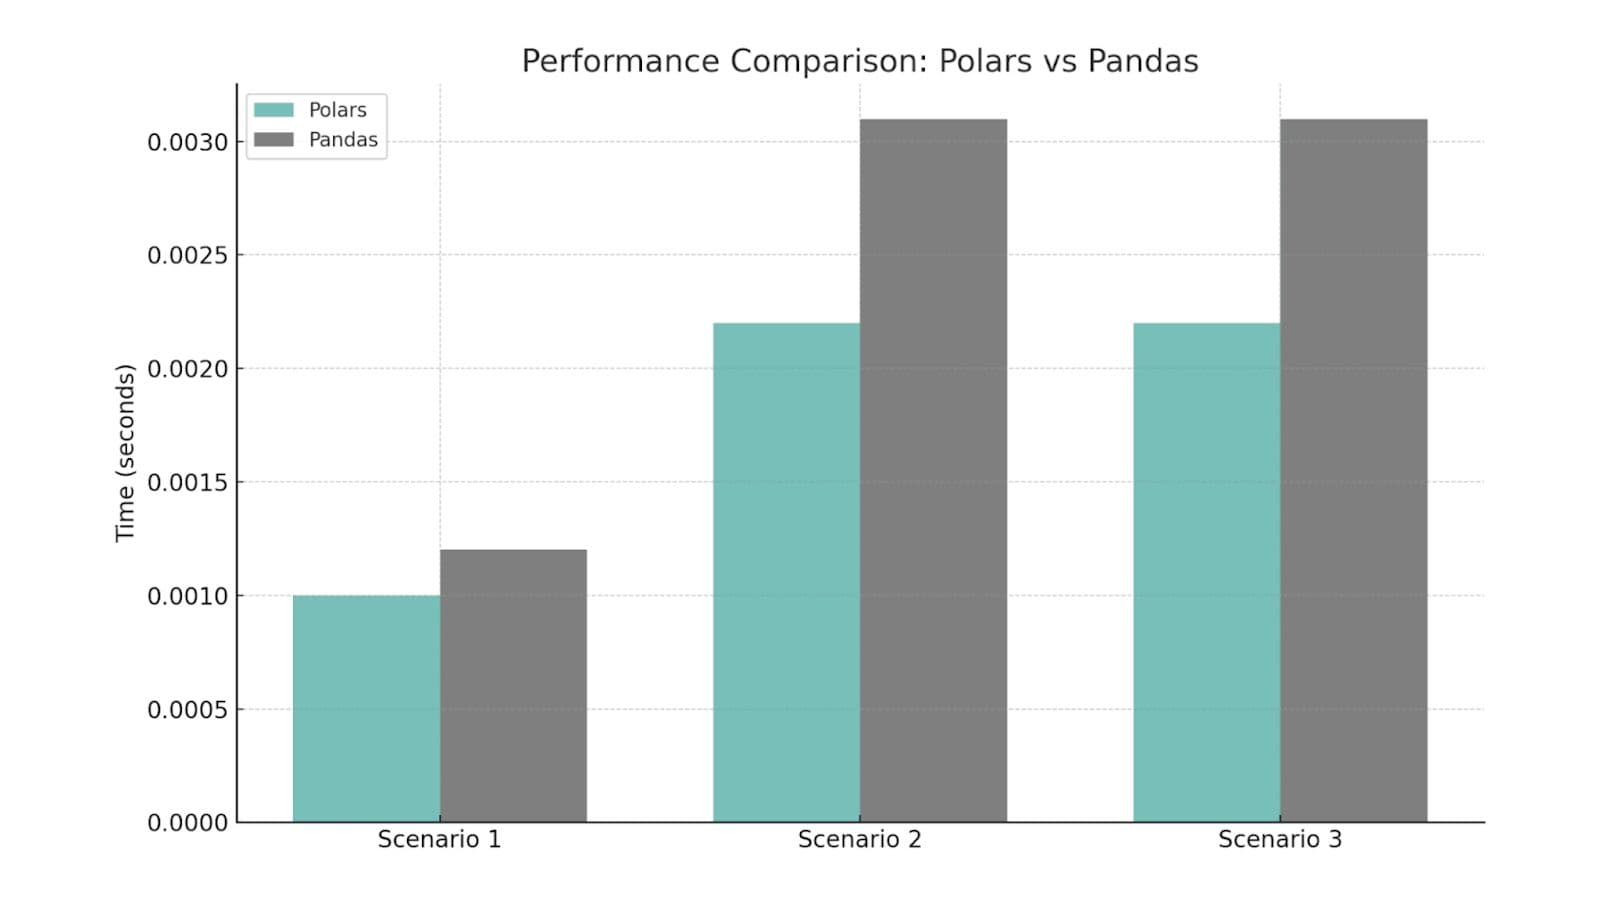
Now, if we compare the results, they are not too different:
- Polars 0.0010
- Pandas 0.0012
Polars is 20% faster than Pandas. On a small dataset, the difference may seem minor, but if you assume there will be a million times more data, the gaps will become more significant. Let’s continue to the following scenario.
Scenario 2 - Grouping Drivers by Trips and Calculating the Mean Rating
The heading is pretty straightforward. In this scenario, we will group drivers based on the number of trips they have completed. And then, we will calculate the mean rating. Let’s see the code.
Pandas
def run_pandas_group():
    bins = [0, 6, 11, 16, 21, df["Trips Completed"].max() + 1]
    labels = ['0-5', '6-10', '11-15', '16-20', '21+']
    df["Trip Group"] = pd.cut(df["Trips Completed"], bins=bins, labels=labels, right=False)
    return df.groupby("Trip Group", observed=True)["Rating"].mean()

pandas_group_times = []
for _ in range(10):
    start = time.time()
    _ = run_pandas_group()
    pandas_group_times.append(time.time() - start)

print(f"Avg Pandas Group Time: {sum(pandas_group_times)/len(pandas_group_times):.4f} seconds")
Here is the output.

Polars
def run_polars_group():
    df_with_group = df_pl.with_columns(
        [
            pl.when(pl.col("Trips Completed").cast(pl.Int64) < 6).then(pl.lit("0-5"))
            .when(pl.col("Trips Completed").cast(pl.Int64) < 11).then(pl.lit("6-10"))
            .when(pl.col("Trips Completed").cast(pl.Int64) < 16).then(pl.lit("11-15"))
            .when(pl.col("Trips Completed").cast(pl.Int64) < 21).then(pl.lit("16-20"))
            .otherwise(pl.lit("21+"))
            .alias("Trip Group")
        ]
    )

    result = df_with_group.group_by("Trip Group").agg(
        pl.col("Rating").mean().alias("Avg Rating")
    )

    return result

polars_group_times = []
for _ in range(10):
    start = time.time()
    _ = run_polars_group()
    polars_group_times.append(time.time() - start)

print(f"Avg Polars Group Time: {sum(polars_group_times)/len(polars_group_times):.4f} seconds")
Here is the output.

Comparison
Now, if we compare the results, they look significantly different:
- Polars 0.0022
- Pandas 0.0031
Polars is 41% faster this time.
Polars 2 - 0 Pandas.
Scenario 3- Bonus Payout Logic
This is where it gets real.
Uber encourages drivers during a busy Saturday and has tasked you with evaluating the cost of two bonus programs. We'll calculate the payout model and see how Pandas and Polars do the logic.
Bonus Rules Recap
Option 1: $50 per driver who:
- Is online for at least 8 hours
- Has an acceptance rate ≥ 90%
- Completes at least 10 trips
- Has a rating ≥ 4.7
Option 2: For every driver who:
- Charges $4 a trip
- Completes at least 12 trips
- Has a rating ≥ 4.7
Pandas
import time

def run_pandas_bonus():
    df["Accept Rate"] = df["Accept Rate"].astype(str).str.rstrip('%').astype(float)

    option_1_qualified = df[
        (df["Supply Hours"] >= 8) &
        (df["Accept Rate"] >= 90) &
        (df["Trips Completed"] >= 10) &
        (df["Rating"] >= 4.7)
    ]

    option_2_qualified = df[
        (df["Trips Completed"] >= 12) &
        (df["Rating"] >= 4.7)
    ]

    option_1_payout = len(option_1_qualified) * 50
    option_2_payout = option_2_qualified["Trips Completed"].sum() * 4

    unique_1_only = set(option_1_qualified["Name"]) - set(option_2_qualified["Name"])

    total_drivers = len(df)
    less_than_10_trips = len(df[df["Trips Completed"] < 10]) / total_drivers * 100
    under_90_accept = len(df[df["Accept Rate"] < 90]) / total_drivers * 100
    over_47_rating = len(df[df["Rating"] >= 4.7]) / total_drivers * 100

    return {
        "Option 1 Payout": option_1_payout,
        "Option 2 Payout": option_2_payout,
        "Drivers Only in Option 1": len(unique_1_only),
        "Percent <10 Trips": round(less_than_10_trips, 2),
        "Percent <90% Accept Rate": round(under_90_accept, 2),
        "Percent ≥4.7 Rating": round(over_47_rating, 2)
    }

pandas_bonus_times = []
for _ in range(10):
    start = time.time()
    _ = run_pandas_bonus()
    pandas_bonus_times.append(time.time() - start)

print(f"Avg Pandas Bonus Time: {sum(pandas_bonus_times)/len(pandas_bonus_times):.4f} seconds")
Here is the output.

Polars
def run_polars_bonus():
    df_clean = df_pl.with_columns(
        pl.col("Accept Rate").str.strip_chars("%").cast(pl.Float64)
    )

    option_1 = df_clean.filter(
        (pl.col("Supply Hours") >= 8) &
        (pl.col("Accept Rate") >= 90) &
        (pl.col("Trips Completed") >= 10) &
        (pl.col("Rating") >= 4.7)
    )

    option_2 = df_clean.filter(
        (pl.col("Trips Completed") >= 12) &
        (pl.col("Rating") >= 4.7)
    )

    payout_1 = option_1.height * 50
    payout_2 = option_2.select(pl.col("Trips Completed").sum()).item() * 4

    names_1 = set(option_1["Name"].to_list())
    names_2 = set(option_2["Name"].to_list())
    only_option_1 = len(names_1 - names_2)

    total_drivers = df_clean.height
    percent_less_than_10_trips = df_clean.filter(pl.col("Trips Completed") < 10).height / total_drivers * 100
    percent_under_90_accept = df_clean.filter(pl.col("Accept Rate") < 90).height / total_drivers * 100
    percent_rating_47_plus = df_clean.filter(pl.col("Rating") >= 4.7).height / total_drivers * 100

    return {
        "Option 1 Payout": payout_1,
        "Option 2 Payout": payout_2,
        "Drivers Only in Option 1": only_option_1,
        "Percent <10 Trips": round(percent_less_than_10_trips, 2),
        "Percent <90% Accept Rate": round(percent_under_90_accept, 2),
        "Percent ≥4.7 Rating": round(percent_rating_47_plus, 2)
    }

polars_bonus_times = []
for _ in range(10):
    start = time.time()
    _ = run_polars_bonus()
    polars_bonus_times.append(time.time() - start)

print(f"Avg Polars Bonus Time: {sum(polars_bonus_times)/len(polars_bonus_times):.4f} seconds")
Here is the output.

Comparison
Now, if we compare the results finally, here are the timings:
- Polars 0.0022
- Pandas 0.0031
Here, polars is 29% faster.
Final Thoughts
We have compared polars and pandas using a real-life data project from Uber, and ultimately, we compared their speed for each case.
On average, polars is 30% faster than pandas, if we mean the percentages.
If you want to use Polars or Pandas with real-life data projects, visit our platform to discover over 50 of them. See you there!
Share