Performing Anova in Python for Precision Agriculture


Categories:
 Written by:
Nathan Rosidi
Exploring agricultural insights with Anova in Python using the Kaggle crop recommendation dataset.
Have you ever wondered how modern farmers decide which crops to plant and when? The secret is in understanding the complex relationship between crops and their environment.
Imagine using statistics to transform agriculture. This is where ANOVA comes in, turning data into actionable insights for precision farming.
In this article, we'll use the Crop Recommendation Dataset from Kaggle to perform ANOVA. We'll begin by exploring the dataset, visualizing the data, and then applying ANOVA in three different ways to compare various conditions.
What is Anova?
Analysis of Variance, is a tool to see which variables matter more when you're looking at data. Like, if you have different things that might affect something – let's say how well a plant grows – ANOVA helps you figure out which one is really making the difference. It's a way to check out what really matters in your data.
To see how, we will use the Crop recommendation dataset, from Kaggle. You can find this dataset, here.
Data Exploration
In this section, we will look closely at the dataset to fully understand its structure and the details of its data. We will check what kinds of data it has and look for any missing values to make sure the data is good.
This first look at the data is important because it prepares us for more detailed analysis and helps us decide which data points to study more. Let’s load the libraries at first.
import pandas as pd
from matplotlib import pyplot as plt
import seaborn as sns
from scipy.stats import f_oneway
Let’s read our dataset and view first few rows of our dataset.
df = pd.read_csv("Crop_recommendation.csv")
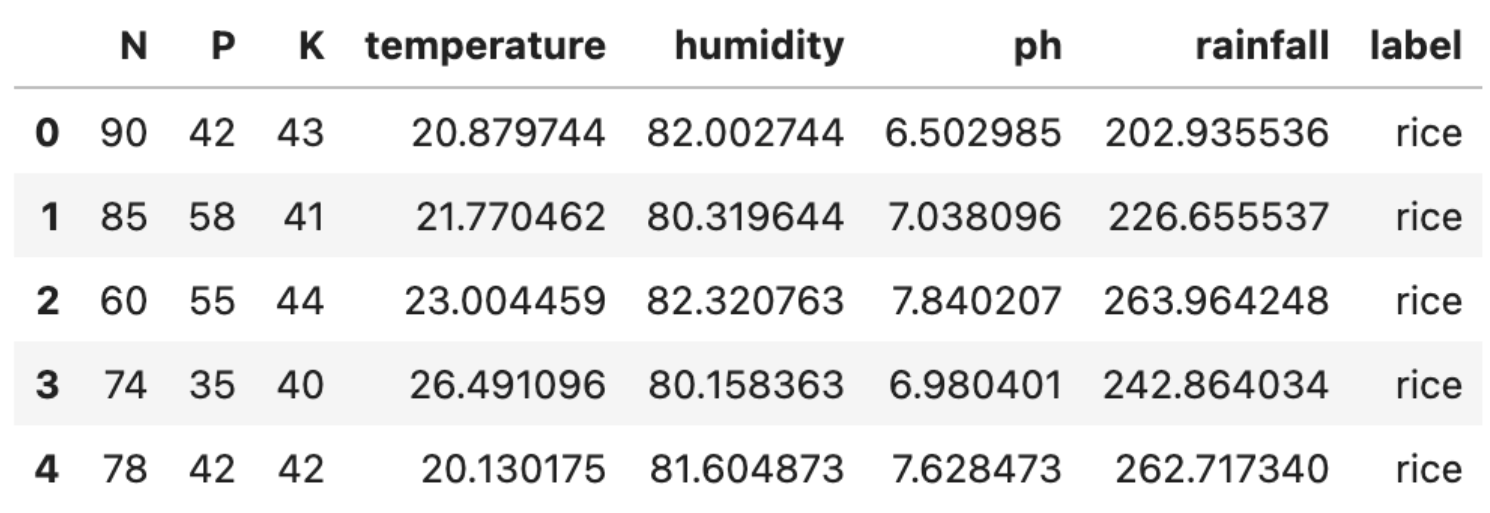
df.head()
Here is the output.

Good but not enough, let’s use info method to look more details.
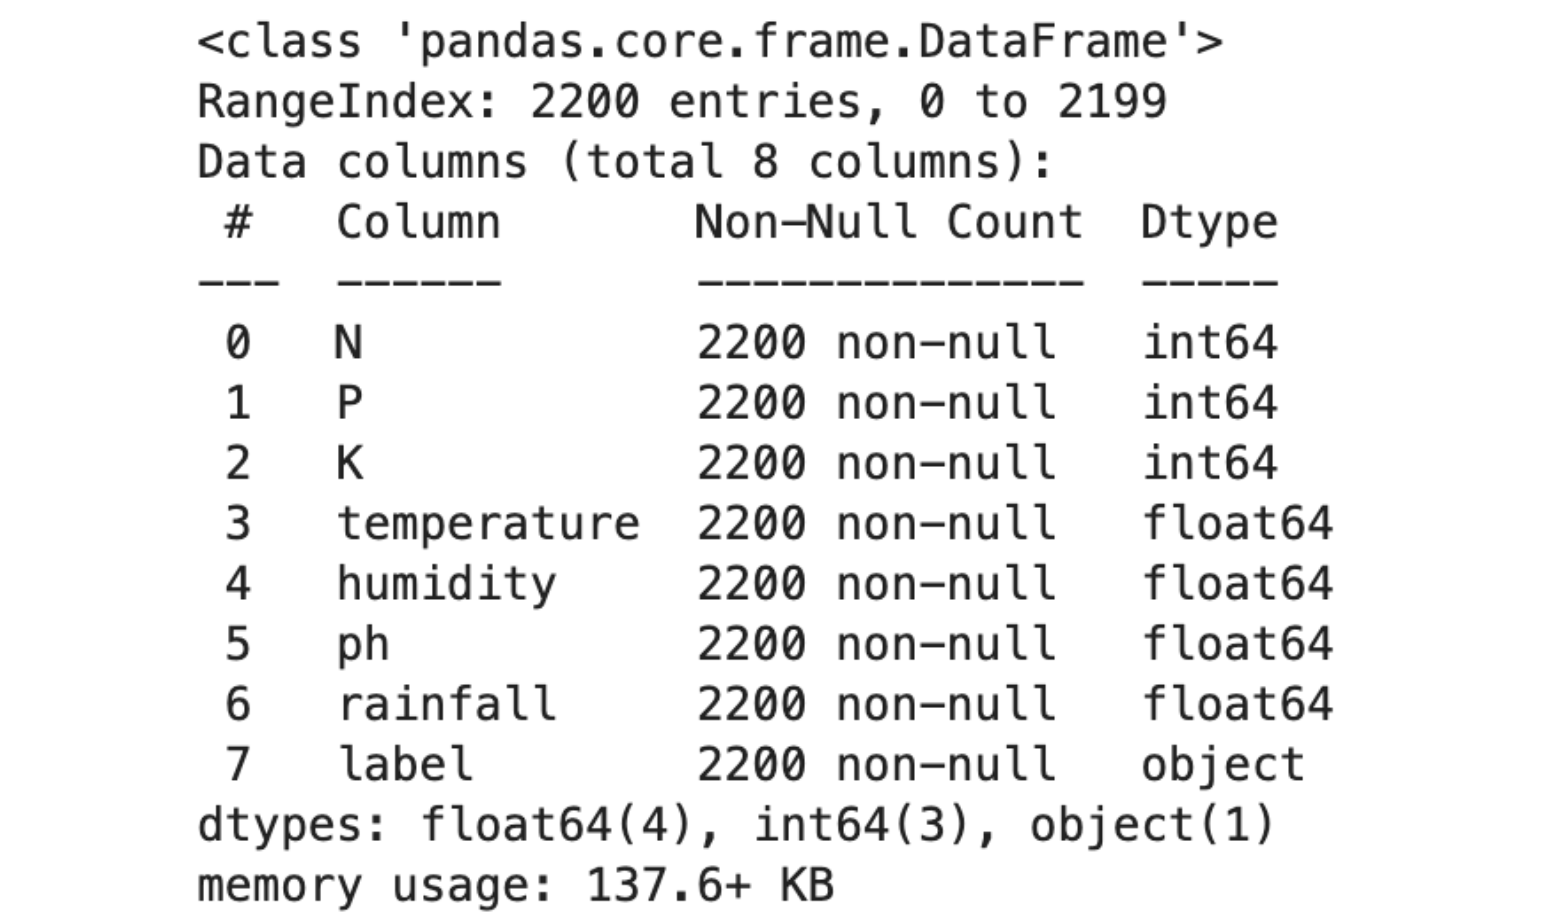
df.info()Here is the output.

Dataset Overview
- Composition: The dataset comprises 2200 entries with 8 columns. These columns include N (Nitrogen), P (Phosphorus), K (Potassium), temperature, humidity, pH, rainfall, and label (type of crop).
- Data Representation: Each row in the dataset represents different conditions and the type of crop grown under those conditions.
- Data Types: The dataset includes a mix of both integer and floating-point data types.
- Data Quality: There are no null values in any of the columns, indicating a complete dataset with no missing information.
Before overviewing our results, let’s look at our numerical data’s too.
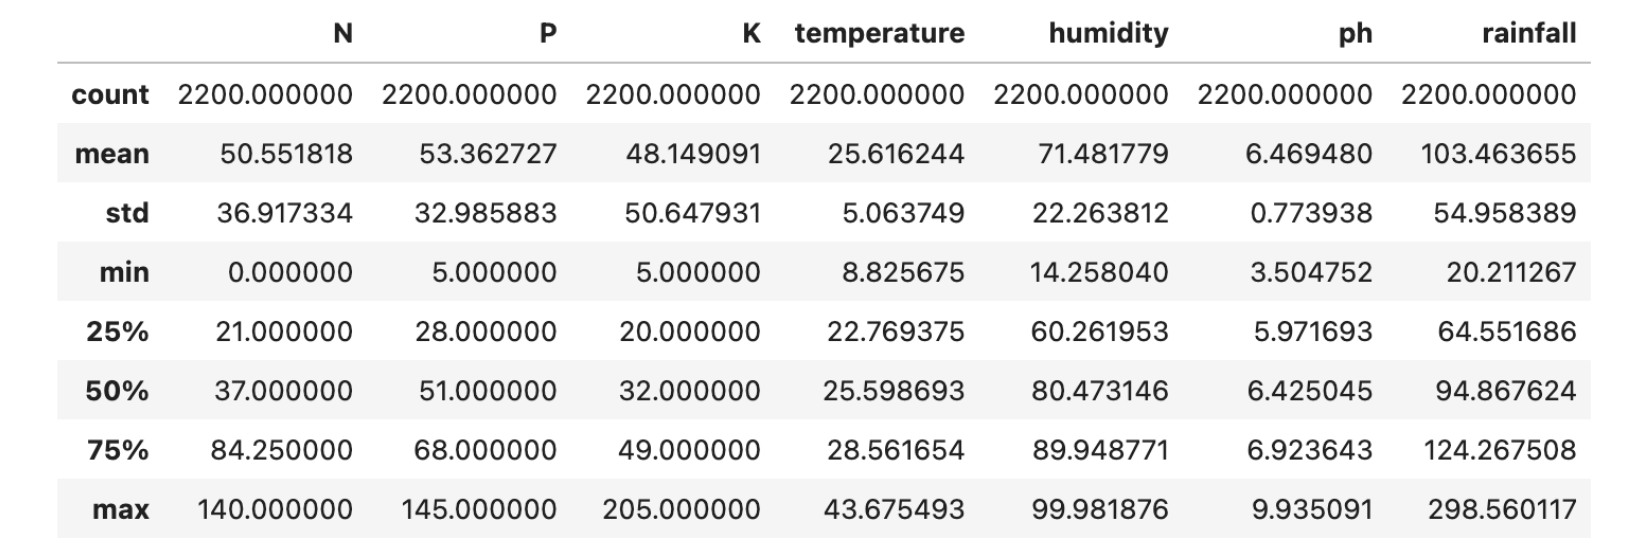
df.select_dtypes(include=['int64', 'float64']).describe()Here is the output.

Summary Statistics
Let’s analyze our statistics.
- Nutrient Levels: The levels of nutrients like Nitrogen (N), Phosphorus (P), and Potassium (K) vary widely, indicating a diverse range of crop nutrient requirements.
- Temperature: The dataset shows a temperature range from 8.83°C to 43.68°C, indicating it covers a broad spectrum of climatic conditions.
- Humidity: Humidity in the dataset varies between 14.26% and 99.98%, signifying a wide array of environmental conditions.
- pH Levels: pH levels range from 3.50 to 9.94, encompassing conditions from acidic to alkaline soil types.
- Rainfall: Rainfall measurements vary from 20.21 mm to 298.56 mm, suggesting the dataset includes crops with diverse water requirements.
Data Visualization
In the Data Visualization section, we will make graphs of the data. This helps us understand and share its main points better. We will make plots that show how much temperature, humidity, and rainfall there is.
# Setting the aesthetic style of the plots
sns.set(style="whitegrid")

# Creating visualizations for Temperature, Humidity, and Rainfall
fig, axes = plt.subplots(1, 3, figsize=(18, 6))

# Temperature Distribution
sns.histplot(df['temperature'], kde=True, color="skyblue", ax=axes[0])
axes[0].set_title('Temperature Distribution')

# Humidity Distribution
sns.histplot(df['humidity'], kde=True, color="olive", ax=axes[1])
axes[1].set_title('Humidity Distribution')

# Rainfall Distribution
sns.histplot(df['rainfall'], kde=True, color="gold", ax=axes[2])
axes[2].set_title('Rainfall Distribution')

plt.tight_layout()
plt.show()
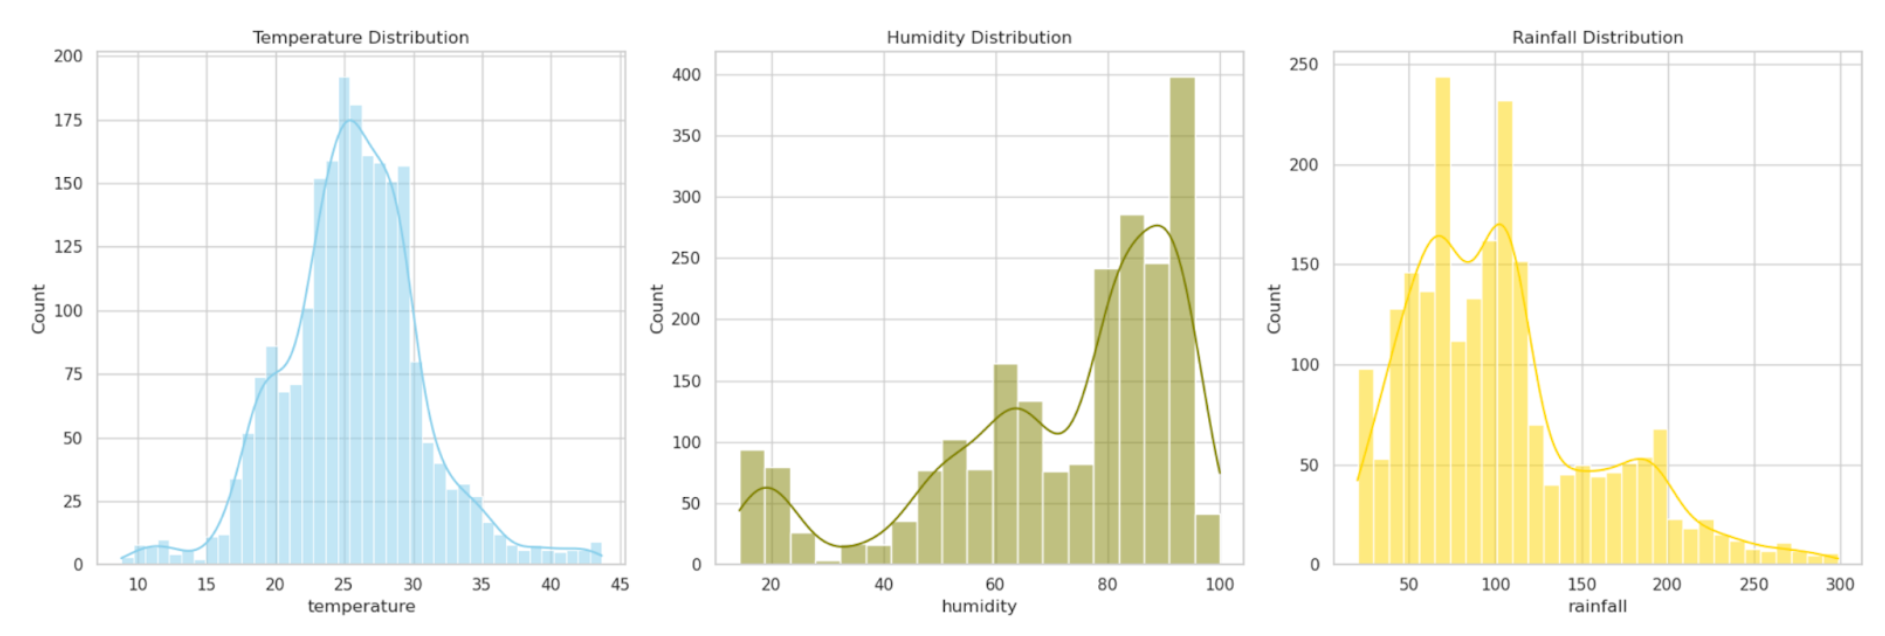
Here is our result.

Data Distribution Overview
Let’s overview this distributions.
- Temperature Distribution: This histogram illustrates the distribution of temperature across the dataset. The data appears to be fairly normally distributed, signifying a wide range of temperatures suitable for different crops.
- Humidity Distribution: The histogram for humidity demonstrates a wide range, with a slight skewness towards higher humidity levels.
- Rainfall Distribution: The distribution of rainfall is skewed, suggesting that most crops in the dataset are cultivated in regions with moderate to high rainfall.
These visualizations are instrumental in understanding the environmental conditions under which various crops are grown in the dataset.
Applying ANOVA in Python: Understanding the Code

The code above, prepares for an ANOVA test by creating lists of data for each type of crop, based on a specific factor like rainfall, temperature, or humidity.
First, you choose which factor to look at by replacing 'your_factor_here'. Then, for each crop type in your dataset, it makes a list of all the values for that factor. This way, you get separate lists for each crop, ready to use in the ANOVA test.
Let’s see the code.
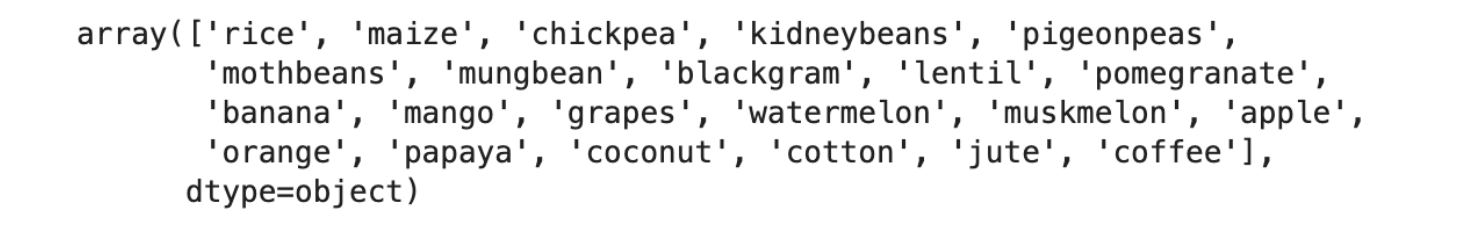
Step 1: Define Crop Types
# Define crop types based on your DataFrame 'df'
crop_types = df['label'].unique()
This line gets all the different types of crops in our dataset.

Step 2: Prepare Data Lists
# Preparing a list of values for each crop type for the chosen factor
factor = 'your_factor_here'
# Replace 'your_factor_here' with 'rainfall', 'temperature', or 'humidity' as needed
factor_lists = [df[df['label'] == crop][factor] for crop in crop_types]
Then, for each crop type in our dataset, this code makes a list of all the values for that factor. For example, if we choose humidity, the code will make a list for each type of crop. Each list will have the humidity values for that crop from the dataset.
Step 3: Perform ANOVA Test
# Performing the ANOVA test for the chosen factor
anova_result = f_oneway(*factor_lists)
anova_result
After these lists are prepared for each crop type, they can be used to calculate ANOVA, which will analyze if there are statistically significant differences in humidity (or your chosen factor) across the different types of crops.
We will repeat these for Humidty, Rainfall and Temperature. Let’s start with Humidty.
Anova Analysis in Python for Humidity
In this part, we focus on how humidity affects different crops. We will use the ANOVA test to see if crops like different levels of humidity. This will help us understand how humidity changes the way crops grow and how they are chosen.
Let’s see our code, to apply ANOVA.
# Define crop_types based on your DataFrame 'df'
crop_types = df['label'].unique()

# Preparing a list of humidity values for each crop type
humidity_lists = [df[df['label'] == crop]['humidity'] for crop in crop_types]

# Performing the ANOVA test for humidity
anova_result_humidity = f_oneway(*humidity_lists)

anova_result_humidity
Here is the output.


Results
F-Statistic: The F-Statistic is 3103.71, which indicates a significant variance ratio between the different crops' humidity levels.
P-Value: The P-Value is 0.0, which is extremely small.
Interpretation
The extremely low P-Value suggests that there are statistically significant differences in the average humidity levels for different crops. This indicates that crops vary significantly in their preference for environmental humidity.
These results highlight the importance of humidity as a factor in agricultural crop selection and cultivation.
Anova Analysis in Python for Rainfall

In this section, we look at how rainfall affects different crops. We will use the ANOVA test to see if different crops get different amounts of rain on average. This study is important to learn how rain affects the way crops grow and how they are chosen. Let’s see the code first.
# Define crop_types based on your DataFrame 'df' if not already defined
crop_types = df['label'].unique()

# Preparing a list of rainfall values for each crop type
rainfall_lists = [df[df['label'] == crop]['rainfall'] for crop in crop_types]

# Performing the ANOVA test for rainfall
anova_result_rainfall = f_oneway(*rainfall_lists)

anova_result_rainfall
Results
- F-Statistic: The F-Statistic is 605.53, showing a high variance ratio between the different crops' rainfall levels.
- P-Value: The P-Value is 0.0, indicating a statistically significant difference.
Interpretation
The extremely low p-value strongly suggests significant differences in the average rainfall requirements for different crops. This highlights the importance of rainfall in determining the suitability of crops for specific regions.
Anova Analysis in Python for Temperature
In this section, we look at how temperature affects different kinds of crops. We want to find out if the average temperature for growing crops is different for each type of crop. We will use the ANOVA test to compare the average temperatures for each kind of crop.
By looking at the results, we want to learn how important temperature is for growing crops. Let’s see the code.
# Ensure crop_types is defined from your DataFrame 'df'
crop_types = df['label'].unique()

# Preparing a list of temperature values for each crop type
temperature_lists = [df[df['label'] == crop]['temperature'] for crop in crop_types]

# Performing the ANOVA test for temperature
anova_result_temperature = f_oneway(*temperature_lists)

anova_result_temperature
Here is the output.


Results
- F-Statistic: The F-Statistic is 102.19, indicating a significant variance ratio between different crops' temperature levels.
- P-Value: The P-Value is approximately 4.02e-305, which is extremely small.
Interpretation
The low p-value suggests that there are statistically significant differences in the average temperature preferences for different crops. This indicates that temperature is a critical factor in crop selection and cultivation.
Comparing Humidity, Rainfall, and Temperature Effects
Our ANOVA analysis showed that humidity, rainfall, and temperature all significantly affect crop growth, but in different ways.
- Humidity had the highest F-Statistic (3103.71), indicating a very strong difference in crop preference for humidity levels.
- Rainfall also showed a significant impact, with an F-Statistic of 605.53, suggesting that crops vary notably in their need for water.
- Temperature had a lower F-Statistic (102.19) compared to humidity and rainfall, but it still shows a significant effect on crops.
Final Insights
As we wrap up our analysis, we've found key insights for better farming methods. Our tests show that humidity, rainfall, and temperature greatly affect which crops to grow. Knowing how these factors impact crops helps farmers pick the best ones for their conditions.
This deep dive into the data helps improve how we choose crops and adds a lot to the science of farming.
If you're interested in data science and want to learn more, check out our platform. You can find data projects and interview questions, even from big tech companies like Google, Meta, Netflix.
Share