Most Common SQL Data Analyst Interview Questions by Facebook

Categories:
 Written by:
Nathan Rosidi
The most common SQL data analyst interview questions asked by Facebook! It’s the most commonly tested concept on Facebook's coding interviews.
Like many other tech giants, Facebook also leverages its data and provides opportunities for data analysts or data scientists to get hired. Data analysts are cross-functional and work in many different teams at Facebook. In this article, we'll go through one of the most common data analyst interview questions from Facebook which includes concepts like categorizations, aggregations, and ratios.
This SQL interview question is one of the 5 coding concepts that companies test you on. To know all these concepts, check out our previous article - Data Science Coding Interview Questions with 5 Technical Concepts.
Facebook SQL Data Analyst Interview Question
Share of Active Users
Last Updated: February 2021
Calculate the percentage of users who are both from the US and have an 'open' status, as indicated in the fb_active_users table.
Link to this Facebook SQL Data Analyst Interview Question: https://platform.stratascratch.com/coding/2005-share-of-active-users
This SQL Data Analyst Interview Question includes the following concepts:
- Categorizations - CASE statements in SQL
- Aggregations - count() and sum()
- Ratio - Numerator and Denominator
This is Facebook’s most common and favorite SQL interview question and concept to ask. We've actually seen several different versions of this SQL question over the past 5 years. So if you do end up interviewing for Facebook, you’ll definitely get a similar question.
Approach to Solve this SQL Data Analyst Interview Question
For every data science interview question, we attach the problem the same way, each and every time. Especially in an interview where you’re probably nervous and stressed out. You can always rely on the same framework so that your mind goes on autopilot mode. It tends to calm you down and help you think through the solution.
The 4-step approach to solve this SQL data analyst interview question
- Explore the data to take a look at how it behaves
- Identify the required columns needed to solve the question
- Visualize the output
- Code is increments
1. Explore the data to take a look at how it behaves
The data includes the user_id, name, status of the account, and the country of origin of the account. We would assume that it’s unique, based on user_id, but with the status column being closed or open, you can make the case that there might be users with both an open and closed status. However, we would assume that if this were the case, we would see a date column that tells us what date the user either opened or closed their account. Without a date column, we’re assuming that this is the latest status of the user.
To check this, we can just do a simple aggregation and group by user_id.
select user_id,
  count(*)
from fb_active_users
where country = 'USA'
group by user_id
Now, we can see that all users in the US are unique.
| user_id | count |
|---|---|
| 7 | 1 |
| 18 | 1 |
| 25 | 1 |
| 52 | 1 |
| 82 | 1 |
| 87 | 1 |
2. Identify the required columns needed to solve this SQL data analyst interview question
Taking a look at the data and now understanding how it behaves, in order to calculate the ratio of active users in the US, we would need:
- User_id: to count users
- Status: to filter users based on their status
- Country: to filter users based on their country
3. Visualize the output
Why is this important? And what does it actually mean? It’s important to understand what the end result will look like. This will help you design your solution and organize your code.
This SQL interview question is pretty simple though. It’s going to just be one column in the output with one number. We just want a ratio of active users divided by all users in the US. That’s the end result.
But to get to that result, we’ll need to do some processing and apply logic to the data columns we identified in the previous step. Here’s what we’ll need to do:
- Filter for US users only
- Count the number of users with status = ‘open’
- Count the number of total users
- Take the number of status open users and divide by the total number of users
- I see two ways of organizing this solution.
a) One is to do all of the filtering and processing in one query
b) The other way is to do all the filtering and aggregation in a subquery and then take the ratio is the outer query. This is better for the organization both in an interview and on the job.
4. Code is increments
Coding in increments means exactly what you think it means. Write some code, run the code, check out the output. Why do this and not just write out the entire solution? Because you want to make sure the logic you’re applying is being applied in exactly the way you thought it would be.
So let’s solve this SQL data analyst interview question now:
1. Filter users from the US only
select *
from fb_active_users
where country = 'USA'| user_id | name | status | country |
|---|---|---|---|
| 18 | Wanda Ramirez | open | USA |
| 25 | Natasha Bradford | closed | USA |
| 52 | Michelle Jimenez | open | USA |
| 82 | Jacob York | closed | USA |
| 87 | David Taylor | closed | USA |
| 7 | Donald Jim | open | USA |
2. Count active users only
select
   count(case when status = 'open' then user_id else null end) as active_users
from fb_active_users
where country = 'USA'| active_users |
|---|
| 3 |
3. Add the count of all users
select
   count(case when status = 'open' then user_id else null end) as active_users,
   count(*) as total_users
from fb_active_users
where country = 'USA'| active_users | total_users |
|---|---|
| 3 | 6 |
4. Let’s now take the ratio of the active users
select
   count(case when status = 'open' then user_id else null end) /
   count(*)::FLOAT as ratio_active_users
from fb_active_users
where country = 'USA'| ratio_active_users |
|---|
| 0.5 |
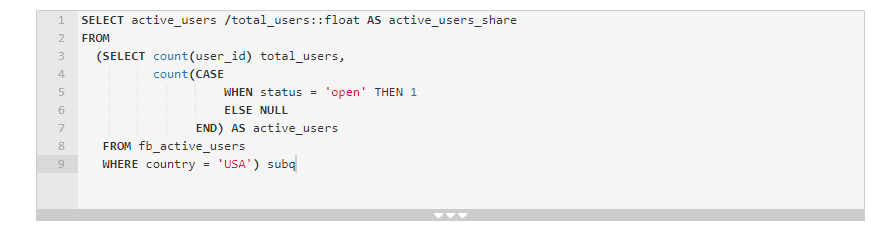
The other way of solving this SQL interview problem is to create a subquery where you do all the filtering in the subquery and then take the ratio in the outer query. Why we do it this way? Because it’s a much longer process.
To some people, it’s more organized. You can debug and see exactly what’s going on without much refactoring. You have the counts and filters making one table before aggregating to get to the final ratio.
In an interview, sometimes as you’re talking and guiding the interviewer through your solution, it’s just natural to split apart the logic in this way. At the end of the solution, you can always tell the interviewer a more efficient way of coding up the solution. In fact, a lot of interviewers are going to ask you that question anyways so it’s nice to think about it in advance.
If you read this solution and it makes sense to you then congrats, you’re on the right track.
To find more questions from Facebook, check out our articles "Facebook SQL interview question" and "Facebook Data Scientist Interview Questions".
Conclusion
As you can see, to solve this SQL data analyst interview question, you need to understand how to properly write a case statement, properly aggregate the results of the case statement, and then take a ratio from the result of the aggregation itself. All in one query.
The tricky part isn’t really even those 3 technical concepts. It’s organizing your code into logical steps -- as you can see there’s a subquery to split out the logic. But you don’t even need the subquery. And it’s more efficient not to have one.
And there’s also a data type conversion from an integer to a float so that your output can be between 0 and 1.
These are the little nuances you need to know in addition to these 3 concepts. Lots of people forget these small things, especially if you’re out of practice or nervous.
The more practice you have with these types of questions, the quicker you’ll see the patterns and be able to implement solutions.
Share