Microsoft Data Scientist Interview Questions

Categories:
 Written by:
Vivek Sankaran
We have discussed real-life Microsoft Data Scientist interview questions using Python. We will provide detailed solutions utilizing the Pandas library.
Recent questions from Microsoft interviews for the Data Scientist positions solved using Python
Microsoft is consistently rated as one of the best places to work. Recently, it crossed Two Trillion Dollars in market cap making it the second most valuable company in the world. In this article, we discuss real-life Microsoft Data Scientist interview questions using Python. We will provide detailed solutions utilizing the Pandas library.
We will look at vectorized operations and aggregation functions to transform the given dataset. We will also provide you with a process to solve similar problems and optimize code once you get the solution. You can always practice real-life Data Scientist interview questions from Microsoft and other top tech companies on our platform in both the SQL and Python formats.
Data Science role at Microsoft
Microsoft has multiple technology products and services across different domains, serving both B2B and B2C segments. Therefore, you will need domain expertise in areas like CS Engineering, Bioinformatics, Applied Sciences, Statistics, etc. besides Python programming skills. The role offered to you at Microsoft in the Data Science domain too, will be dependent on the business unit that you will be working for.
Concepts Tested in Microsoft Data Scientist Interview Questions
The main Python concepts tested in the Microsoft Data Scientist interview questions include
- Pandas data manipulation
- Slicing and indexing pandas dataframes
- groupby and aggregate functions
- sorting pandas dataframes
- Datetime functions
- Method chaining
- Boolean Masked Arrays
Microsoft Data Scientist Interview Question
New And Existing Users
Calculate the share of new and existing users. Output the month, share of new users, and share of existing users as a ratio.
New users are defined as users who started using services in the current month. Existing users are users who started using services in the current month and used services in any previous month.
Assume that the dates are all from the year 2020.
You can solve this Microsoft data scientist interview question here: https://platform.stratascratch.com/coding-question?id=2028&python=1
Dataset
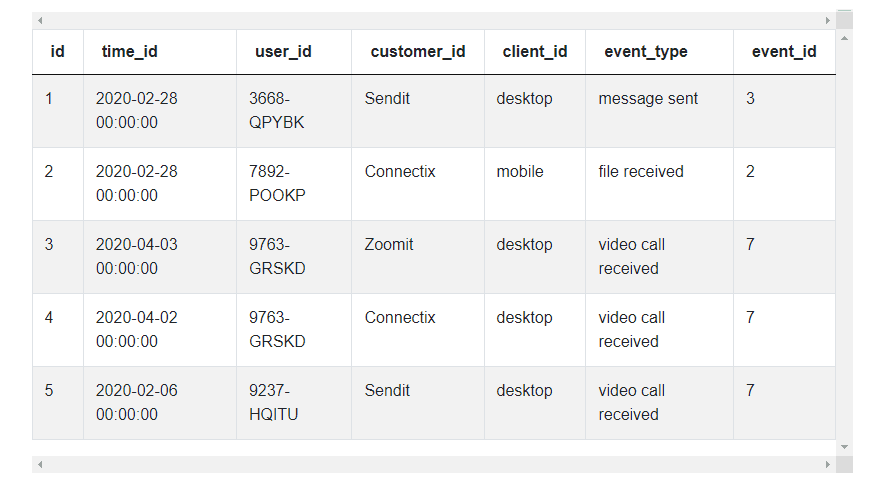
fact_events
| id | int64 |
| time_id | datetime64[ns] |
| user_id | object |
| customer_id | object |
| client_id | object |
| event_type | object |
| event_id | int64 |
Assumptions
This Microsoft Data Scientist interview question requires us to identify the new users from the data and then provide the share of new users as a ratio of the total number of users. If you read the problem carefully, it can give us a lot of information regarding the type of data that we are dealing with and help identify edge cases (if any). This is an opportunity to showcase your experience in dealing with data and anticipate the challenges. It is therefore advisable that you mention your assumptions and confirm them before proceeding. This can save a lot of heartburn later.
What are the assumptions on the data and the table?
The first thing that strikes you is the number of id fields that are present in the data. Let's look at each of these fields.
- id and user_id appear to be table serial number and user identifier fields. They can be safely ignored for solving this problem.
- time_id: appears to be the timestamp for the entries. This will be needed, since we have to group the new and existing users by each month of the year. This will be our grouper field.
- customer_id appears to be the company identifier. This can be safely ignored for this problem.
- client_id this field is the platform identifier – mobile, desktop, etc. We can safely ignore this field as well.
- event_id would be the identifier for an event and event_type will describe the event.
Again, please clarify these assumptions with the interviewer to ensure that you do not end up on the wrong track.
Here's the table that we will be working with –
Logic
Python Pandas library works wonderfully well with tabular data. It converts the data into a spreadsheet like Google Sheets or Microsoft Excel and you can work through it as you will work through a spreadsheet. Since we are solving this problem with Python, we should utilize this capability of the Pandas library. Let us work this backwards. If we have a table like this, it will be easy to get to the solution.
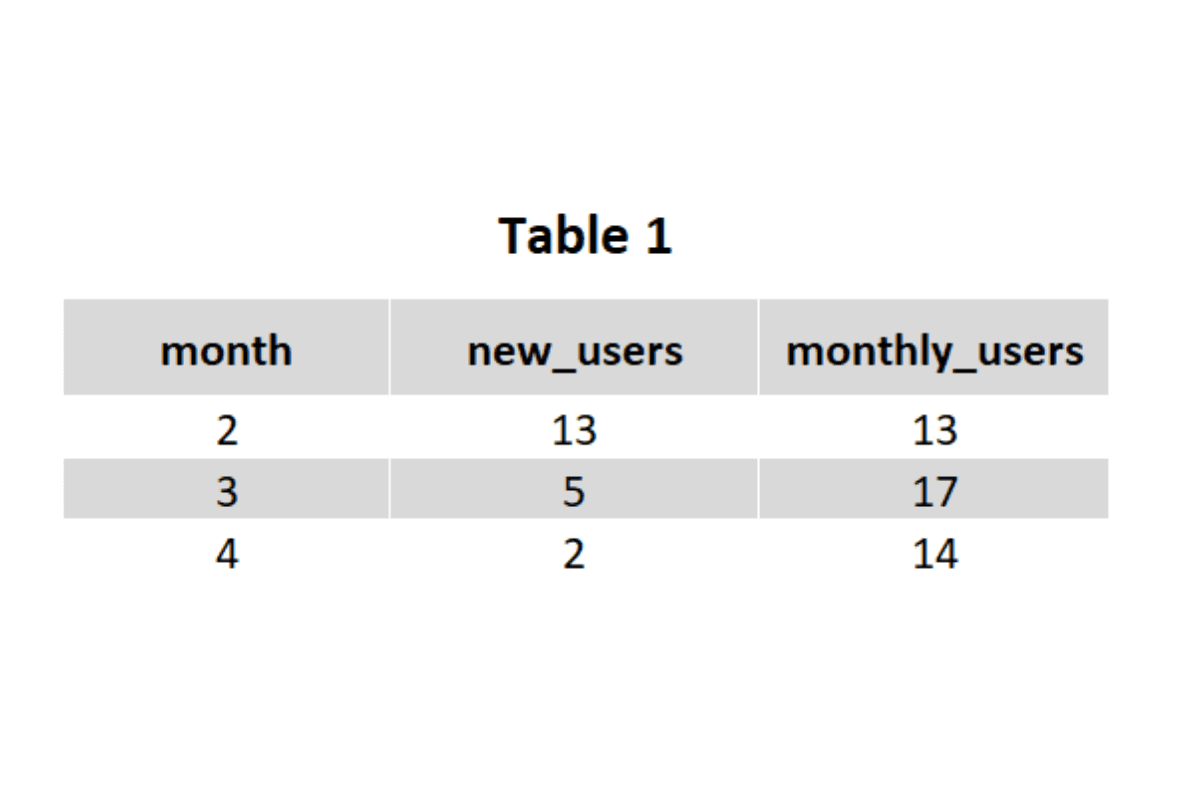
We have the total users (month_users) and the new users (new_users). We can easily calculate the new user share and the existing user share. Our aim will be to transform the data into something akin to the above. To do this, we need to break down the problem into parts.
- Extract the month from the timestamp.
- Identify new users
- To do this we will have to identify the first instance of the user in the table. This can be done using the timestamp field or the month field.
- Identify distinct users in each month
- To do this we will need to identify unique users for each month.
- Summarize the new users and distinct users by month (We will get the Table 1) above.
- Calculate the new user share and existing user share metrics.
To accomplish this in Python Pandas, we will simply create an additional field for each transaction (details in coding explanations below) that will tag the first instance of the user in the table and the first instance of the user for the month. We will get a table like this.
Then we can simply roll up the data using aggregation methods like groupby() or pivot_table() and calculate the required metrics. Now that we have fixed our logic, let us begin coding the solution.
Solution:
1. Extract the month from the timestamp (time_id). We also sort the user_id and timestamp sequentially, since it will be useful for identifying the first instance of user_id in the subsequent steps.
# Import your libraries
import pandas as pd
# Sort the data by user_id, month and time_id
usage_df = fact_events.sort_values(by = ['user_id','time_id'])
# Extract Month from the date
usage_df['month'] = usage_df['time_id'].dt.month
usage_df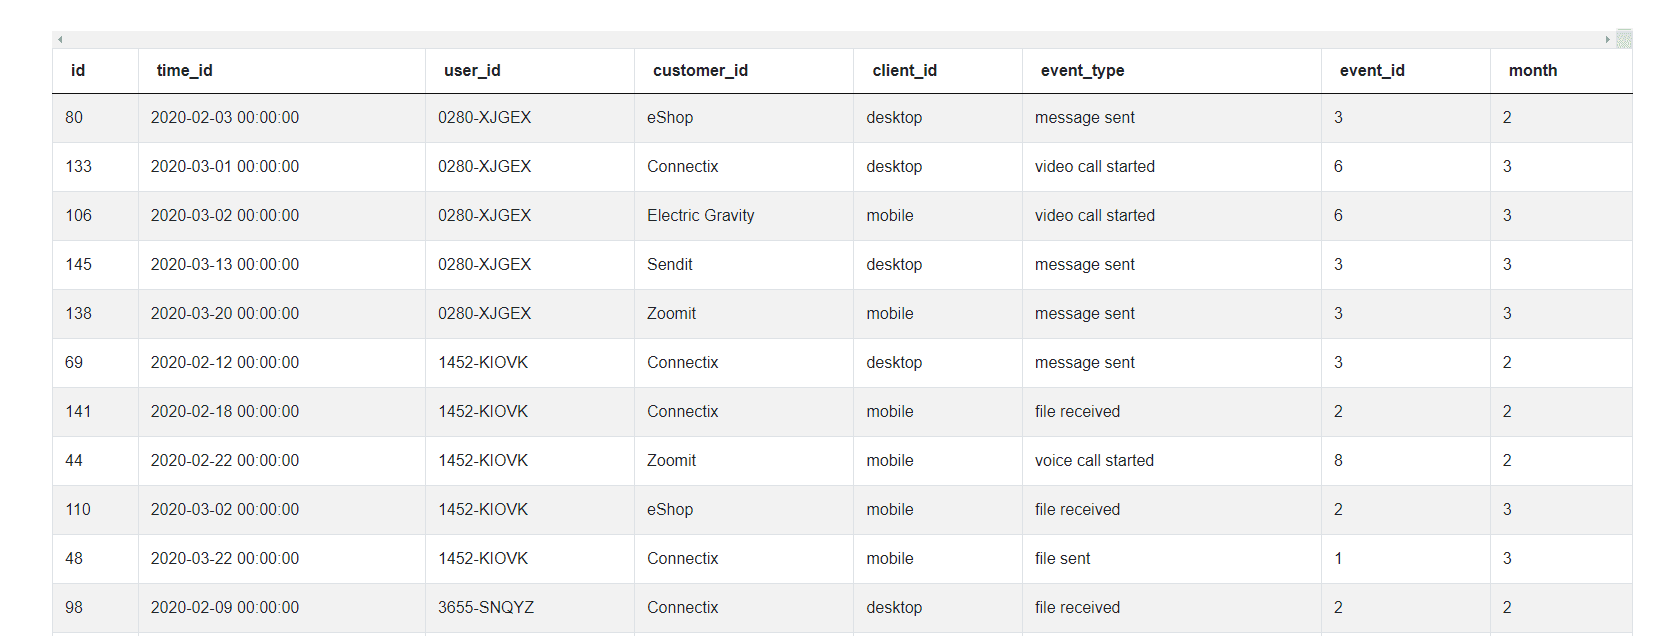
2. Identify new users
a. Suppose you are going through this spreadsheet row by row. You want to manually tag the first user.
b. The way you will accomplish this is to check if it is the first instance of the user in the sheet. If it is, then you will tag new_user = 1, else it will be 0.
c. To do this in Python Pandas – we can use the groupby() option and create a running count.
# Import your libraries
import pandas as pd
# Sort the data by user_id, month and time_id
usage_df = fact_events.sort_values(by = ['user_id','time_id'])
# Extract Month from the date
usage_df['month'] = usage_df['time_id'].dt.month
# Groupby and get running count
usage_df['new_users'] = usage_df.groupby(by= ['user_id'], as_index =
False).cumcount()
usage_df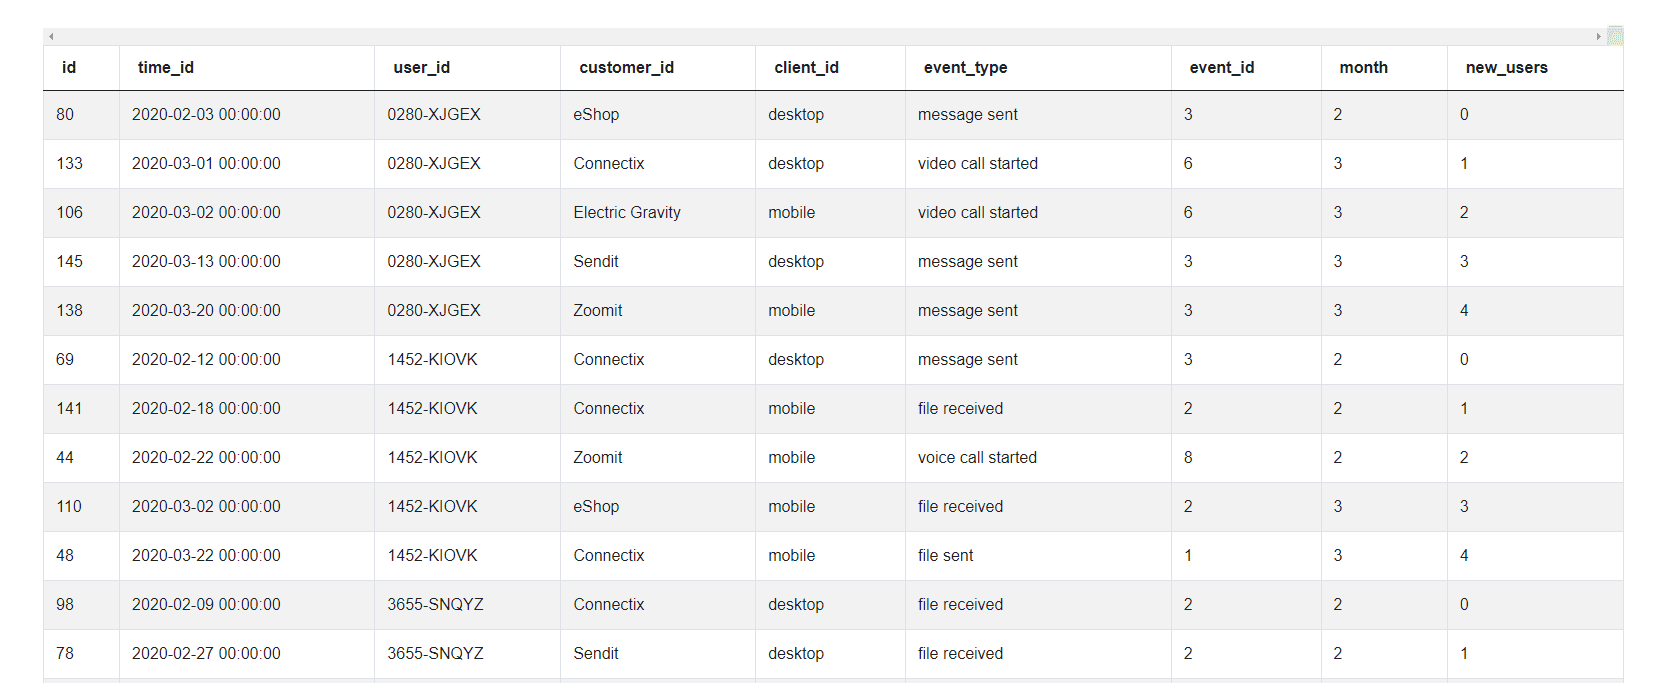
d. Pandas starts indexing from 0, since we need only the very first transaction, we tag as True where the count equals zero and the others as False and convert that to integer. This can all be done in one step using method chaining.
# Import your libraries
import pandas as pd
# Sort the data by user_id, month and time_id
usage_df = fact_events.sort_values(by = ['user_id','time_id'])
# Extract Month from the date
usage_df['month'] = usage_df['time_id'].dt.month
# Groupby and get running count - tag the first instance
usage_df['new_users'] = (usage_df.groupby(by= ['user_id'], as_index =
False).cumcount() == 0).astype('int')
usage_df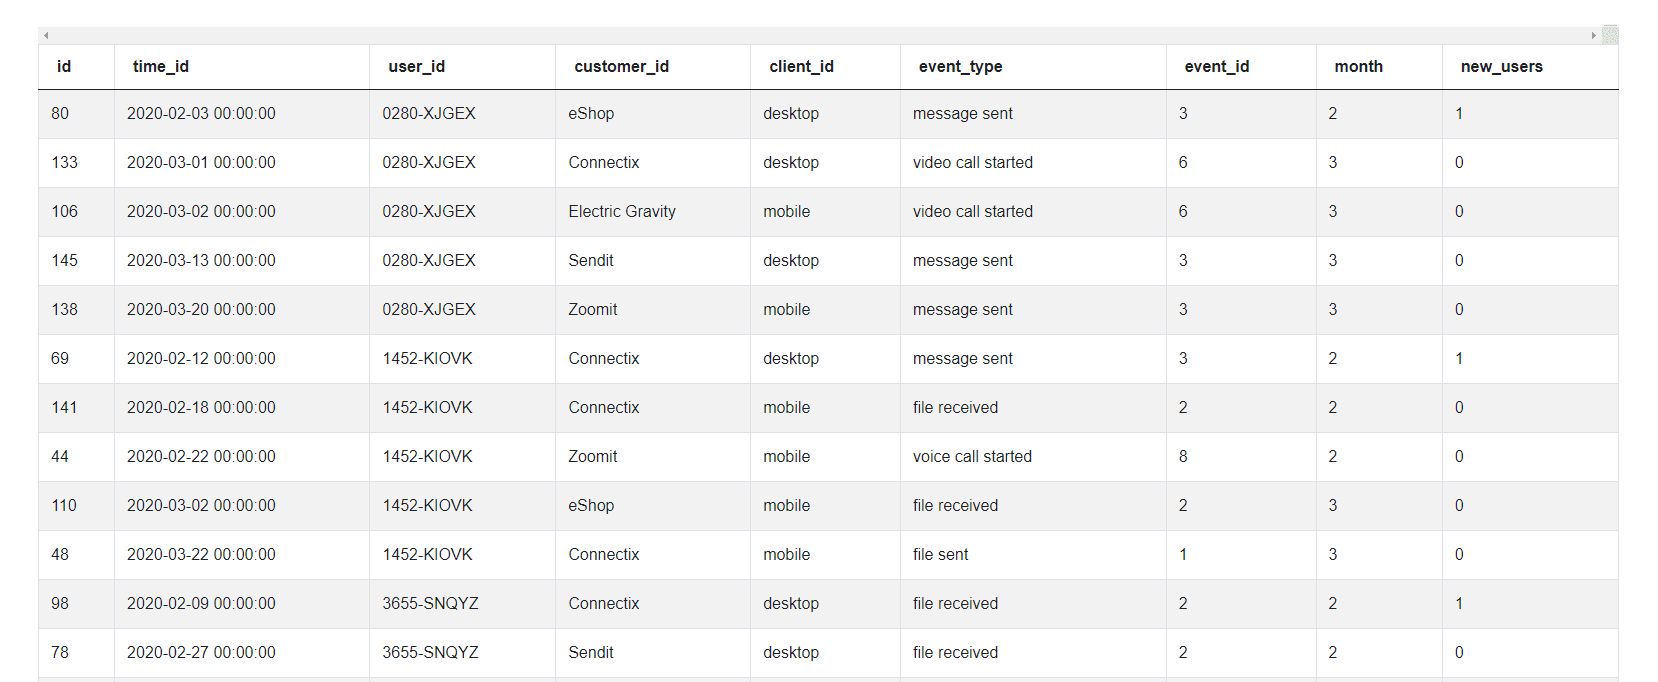
3. Identify distinct users in each month
a. This is like the previous step. But now we do it grouping by user_id and month to identify the first instance of a user for each month.
# Import your libraries
import pandas as pd
# Sort the data by user_id, month and time_id
usage_df = fact_events.sort_values(by = ['user_id','time_id'])
# Extract Month from the date
usage_df['month'] = usage_df['time_id'].dt.month
# Groupby and get running count - tag the first instance
usage_df['new_users'] = (usage_df.groupby(by= ['user_id'], as_index =
False).cumcount() == 0).astype('int')
# Groupby and get running count - tag the first instance each month
usage_df['monthly_users'] = (usage_df.groupby(by= ['user_id', 'month'],
as_index = False).cumcount() == 0).astype('int')
usage_df4. Summarize the new users and distinct users by month. And, voila, we get the Table 1 that we needed.
# Import your libraries
import pandas as pd
# Sort the data by user_id, month and time_id
usage_df = fact_events.sort_values(by = ['user_id','time_id'])
# Extract Month from the date
usage_df['month'] = usage_df['time_id'].dt.month
# Groupby and get running count - tag the first instance
usage_df['new_users'] = (usage_df.groupby(by= ['user_id'], as_index =
False).cumcount() == 0).astype('int')
# Groupby and get running count - tag the first instance each month
usage_df['monthly_users'] = (usage_df.groupby(by= ['user_id', 'month'],
as_index = False).cumcount() == 0).astype('int')
# Roll up by month to get the summary dataframe
summ_df = usage_df[['month', 'new_users', 'monthly_users']].groupby
(by = ['month'], as_index = False).sum()
summ_df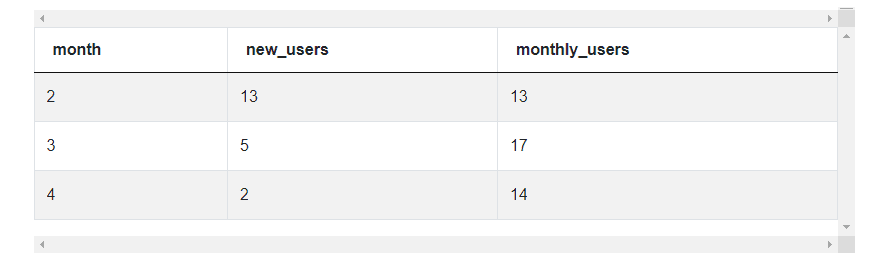
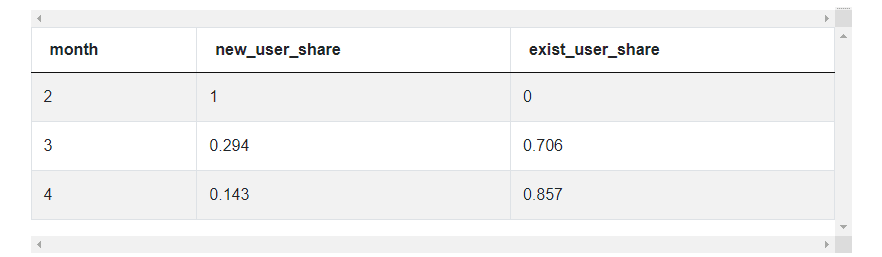
5. Calculate the new user share and existing user share metrics
a. We can now calculate the metrics and drop the columns not needed for the final output.
# Import your libraries
import pandas as pd
# Sort the data by user_id, month and time_id
usage_df = fact_events.sort_values(by = ['user_id','time_id'])
# Extract Month from the date
usage_df['month'] = usage_df['time_id'].dt.month
# Groupby and get running count - tag the first instance
usage_df['new_users'] = (usage_df.groupby(by= ['user_id'], as_index =
False).cumcount() == 0).astype('int')
# Groupby and get running count - tag the first instance each month
usage_df['monthly_users'] = (usage_df.groupby(by= ['user_id', 'month'],
as_index = False).cumcount() == 0).astype('int')
# Roll up by month to get the summary dataframe
summ_df = usage_df[['month', 'new_users', 'monthly_users']].groupby(by =
['month'], as_index = False).sum()
# Calculate final metrics
summ_df['new_user_share'] = summ_df['new_users'] / summ_df['monthly_users']
summ_df['exist_user_share'] = 1 - summ_df['new_user_share']
summ_df = summ_df[['month', 'new_user_share', 'exist_user_share']]
summ_df- The dataset has already been loaded as a pandas.DataFrame.
- print() functions and the last line of code will be displayed in the output.
- In order for your solution to be accepted, your solution should be located on the last line of the editor and match the expected output data type listed in the question.
Optimization
Python Pandas is built on top of the NumPy Library. NumPy library specifically designed to perform vectorized operations in a jiffy. In simple terms, instead of iterating over a list or other Python iterables item by item using a for loop, NumPy and by extension Pandas can perform the same operation over an entire column in one shot. Think of it like creating a formula in a spreadsheet and then propagating it to the entire sheet. To take advantage of Pandas, we need to work in a slightly different manner compared to SQL queries. It is generally good practice to use aggregate functions to roll up data as you would with a pivot table.
What should one look for? Low hanging fruits are vectorization and method chaining. In fact we should use a separate statement only when we are creating new variables (columns) in the dataframe.
For our solution:
- We have used built-in groupby functions to speed up tagging the first instance.
- We have also used method chaining to perform as many operations as possible in a single step
- We used Boolean Masking to speed up filtering rows
Check out our previous post Microsoft Data Analyst Interview Questions which is focused exclusively on SQL perspective to solve this Microsoft data scientist interview question.
Additional Microsoft Data Scientist Interview Questions
Microsoft Data Scientist Interview Question #1: Users Exclusive Per Client
Users Exclusive Per Client
Write a query that returns a number of users who are exclusive to only one client. Output the client_id and number of exclusive users.
You can solve this Microsoft data scientist interview question here https://platform.stratascratch.com/coding-question?id=2025&python=
Dataset
This is one of the easy level Microsoft data scientist interview questions. This problem uses the same fact_events dataset used in the previous problem. This problem is easier than the one we discussed. This real-life Microsoft Data Scientist interview question can be solved using groupby() and drop_duplicates() methods.
Approach
- Identify number of clients used per user_id for each unique combination of client_id and user_id
- For this group of users, summarize the fact_events table by client_id counting the number of user_ids for each unique combination of client_id and user_id
Microsoft Data Scientist Interview Question #2: Bottom 2 Companies By Mobile Usage
Bottom 2 Companies by Mobile Usage
Write a query that returns a list of the bottom 2 companies by mobile usage. Mobile usage is defined as the number of events registered on a mobile client_id. Order the result by the number of events ascending.
In the case where there are multiple companies tied for the bottom ranks (rank 1 or 2), return all the companies
You can solve this Microsoft data scientist interview question here https://platform.stratascratch.com/coding-question?id=2026&python=1
Dataset
This problem uses the same fact_events dataset used in the previous problem. This problem is similar in difficulty level to the previous problem however the manipulations required as slightly different. This real-life Microsoft Data Scientist question can be solved using groupby() and rank() functions – invoking the method = ‘dense’ option.
Approach
- Subset the dataframe for client_id = ‘mobile’. Aggregate the subset by customer_id counting the number of instances
- Create a rank variable (column) based on the rank. Use method = ‘dense’ option to ensure contiguous ranks.
- Subset the aggregate datasets for rank <= 2, sorting the resultant dataframe by the count of event_id
Check out our previous post Microsoft SQL Interview Questions where we have discussed the SQL approach to solving this question.
Microsoft Data Scientist Interview Question #3: Top Company Where Users Use Desktop Only
Top Company Where Users Use Desktop Only
Write a query that returns the top company in terms of events where users use desktop only.
You can solve this Microsoft data scientist interview question here https://platform.stratascratch.com/coding-question?id=2027&python=1
Dataset
This problem too uses the same fact_events dataset used in the previous problems. This problem can be thought of as a combination of the previous two problems. This real-life Microsoft Data Scientist question can be solved using groupby(), drop_duplicates(), isin() and rank() methods.
Approach
- Identify the Desktop users who use only one client
- Aggregate these events attended by these users grouping by company (customer_id)
- Find the company with the highest number of users using the rank() method
Conclusion
In this article, we have discussed in detail an approach to solving one of the real-life Microsoft Data Scientist interview questions using Python. The question needed you to break down the problem into smaller parts and working backwards to transform the given dataframe to the one that was needed in the last one but step. Optimization of this problem needed you to use method chaining and vectorized operations. Knowledge of these techniques can impress the interviewer and differentiate you from the rest of the field.
This can be accomplished with practice of solving a variety of problems. Join our platform to practice more such data science interview questions from companies like Facebook, Amazon, Microsoft, Netflix and more. We have a community of over 20,000 aspiring data scientists seeking to improve their coding skills, prepare for interviews, and jump start their careers.
Share