How to Use Python Lambda Functions


A comprehensive exploration of Python lambda functions: advanced techniques for efficient data analysis in socio-economic and demographic studies
"Code is like humor. If you need to explain it, it's not good." This sums up Python lambda functions. They're short, powerful, and clear.
Lambda functions in Python, also known as anonymous functions, offer a way to write functions in just one understandable line. They stand apart from regular functions in how they look and how we use them.
In this article, we go into the Python lambda function, very easily at first. We'll then continue to analyzing socio-economic and demographic dataset, by using lambda function with three different advanced functions.
Let's start with baby steps!
Understanding Python Lambda Functions Syntax
In Python, a lambda function often can be called as anonymous function, not named, can be created in a single line, like this.
lambda x: x**2Unlike typical functions, it will give you the result of this expression right away without using a return statement, like below.
squared = lambda x: x**2
squared(3)
Here is the output.


Comparison Between Lambda and Regular Functions in Python
Lambda functions and regular Python functions vary in a few ways.
First, lambdas are limited to one expression. This makes them less flexible but more straightforward than regular functions.
Regular functions, created with def, can include many expressions and statements. But lambdas focus on simplicity and single-use scenarios. Let’s recreate the same thing we did, squared, with regular functions.
def squared_regular(x) :
    x = x**2
    return(x)
As you can see from above, recreating the regular function took 3 lines of codes, instead of one.
Here you can see the output is the same.
squared_regular(4)Here is the output.
Now, let’s see more complex examples.
Real Life Applications of Python Lambda Functions
In this section, we will use lambda function with three different functions, map filter and apply, on the socio-economic & demographic insights data. Here you can reach this data from Kaggle. In the following section, we will use lambda function to:
- Adjust GDP Growth: By applying lambda functions, we identified countries with the slowest economic growth, revealing potential employment and poverty challenges.( lambda function with map() )
- Urbanization Index: We used lambdas to create an index that combines urban growth with population density, offering a new perspective on urbanization.( Lambda Function with apply() )
- Highlight High Exporters: Lambda functions helped us find countries with high exports relative to their GDP, showing their strong ties to the global economy.( Lambda function with filter() )
Let’s start with Adjusted GDP Growth.
Lowest Adjusted GDP Growth - lambda function with map()


GDP growth rate is key to understanding economic health. For example, when GDP growth is low, it points to weak economic activities. This issue can lead to more unemployment, fewer chances for wage growth or job advancement, and possibly more poverty.
In countries with sluggish GDP growth, people often struggle with finding jobs, getting better pay, and moving up in their careers.
Let’s begin with loading the interpolated dataset, which contains various socio-economic indicators for different countries, where you can see and download it from here.


interpolated_data = pd.read_csv("path here")Now, let's tweak the GDP growth rates by a certain amount. We do this with the map() function and a lambda expression. This lambda is applied to every value in the GDPGrowth% column, multiplying each by a growth adjustment factor of 1.05.
growth_adjustment_factor = 1.05  # 5% increase
interpolated_data['Adjusted_GDPGrowth%'] = interpolated_data['GDPGrowth%'].dropna().map(lambda x: x * growth_adjustment_factor)
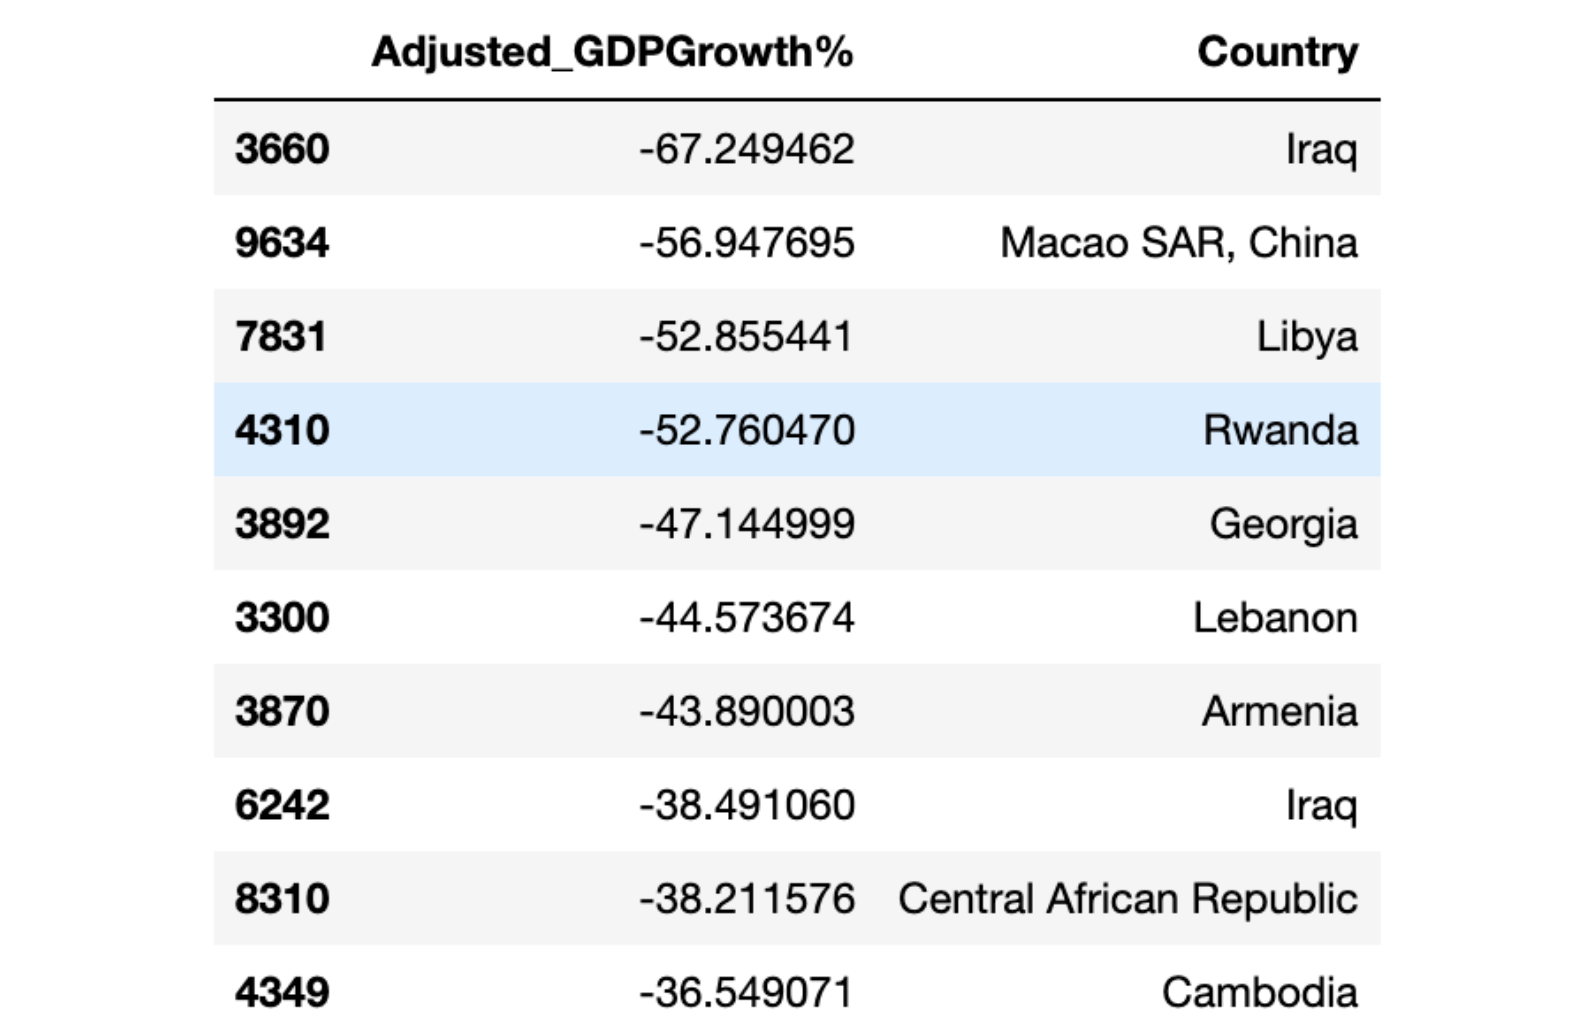
We then focus on finding the countries with the lowest adjusted GDP growth rates. To do this, we sort the dataset by the Adjusted_GDPGrowth% column in ascending order and select the top 10 entries. The use of dropna() ensures that only rows with valid GDP growth data are considered.
lowest_gdp_growth_data = interpolated_data[['Adjusted_GDPGrowth%', 'Country']].sort_values(by='Adjusted_GDPGrowth%', ascending=True).dropna().head(10)
Here is the output.

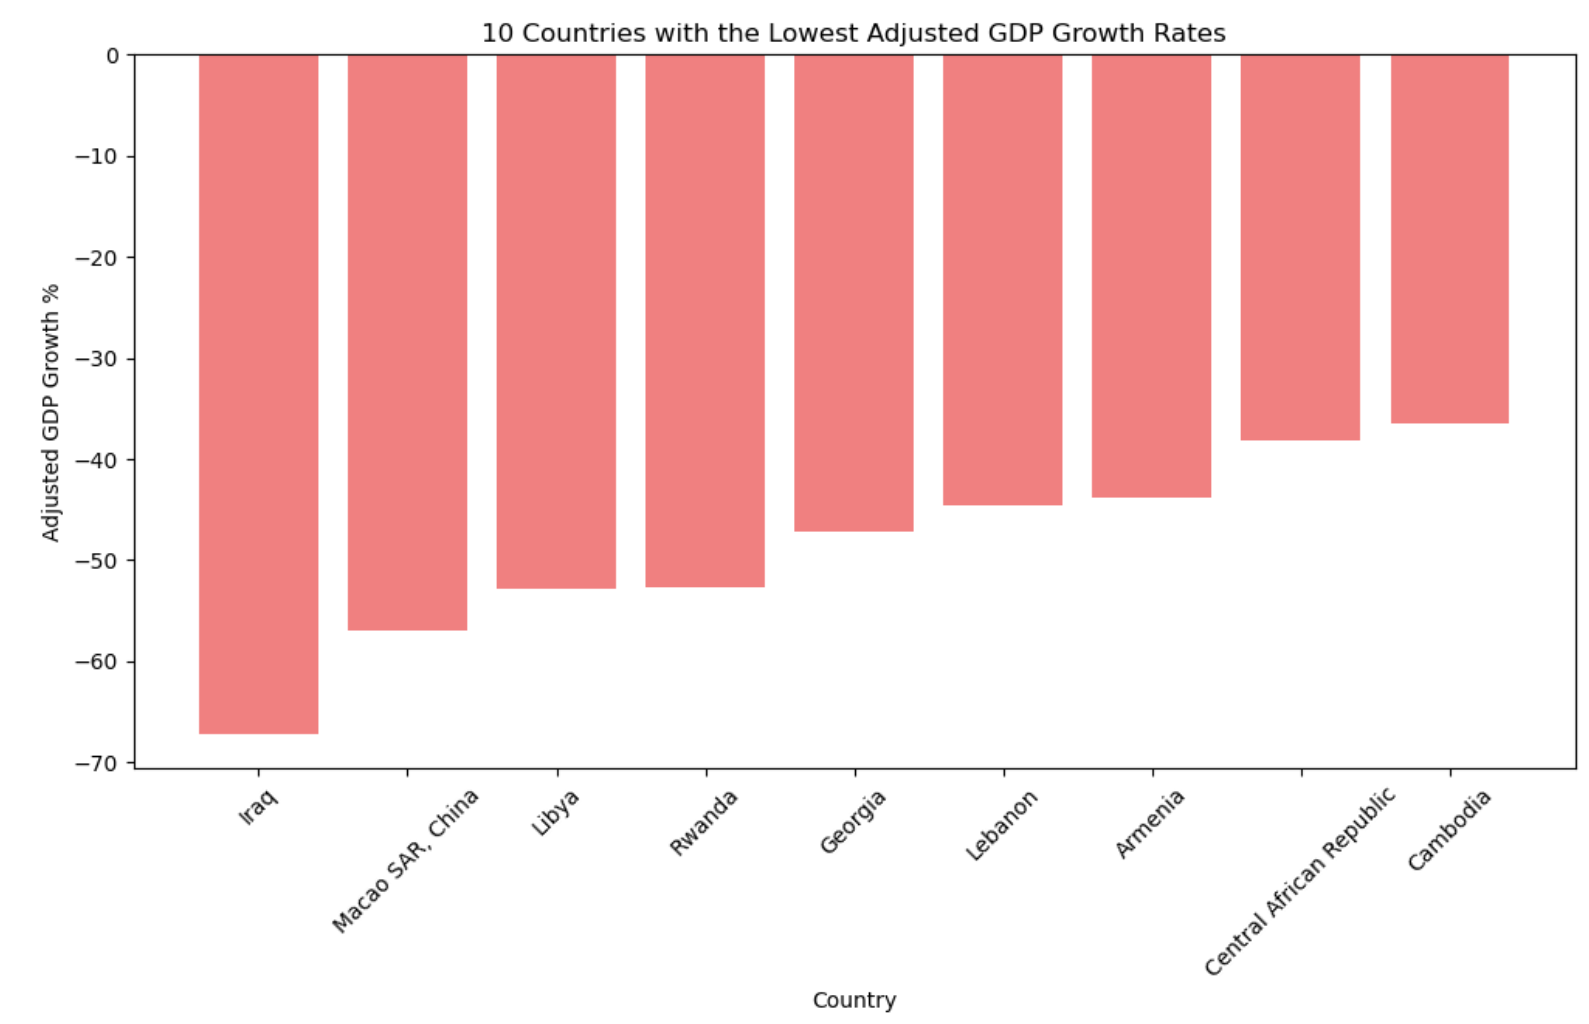
Finally, we create a bar graph to visually represent these 10 countries. This graph provides an immediate and clear perspective on the countries with the most sluggish adjusted GDP growth rates. The visualization is designed for easy interpretation, highlighting the countries and their respective adjusted growth rates.
plt.figure(figsize=(12, 6))
plt.bar(lowest_gdp_growth_data['Country'], lowest_gdp_growth_data['Adjusted_GDPGrowth%'], color='lightcoral')
plt.xlabel('Country')
plt.ylabel('Adjusted GDP Growth %')
plt.title('10 Countries with the Lowest Adjusted GDP Growth Rates')
plt.xticks(rotation=45)
plt.show()
Here is the output.

Creating an "Urbanization Index - Lambda Function with apply()

In our study of urbanization trends with global socio-economic and demographic data, we've created a special metric: the 'Urbanization Index.' We calculate this index by using Python lambda functions with the apply() method. It offers a detailed view of urban growth and how densely populated areas are.
The Urbanization Index measures how intensely different countries are urbanizing. It combines two important factors: how fast the urban population is growing and how many people live in a given area.
First, we'll find the highest values for urban population growth and population density in our dataset. We use these top values to normalize the data. This makes it possible to compare urbanization trends across different countries.
max_urban_growth = interpolated_data['UrbanPopGrowth%'].max()
max_density = imputed_data['PopDens'].max()
Now, we create lambda functions to normalize urban growth and population density figures. These functions check for any null values to guarantee accurate calculations. We use the map() function to apply these normalizations to the relevant columns in our datasets."
urban_growth_normalizer = lambda x: x / max_urban_growth if pd.notnull(x) else None
density_normalizer = lambda x: x / max_density if pd.notnull(x) else None

interpolated_data['Normalized_UrbanGrowth'] = interpolated_data['UrbanPopGrowth%'].map(urban_growth_normalizer)
imputed_data['Normalized_PopDens'] = imputed_data['PopDens'].map(density_normalizer)
The interpolated and imputed datasets are merged on the 'Country' column to align the normalized urban growth and population density data.
combined_data = pd.merge(
    imputed_data[['Country', 'Normalized_PopDens']],
    interpolated_data[['Country', 'Normalized_UrbanGrowth']],
    on='Country'
)
A new Python lambda function is defined to calculate the Urbanization Index for each country. This index is a product of normalized urban growth and population density. The apply() method is used to apply this calculation across the dataset.
urbanization_index = lambda row: row['Normalized_PopDens'] * row['Normalized_UrbanGrowth'] if pd.notnull(row['Normalized_PopDens']) and pd.notnull(row['Normalized_UrbanGrowth']) else None
combined_data['Urbanization_Index'] = combined_data.apply(urbanization_index, axis=1)
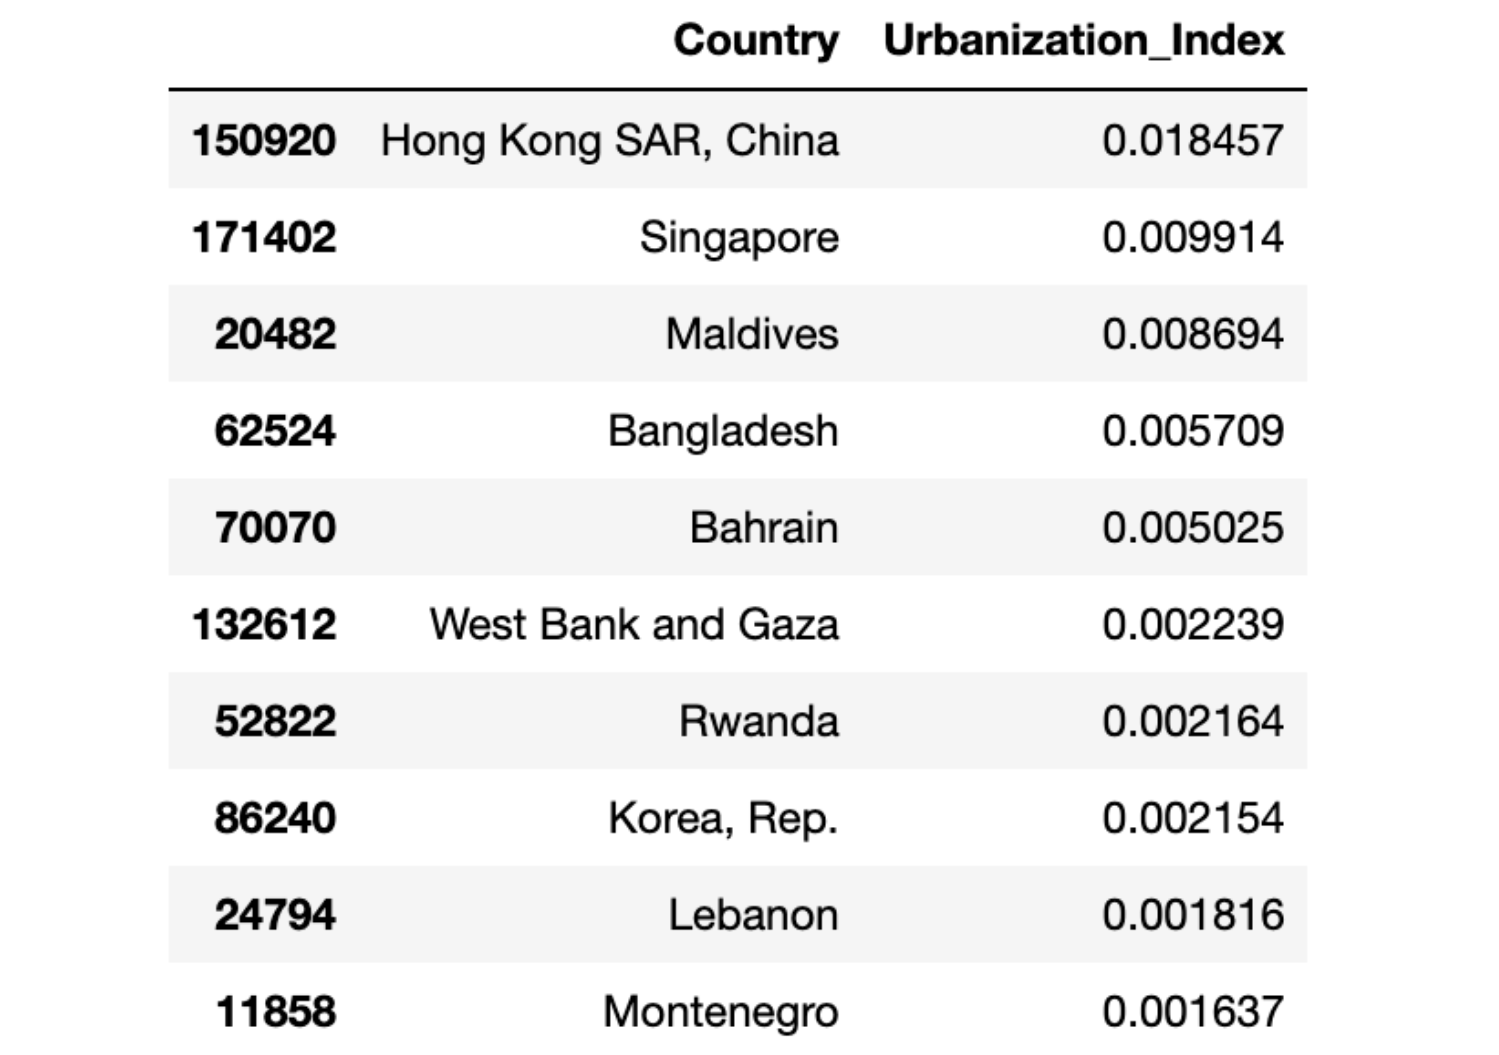
The dataset is then processed to identify the top 10 unique countries with the highest Urbanization Index, ensuring that each country is represented only once. And let’s see these countries afterwards.
unique_top_urbanization_index = combined_data[['Country', 'Urbanization_Index']].dropna().drop_duplicates(subset=['Country']).nlargest(10, 'Urbanization_Index')
unique_top_urbanization_index
Here is the output.

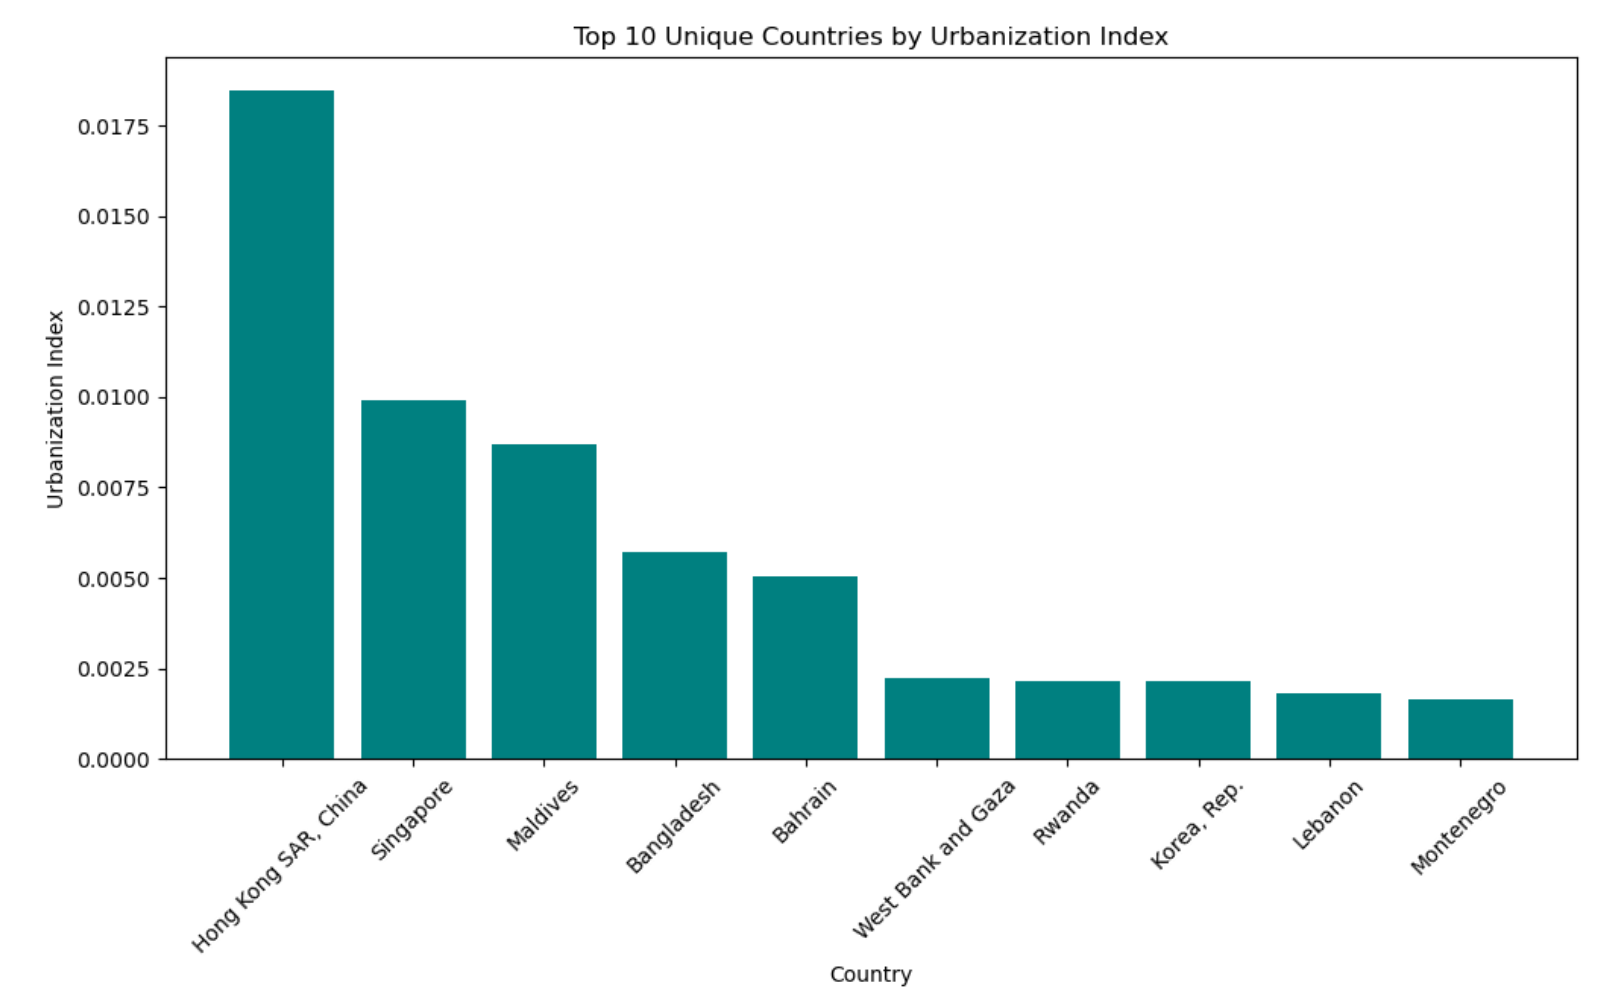
Once again, let’s visualize our findings.
plt.figure(figsize=(12, 6))
plt.bar(unique_top_urbanization_index['Country'], unique_top_urbanization_index['Urbanization_Index'], color='teal')
plt.xlabel('Country')
plt.ylabel('Urbanization Index')
plt.title('Top 10 Unique Countries by Urbanization Index')
plt.xticks(rotation=45)
plt.show()
Here is the output.

Top 10 Distinct High Exporting Countries - Lambda function with filter()

In our exploration of the global socio-economic dataset, we will identify the top 10 distinct countries with the highest exports as a percentage of their GDP. This analysis highlights countries where exports play a crucial role in the economy.
Our first step is to work out the average percentage of exports compared to GDP for all countries in the dataset. We'll use this average as a benchmark to find countries that are doing much better than average in terms of global export performance.
mean_export_percentage = interpolated_data['Exports%GDP'].mean()Now, we'll use the filter() function and a lambda expression to go through the dataset. We'll pick out countries where exports as a percentage of GDP are more than the mean we calculated. This step helps us find countries deeply connected to the global economy through their exports.
high_export_countries = list(filter(
    lambda x: x[1] > mean_export_percentage,
    zip(interpolated_data['Country'], interpolated_data['Exports%GDP'])
))
The result is then transformed into a DataFrame for ease of analysis and visualization:
high_export_countries_df = pd.DataFrame(high_export_countries, columns=['Country', 'Exports (% of GDP)'])
After finding these countries, we arrange them by their export percentages, from highest to lowest. We make sure each country shows up just once by removing duplicates. Then, we choose the top 10.
high_export_countries_df_sorted = high_export_countries_df.sort_values(by='Exports (% of GDP)', ascending=False).drop_duplicates(subset=['Country']).head(10)
Here is the output.


Let's picture our results in a bar graph. This will clearly show the countries with the biggest exports as a part of their GDP. By doing this, we can compare how these countries focus on exports in their economies.
plt.figure(figsize=(12, 6))
plt.bar(high_export_countries_df_sorted['Country'], high_export_countries_df_sorted['Exports (% of GDP)'], color='blue')
plt.xlabel('Country')
plt.ylabel('Exports (% of GDP)')
plt.title('Top 10 Distinct High Exporting Countries')
plt.xticks(rotation=45)
plt.show()
Here is the output.


Final Thoughts
Python lambda functions are a useful tool for data scientists and analysts. This article highlights the importance of theoretical understanding and its impact on practical applications, as demonstrated with socio-economic and demographic data.
These Python lambda functions, particularly when used with methods like map(), filter(), and apply(), streamline data manipulation and enhance its appearance. They simplify complex operations, making the code more powerful.
If you're interested in lambda functions and wish to delve deeper into data science, you can expand your knowledge by practicing interview questions, like these python interview questions, and tackling data projects on our platform. See you there!
FAQ’s
What is a lambda function in Python?
A lambda function is an anonymous function expressed as a single statement. You can use it to perform simple operations without the need for formally defining a function.
When should I use a lambda in Python?
Lambda functions are handy when you need a small function for a short duration, particularly as arguments to higher-order functions like map(), filter(), and reduce().
Can a lambda function have multiple arguments?
Yes, a lambda function can have any number of arguments, but it can only have one expression.
What are the limitations of Python lambda functions?
Python lambda functions are limited to single expressions and cannot contain commands or multiple expressions. They also cannot have a docstring and lack a function name.
Can I use lambda functions with Python's built-in functions?
Absolutely, lambda functions are often used with built-in functions like sorted(), map(), filter(), and more, where they can be passed as a key function or a callback.
Latest Posts:


Share