How to Use cumsum() to Solve Python Optimization Questions


Categories:
 Written by:
Nathan Rosidi
This very interesting Python interview question from Goldman Sachs is a good example of a large family of data science interview questions that concern optimization.
Learn how the cumulative sum operator can be used to solve such questions.
Python Optimization Question
Minimum Number of Platforms
The title of this question is Minimum Number of Platforms and it says that we are given a day worth of scheduled departure and arrival times of trains at one train station. It is further specified that one platform can only accommodate one train from the beginning of the minute it's scheduled to arrive until the end of the minute it's scheduled to depart. We are then being asked to find the minimum number of platforms necessary to accommodate the entire scheduled traffic.

Link to the question: https://platform.stratascratch.com/coding/2082-minimum-number-of-platforms
It is a hard question because it’s not easy to figure out how to extract the minimum number of platforms from a train timetable. This is further complicated by the fact that the data are spread across two different tables. The key problem is devising a solution that is not only correct but also efficient and fast - this is something the use of cumulative sum can help us achieve.
Understand your data
It’s always good to start solving an interview question by understanding the provided data. At an actual interview, you would commonly only see the high-level description of the tables and their columns so it is more about understanding the structure of the data rather than seeing the actual records.
train_arrivals
| train_id | int64 |
| arrival_time | datetime64[ns] |
train_departures
| train_id | int64 |
| departure_time | datetime64[ns] |
As already mentioned, the data for this question are spread across two tables but let’s see exactly what is happening here. There are two very simple tables, each with only two columns. The first table represents train arrivals and so we have the ID of each train and the time when it arrives at our station. Analogically, the second table represents the train departures and it has the ID of the train again and the time symbolizing the moment of departure.
The question specifies that one platform can only accommodate one train from the beginning of the minute it's scheduled to arrive until the end of the minute it's scheduled to depart, so we can assume that the times in both tables are only hours and minutes, such as we would expect from a standard train timetable.
Using Cumulative Sum to Solve this Python Optimization Problem
Before we start writing the code, let’s see what approach can be taken to solve this Python interview question. There are actually multiple possible approaches. Since this is only 1 day worth of data, we could loop through all the seconds of the day virtually simulating the entire timeline, for each moment of the day count the number of platforms needed and in the end select the highest value. Another solution could be iterating through the datasets twice such that for each train we would get a list of all other trains that overlap with it and use the size of the largest list as the answer. However, both of these approaches are overcomplicated and computationally expensive.
In this article, you will learn a much shorter and more efficient solution that can solve this and other similar optimization problems using the cumulative sum. The cumulative sum sometimes called running total, is a mathematical operation that, for a sequence of numbers, returns another sequence of the same length in which a value k is the sum of the elements 1 through k from the original sequence.
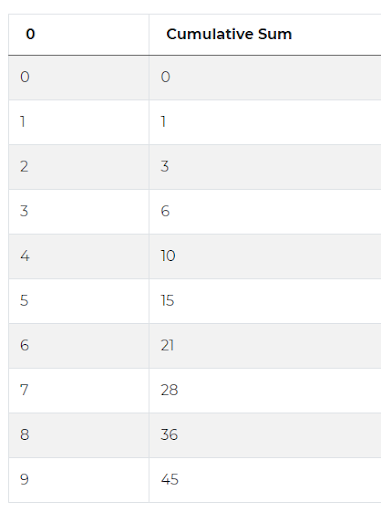
In Python, the cumulative sum is an operation we can apply to a dataset using a function cumsum() from the Pandas library. To give you an example, the code below creates an empty DataFrame, that’s what we call a table of data in Pandas and using a range function adds one column filled with values from 0 to 9.
numbers = pd.DataFrame(range(10))Then, we can create a new column that will return the cumulative sum of this sequence of numbers. This is done by applying the function cumsum() to the original sequence.
numbers['Cumulative Sum'] = numbers.cumsum()
numbers

The order of the original sequence is very important because this also determines the order in which the sums are calculated in the cumulative sum. Run the code below to see what happens if we add a new column with the same numbers as before but in the reversed order and apply the cumulative sum to this new column.
import pandas as pd

numbers = pd.DataFrame(range(10))
numbers['Cumulative Sum'] = numbers.cumsum()
numbers['reversed'] = list(reversed(range(10)))
numbers['Cumulative Sum 2'] = numbers['reversed'].cumsum()
numbers
What’s more, when we include both positive and negative values in our original sequence, the result of the cumulative sum will be a sequence of both increasing and decreasing values. Replace the code from the editor above with the following 3 lines of code to see the output:
numbers = pd.DataFrame([2,3,-5,3,-8,-2,7])
numbers['Cumulative Sum'] = numbers.cumsum()
numbers
This case becomes really useful in optimization tasks such as this Python optimization question and whenever we need to analyse a number that changes in time, be it a number of trains at a station or number of employees in a company.
We can therefore use it to solve this interview question from Goldman Sachs. But before we can actually apply the cumsum() function to the dataset, we need to create a new column that will be our base sequence for the cumulative sum. So the first step of solving this problem will be data preparation.
To be specific, we can mark all arrivals of trains with a number 1 and all departures with a number -1. Since arrivals and departures are still in two different tables, we can append one table to the bottom of the other to create sort of a timetable.
At this point, we will be left with a long list of arrivals and departures of trains. Each row will represent one arrival or departure and will be marked with a value of either 1 or -1. Can you already see how these 1 and -1 values can help us solve this question? Since each value of 1 denotes one more train at the station and each value -1 denotes one train less, we can apply the cumulative sum to see how the number of trains at the station changes throughout the day and extract the highest number of trains at the station.
But before we can apply the cumsum() function to this column, there’s one more issue to take care of. As I’ve shown you, ordering is very important when using cumulative sum so let’s sort our dataset before moving on. Since we’re interested in seeing how the number changes in time, we will need to sort all arrivals and departures chronologically, using the time column.
Only now will we be able to apply the cumsum() function. Once again, the cumulative sum will tell us, for each timestamp from our table, how many trains are at the station at this moment. And from there, extracting the solution becomes trivial. The cumulative sum result basically symbolizes how many platforms are needed. This number fluctuates throughout the day as the trains arrive and depart. So to find the minimum number of platforms we just need to select the maximum value from the cumulative sum.
Code Execution

Once we have defined all these high-level steps, it is time to turn them into the Python code that will actually return this minimum number of platforms. The first step is to mark arrivals with 1s and we can achieve it by taking the DataFrame, or table, train_arrivals and creating a new column in it, let’s call it ‘marks’. This column needs to have a value of 1 in each row but in Python, it’s enough to write that it should be equal to 1.
train_arrivals['mark'] = 1
train_arrivals
Once you execute this code, the result has a new column filled with values 1 - exactly as we expected. Next, we can do a very similar thing to mark departures with -1s. This time, let’s take the train_departures DataFrame, and again, add a column to it. The name of this column needs to be the same as the one in train_arrivals - there we used ‘marks��’ so we need to use it here as well. Then, it’s enough to add that this should be equal to -1. Paste the following code in the code editor above to see the result.
train_departures['mark'] = -1
train_departures
Before we can append the two DataFrames, we need to ensure that in both of them all the column names are the same. And it’s almost the case except for the columns arrival_time and departure_time which have different names. So before moving on, we’ll need to rename these two columns so that they have the same name. Since these columns are still in two different DataFrames, we will need two similar lines to change their names one at a time. To do this, we can apply the Pandas rename() function inside of which we need to specify that we want to deal with column names specifically. We can then use the key-value syntax that you may know from Python dictionaries, saying that the current name arrival_time should be replaced with another one, let’s say ‘time’. The same logic can then be applied to change the column name in the train_departures table.
train_arrivals = train_arrivals.rename(columns={'arrival_time': 'time'})
train_departures = train_departures.rename(columns={'departure_time': 'time'})
Now we are ready to append one table to another. This may sound complicated but it’s actually a simple operation of taking rows from one DataFrame and adding them at the bottom of another DataFrame. And in Python we can simply use the append() function like this, specifying the first DataFrame outside of the function and the second DataFrame as its parameter. Since this will result in all the arrivals and departures being in a single DataFrame, let’s call it ‘timetable’.
# Mark arrivals with 1s
train_arrivals['mark'] = 1
# Mark departures with -1s
train_departures['mark'] = -1

# Match column names in both DataFrames
train_arrivals = train_arrivals.rename(columns={'arrival_time': 'time'})
train_departures = train_departures.rename(columns={'departure_time': 'time'})

# Append one table to another
timetable = train_arrivals.append(train_departures)
Right now in our DataFrame ‘timetable’, we first have all the arrivals and then all the departures. So the next step is to sort the events chronologically. To do this, we can use the Pandas sort_values() function. Inside the parentheses, we can specify that we want to sort by time column and in ascending order - this is equivalent to saying from oldest to latest times, or simply, chronologically. Add the following code to the code editor above to see how the order of the rows changes.
timetable = timetable.sort_values(by='time', ascending=True)Here, it’s important to mention one more thing. There may be cases when one train arrives and one train departs at the same time. This happens, for example, at 8:10. In these cases, we need to make sure that these events are also ordered correctly because otherwise, the result may be different. In this case, the question says that one platform can only accommodate one train from the beginning of the minute it's scheduled to arrive until the end of the minute it's scheduled to depart. This means that we can imagine the arriving train coming to the station at 8:10:00 and the departing train leaving the station at 8:10:59.
Therefore, the rows with arriving trains should always be before the rows with departing trains in such situations. To reflect this, we could modify our sort_values() function to order by both time and marker. But it’s actually not necessary in our case. That’s because earlier we appended the train_departures DataFrame to the bottom of the train_arrivals DataFrame and this automatically sorted the arrivals before departures. That’s why even the order in which we append DataFrames can sometimes be important.
Moving on with our solution, now we can use our secret weapon and apply the cumulative sum to the ‘mark’ column. Again, in Python, we can use the function cumsum() and apply it to a column like this. We can store the result of the cumulative sum in a new column, let’s call it ‘n_trains’ as it symbolizes the number of trains at the station at each time when this number changes.
timetable['n_trains'] = timetable['mark'].cumsum()
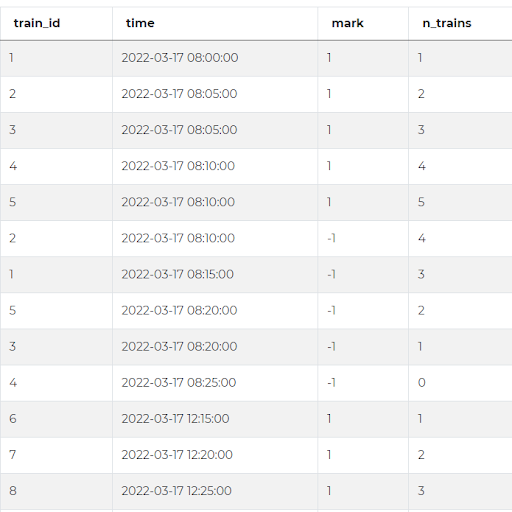
When we run this code, you can see the new column with the cumulative sum. This sum increases whenever a train arrives at the station and decreases with every departing train, as we would expect it. This also shows how many trains there are at the station.
Since according to the question, one platform can accommodate only one train, the minimum number of platforms necessary to handle this train traffic will be equal to the highest number of trains being at the station at the same time. Or in other words, to the maximum value in the n_trains column. To extract it, we can simply use the max() function and this is the full solution and answer to this Python interview question.
# Mark arrivals with 1s
train_arrivals['mark'] = 1
# Mark departures with -1s
train_departures['mark'] = -1

# Match column names in both DataFrames
train_arrivals = train_arrivals.rename(columns={'arrival_time': 'time'})
train_departures = train_departures.rename(columns={'departure_time': 'time'})

# Append one table to another
timetable = train_arrivals.append(train_departures)

# Sort the events chronologically
timetable = timetable.sort_values(by='time', ascending=True)

# Calculate cumulative sum from 1 and -1 values
timetable['n_trains'] = timetable['mark'].cumsum()

# Select maximum value from cumulative sum
result = max(timetable['n_trains'])
Conclusion
In this article, you could learn how to use the cumulative sum for solving optimization problems in Python. This is only one possible solution to this problem, but as mentioned, there are also other approaches and solutions. Our advice is to practice answering the interview questions by constructing solutions to them but always try to think of other ways to solve them, maybe you’ll come up with a more efficient or more elaborate approach. Remember also that this question is only an example of a wide range of optimization problems, many of which can be solved in a similar fashion.
If you want to practice more Python questions asked in Data Science Interviews at top companies like Amazon, Google, Microsoft, etc., check out our post on "Top 30 Python Interview Questions and Answers".
Share