How to Conduct a T-Test in R for Data Analysis

Categories:
 Written by:
Nathan Rosidi
Learn to run t-tests in R: check assumptions, interpret statistical results, and apply insights effectively to real-world data analysis projects.
You've got two groups of user conversion rates staring at you from a spreadsheet. One's from the control group, the other from your shiny new feature test. The question in your head: "Is this difference real, or is this noise?" Your answer can be addressed using a t-test. It is one of the most basic statistical tests.
Whether you are comparing means, validating A/B tests, or checking if a change actually made any difference, the t-test is your first line of statistical defense. In this article, we will start with the key terms you should know, analyze the assumptions, apply different t-tests with R, and examine case studies.
Next, we’ll review common pitfalls and related techniques, and finish with the frequently asked questions. Let’s start with the basics.
Key Terms You Should Know Before Running a T-Test in R
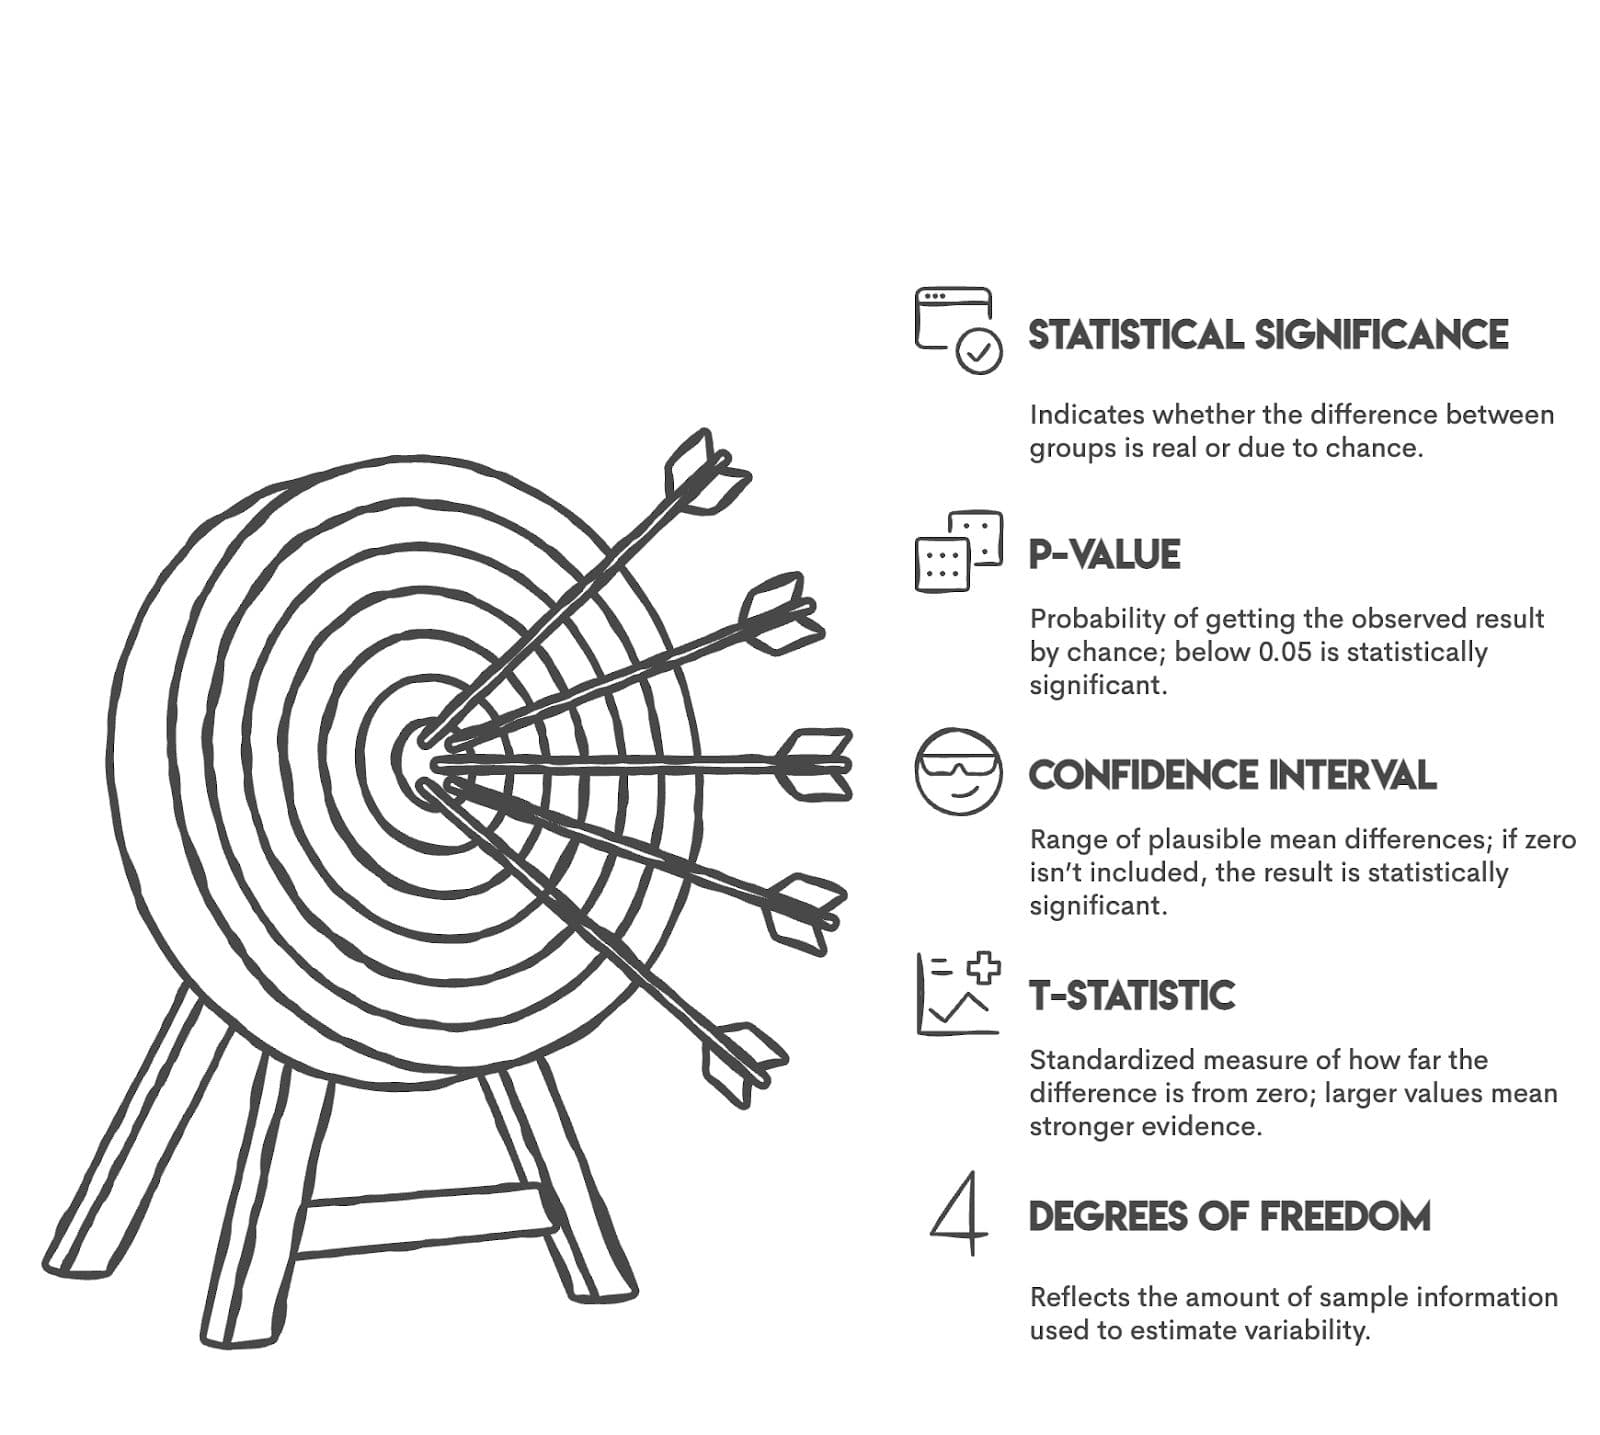
To understand this article better, here are the key terms to know.
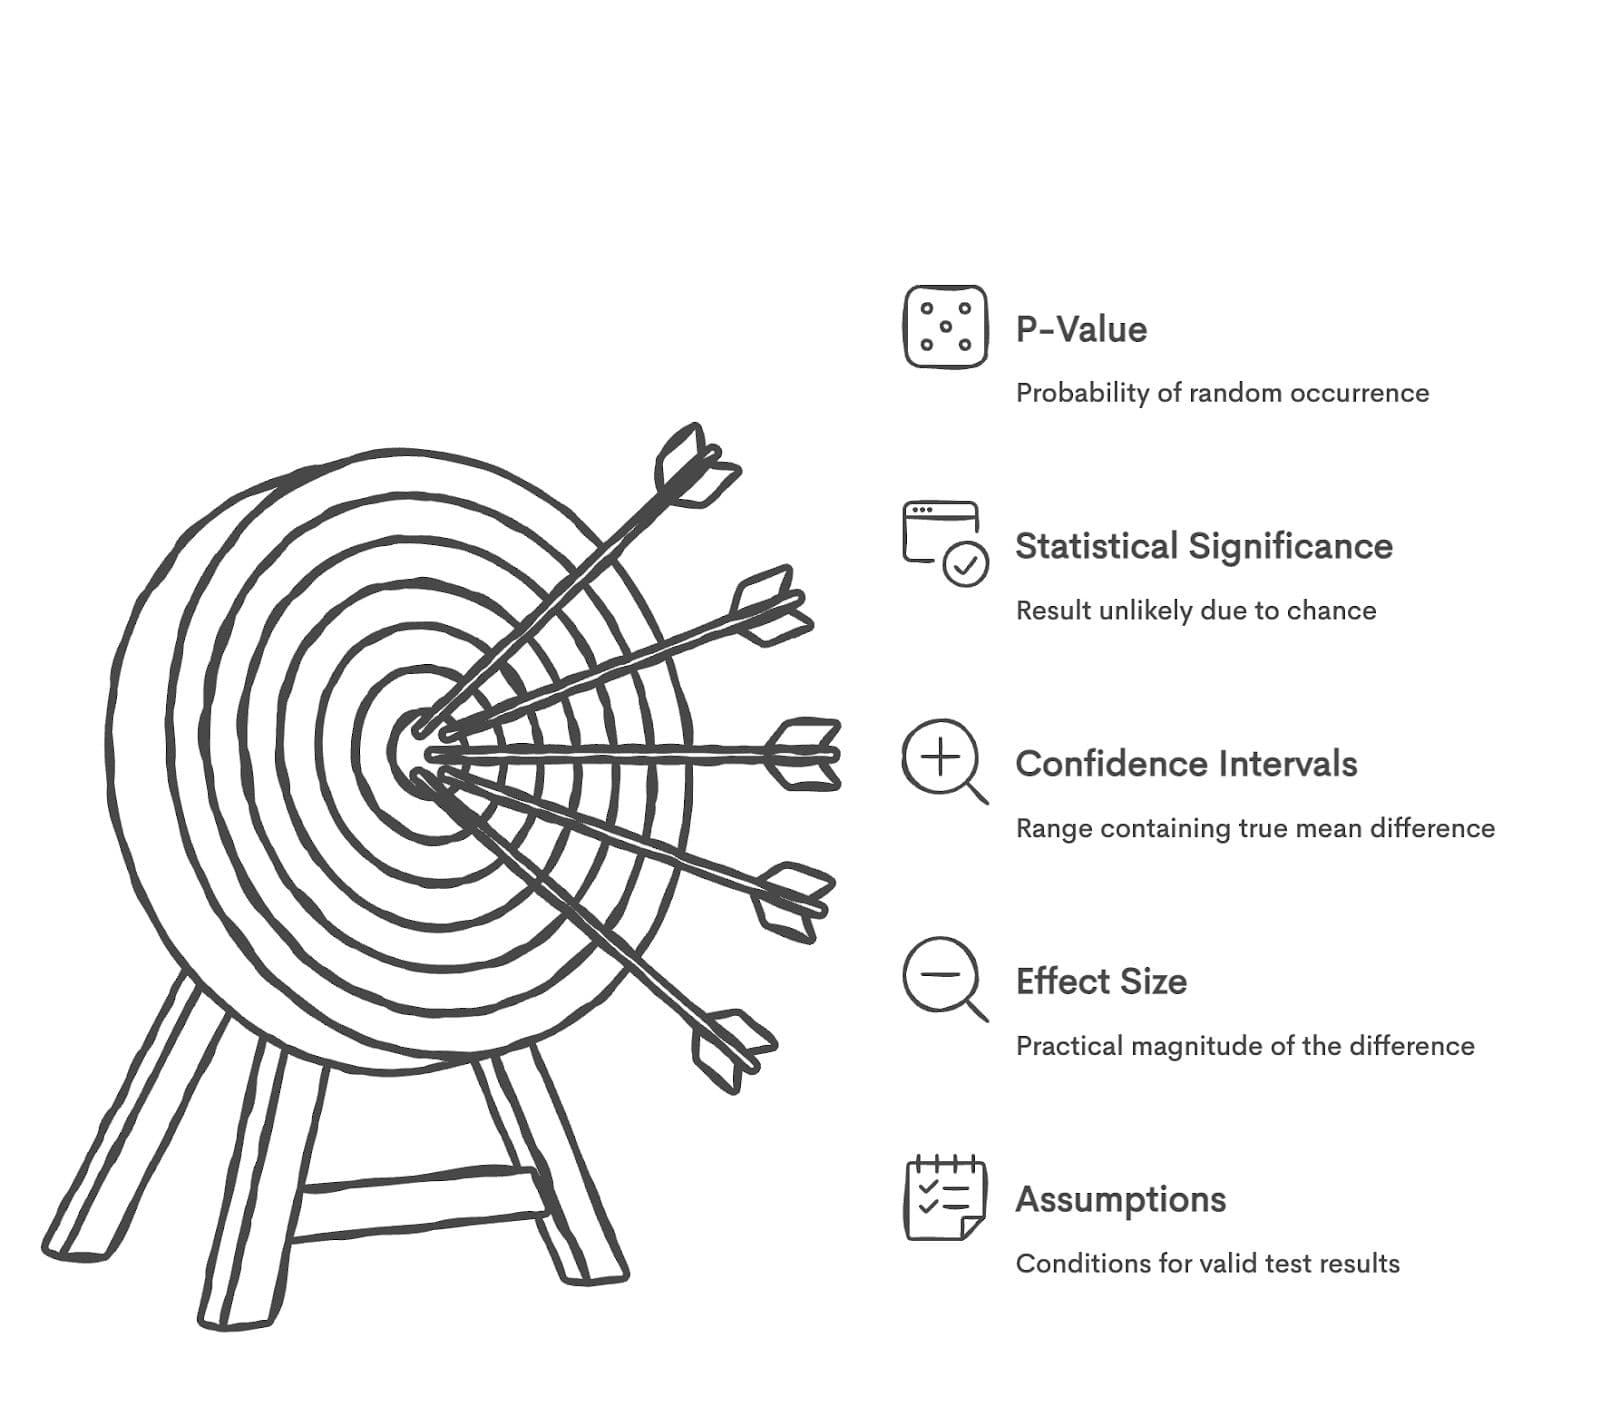
What is a t-test in R?
The t-test is a statistical technique that compares the means of two groups. If the results are statistically significant, you can make informed decisions based on them.
It is like asking whether the difference is due to random chance or is statistically significant.
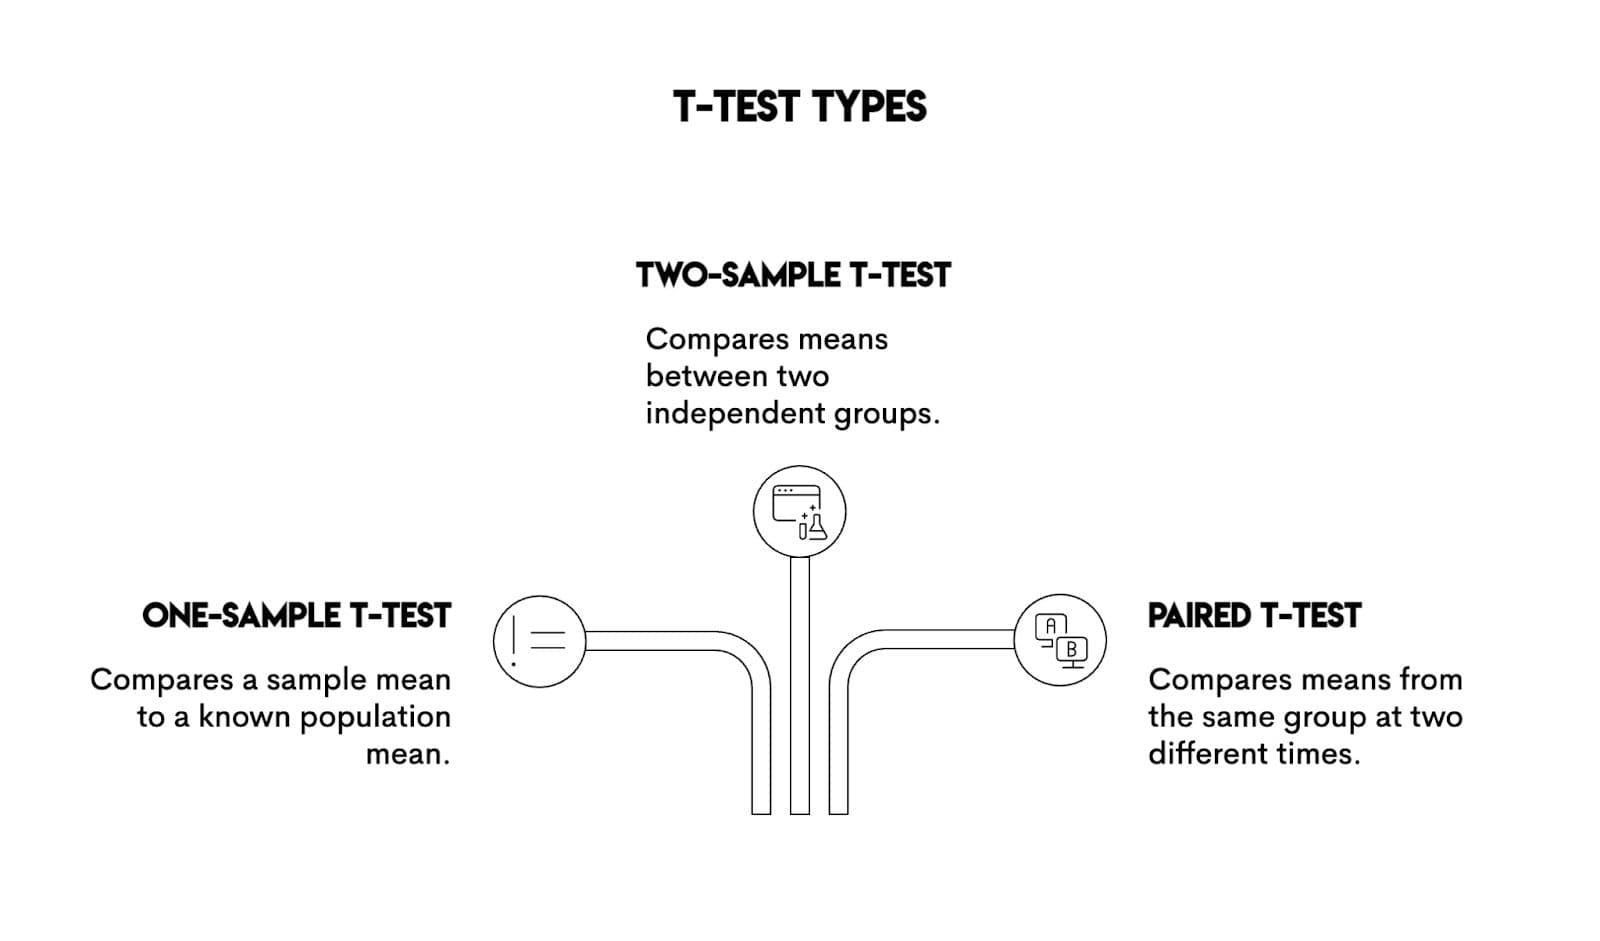
There are three common types of t-tests.
Getting Started: How T-Test in R Works
Let’s see how it works with R. We’ll use a student performance analysis project.
Link to this project: https://platform.stratascratch.com/data-projects/student-performance-analysis
In this project, the aim is to analyze a dataset and perform chi-square and t-tests. But in this article, we’ll just apply the t-test. Let’s check the columns in this data project we’ll use heavily (grades).
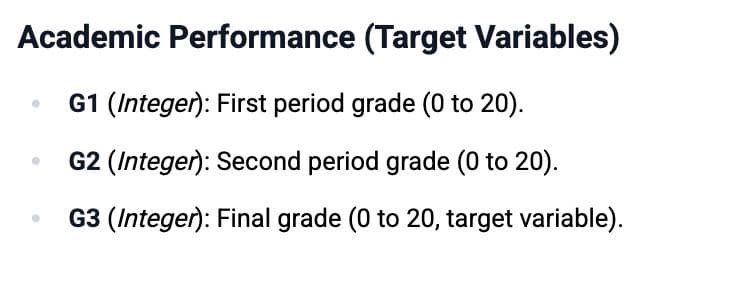
As you can see, there are three different grades from G1 to G3. G1 and G2 are the first- and second-period grades, and G3 is the final grade.
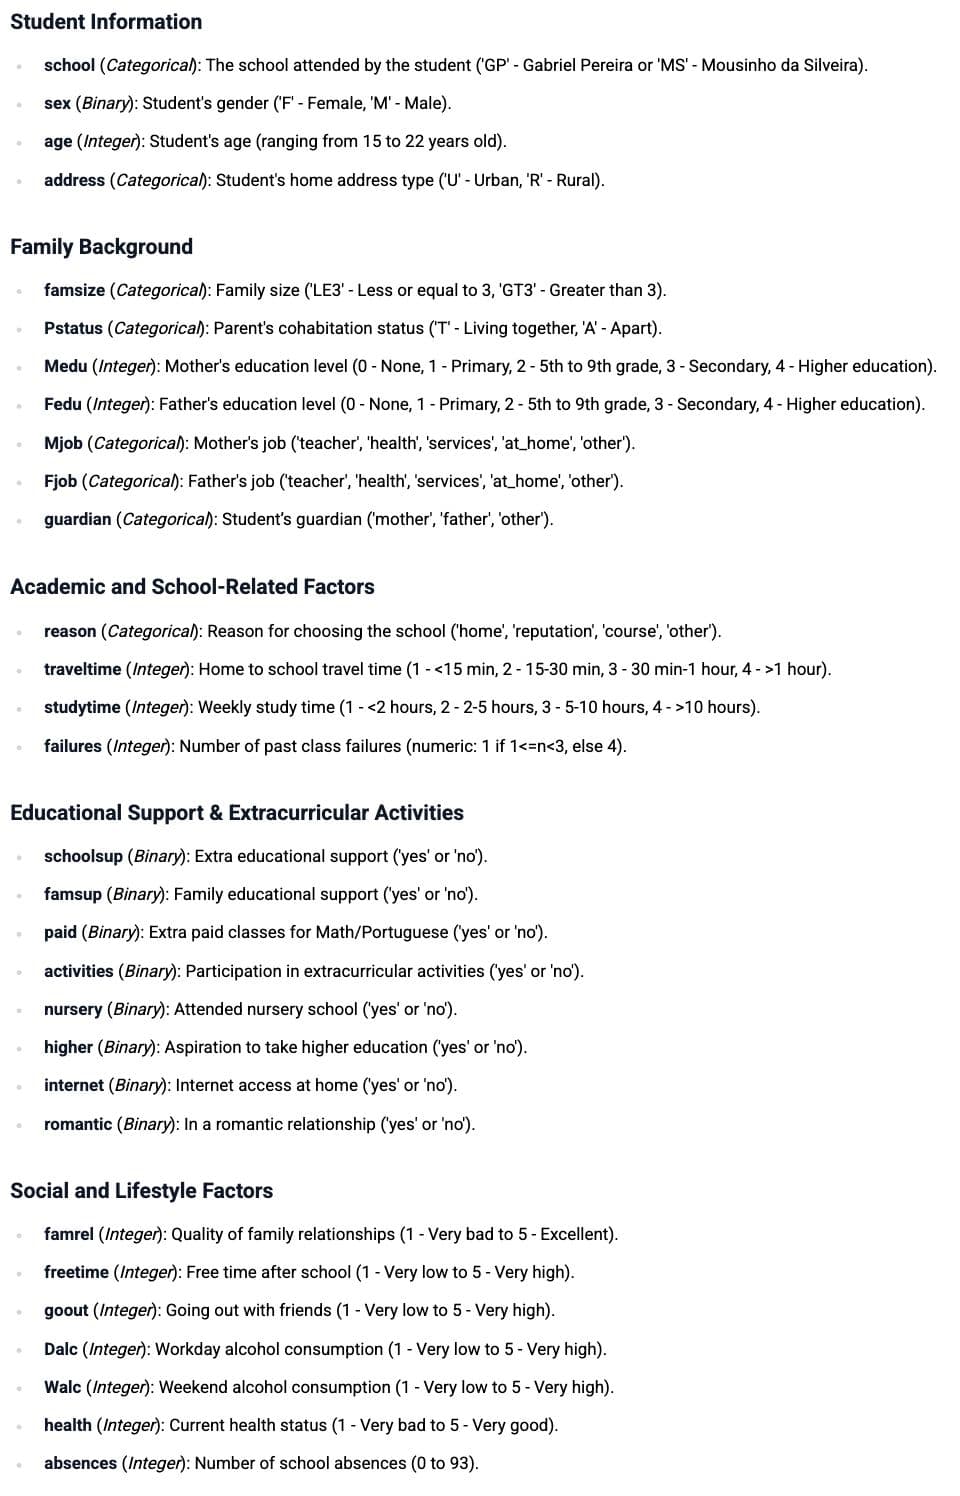
Here are the remaining columns of this dataset, categorized as student information, family background, academic and school-related factors, educational and extracurricular activities, and social and lifestyle factors.
As an example, let’s load the student performance data and run a quick two-sample t-test comparing final grades (G3) between students with and without internet access. Here is the code.
math_data <- read.csv("student-mat.csv", sep=";")

t.test(G3 ~ internet, data = math_data)
Here is the output.
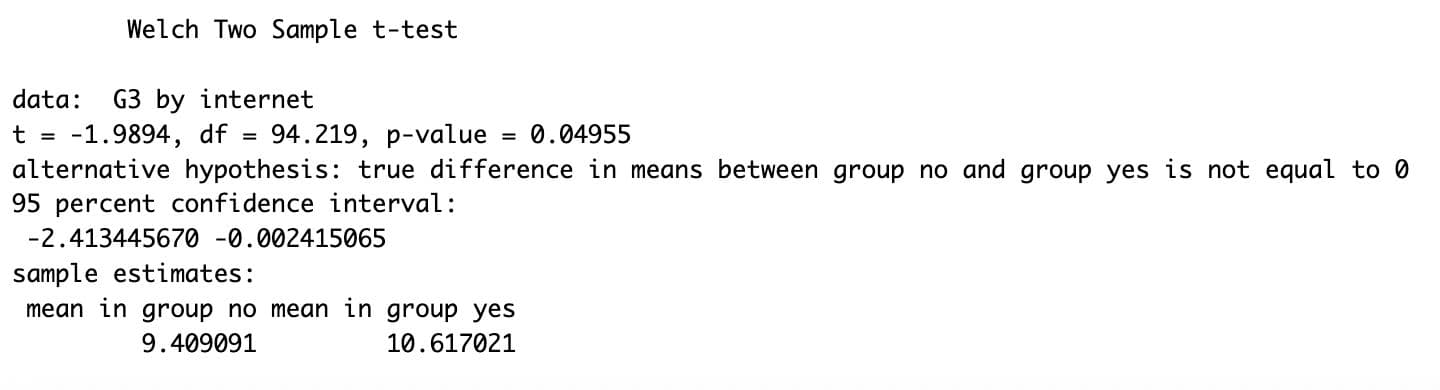
The output shows a p-value of 0.04955, just under 0.05.
This means that students without internet averaged 9.41, while those with internet averaged 10.62. The difference is statistically significant but modest, about 1.2 points. The confidence interval confirms the effect is real but small.
That's the core idea. The rest of this article shows you how to run these tests properly, check assumptions, and interpret results in real scenarios.
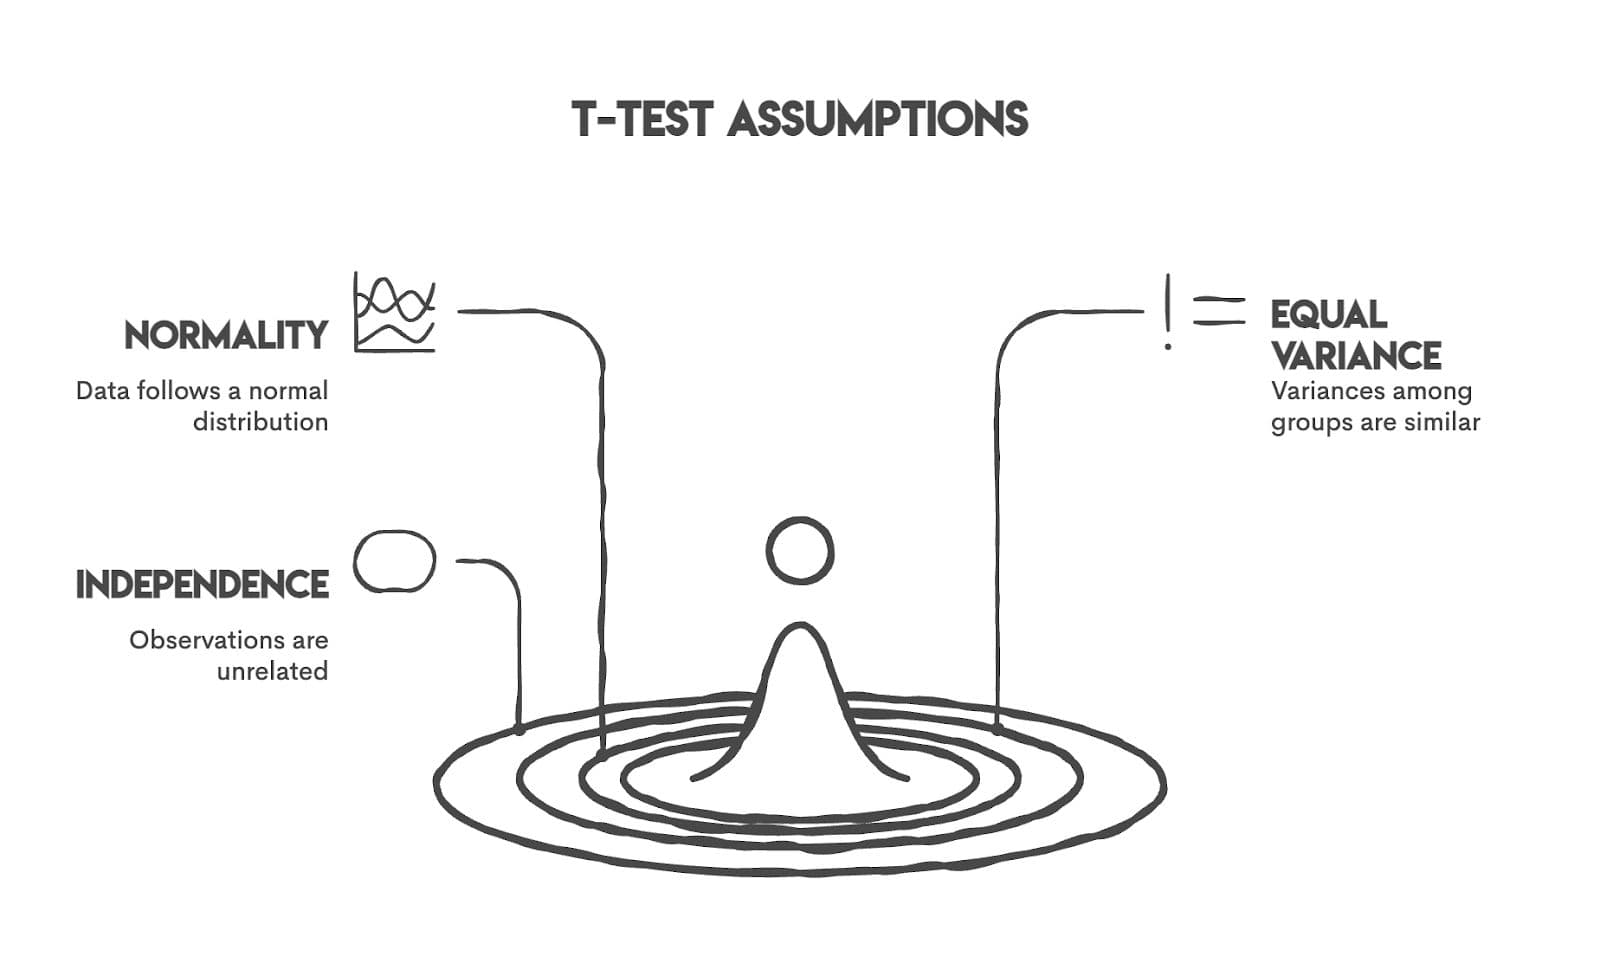
Assumptions & Nuances Before Running a T-Test in R
Before running a t-test, ensure your data meet its key requirements. The three main assumptions are normality, equal variances, and independence.
Assumption 1: Normality
Your data should be normally distributed, especially with small samples (n < 30). For larger samples, the Central Limit Theorem helps, and t-tests become more effective.
Check it visually:
hist(math_data$G3[math_data$internet == "yes"],
     main = "Grades: Students with Internet",
     xlab = "Final Grade")

qqnorm(math_data$G3[math_data$internet == "yes"])
qqline(math_data$G3[math_data$internet == "yes"])
Here is the output.
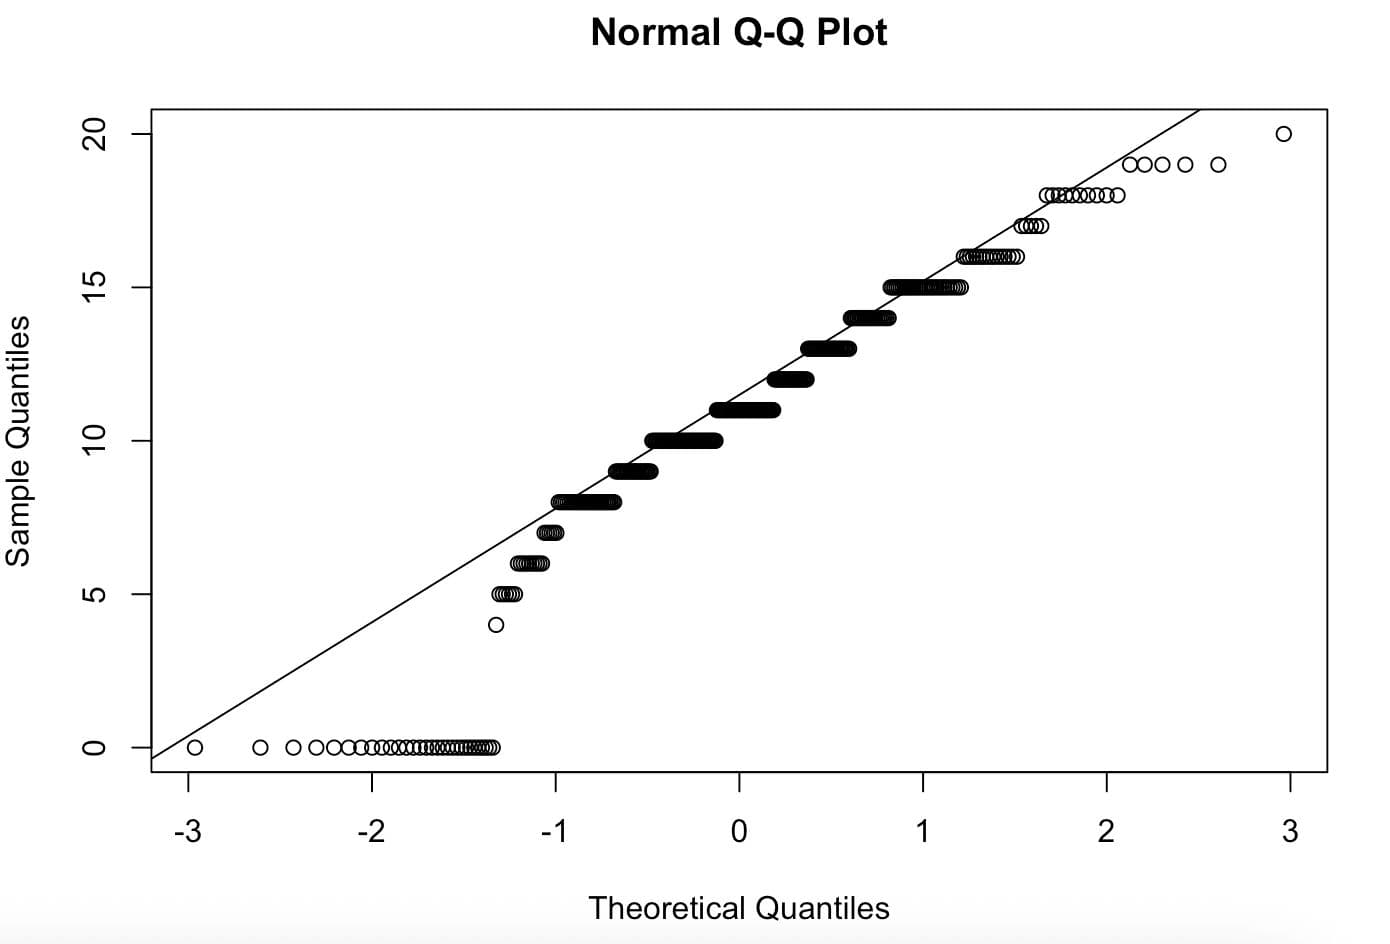
The Q-Q plot shows most points follow the line closely, with some deviation at the extremes. This is acceptable. The data have many zeros (students who failed), but the overall pattern is reasonable for a t-test. If your data is heavily skewed, consider a non-parametric test like the Wilcoxon rank-sum instead.
Assumption 2: Equal Variances
The two-sample t-test assumes both groups have similar variances. Test this with Levene’s test:
tapply(math_data$G3, math_data$internet, sd)

library(car)
leveneTest(G3 ~ internet, data = math_data)
Here is the output.
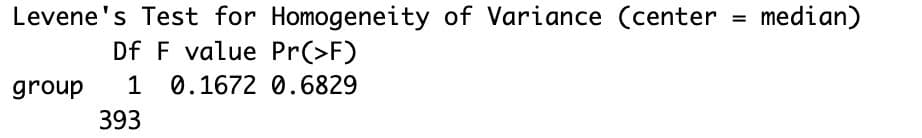
The p-value of 0.68 means the variances are similar enough. If this p-value were below 0.05, variances would differ significantly, and you'd use Welch's t-test (which is actually the default in R anyway).
Assumption 3: Independence
Each observation must be independent. This isn't something you test statistically; it's about your study design. Student grades from the same classroom might be correlated, or siblings in the dataset could have similar performance due to shared family factors.
Preparing Your Data in R for a Reliable T-Test
Before running a t-test, you need clean, properly structured data. Here's how to get your data ready.
Load and Inspect the Data
Let’s first load the data.
math_data <- read.csv("student-mat.csv", sep=";")
por_data <- read.csv("student-por.csv", sep=";")
Next, let’s check the missing values.
math_missing <- sum(is.na(math_data))
por_missing <- sum(is.na(por_data))

if(math_missing == 0) {
  print("Math dataset: No missing values found")
} else {
  print(paste("Math dataset:", math_missing, "missing values found"))
}

if(por_missing == 0) {
  print("Portuguese dataset: No missing values found")
} else {
  print(paste("Portuguese dataset:", por_missing, "missing values found"))
}
Here is the output.


Both datasets are clean with no missing values. If you had missing values, you'd remove them with `na.omit()` or filter specific columns.
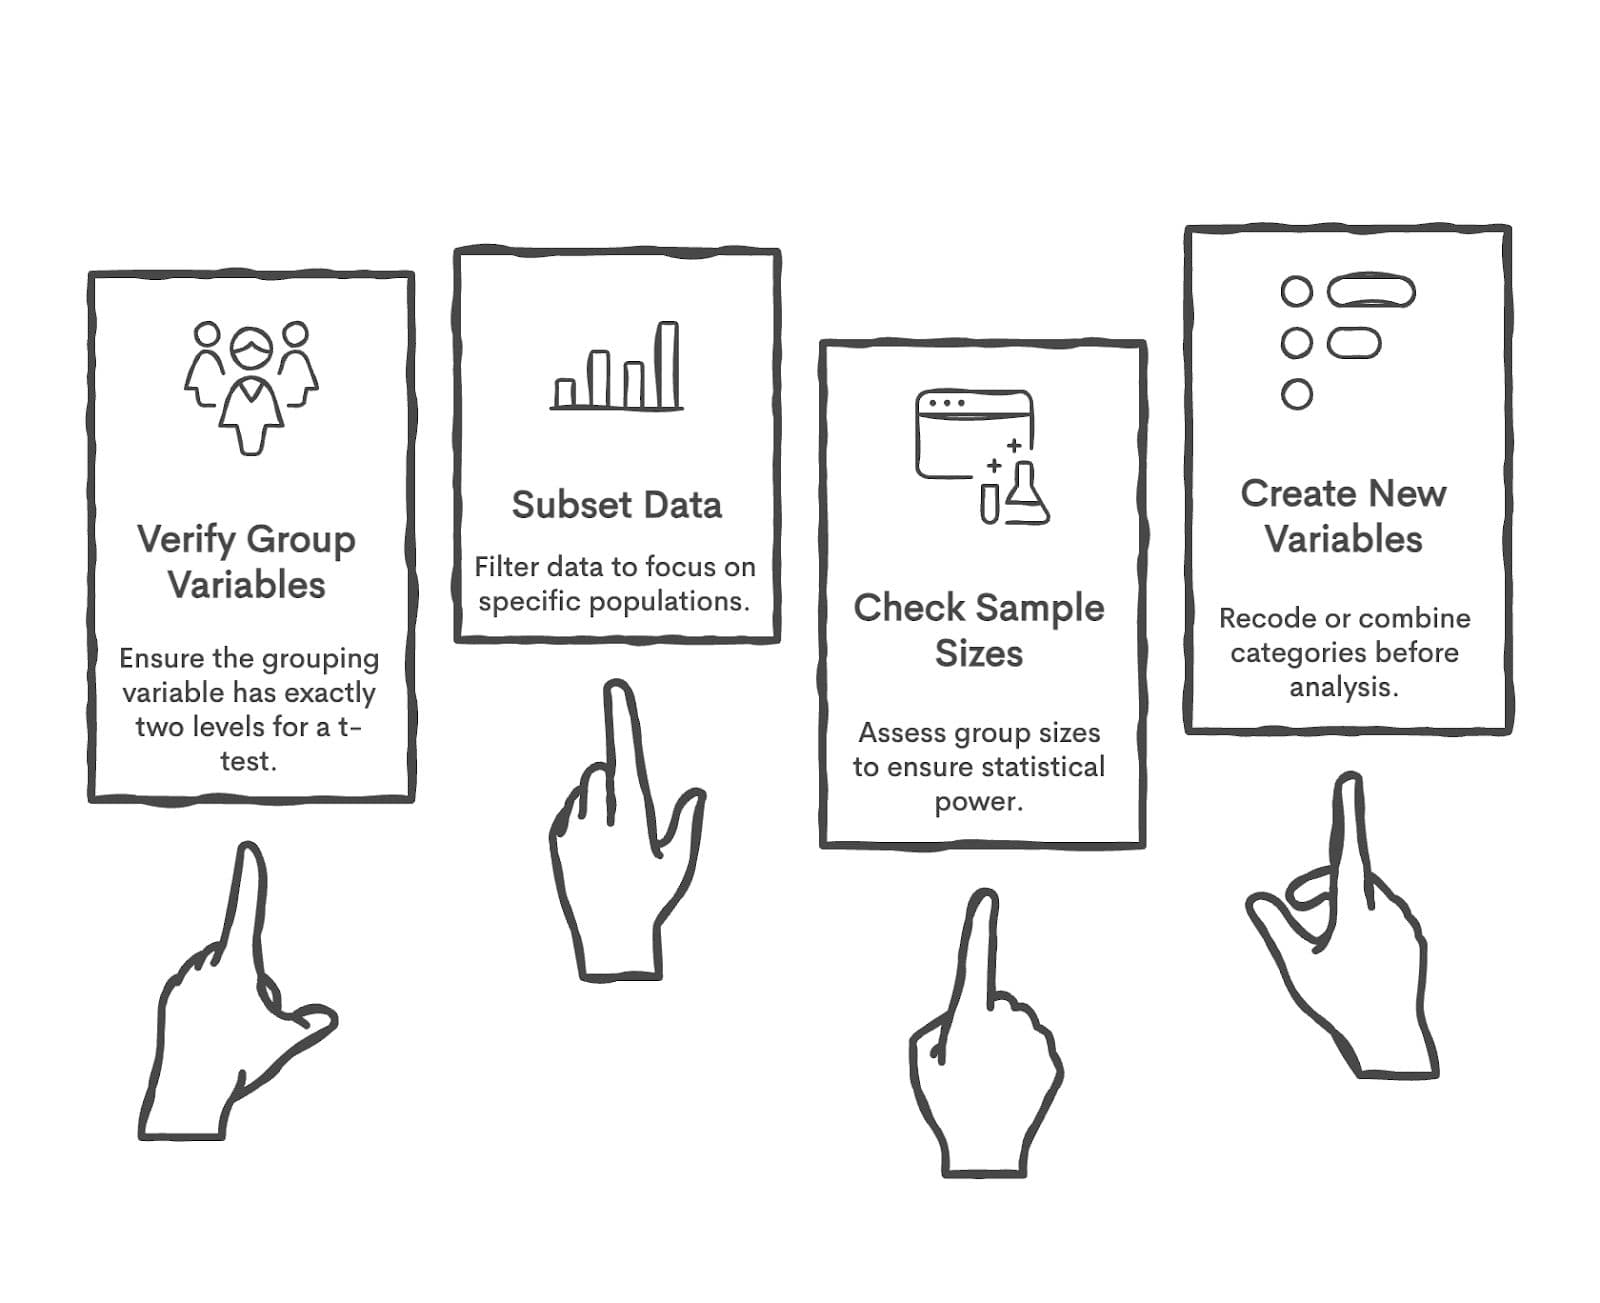
Next Steps That Might Help
Depending on your analysis, the following steps can be helpful.
Your data is ready. Next, we'll run the actual tests.
Performing One-Sample, Two-Sample, and Paired T-Tests in R
Now we'll run all three types of t-tests using the student performance data. Each test answers a specific research question and follows the same pattern: state the question, run the code, interpret the results.
One-Sample T-Test in R
In a one-sample t-test, you only need one group mean. Then we’ll calculate whether this is significantly different from a known or expected mean.
Question: Is the average final grade in the Math dataset significantly different from the national average of 12?
For instance, in this question, we compare the sample mean (student grades) to a fixed reference mean of 12, representing the national average.
Here is the required code:
t.test(math_data$G3, mu = 12)
Here is the output.
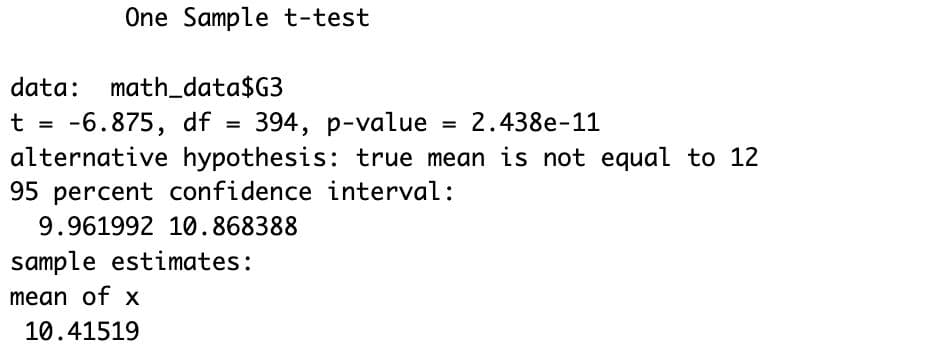
TL;DR: Yes, students scored significantly worse than the national benchmark.
The p-value of 2.438e-11 is extremely small, far below 0.05. This means the average grade (10.42) is significantly lower than the national benchmark of 12.
The 95% confidence interval (9.96 to 10.87) doesn't include 12, confirming that students in this dataset perform below the expected standard. The negative t-statistic (-6.875) shows the difference is substantial.
Two-Sample T-Test in R
In a two-sample t-test, we will compare the means of two independent groups to see if they differ significantly.
Question: Do male and female students have significantly different final grades?
For instance, in this question, we test whether the average grade of male students differs from that of female students in the Math dataset.
Here is the required code.
t.test(G3 ~ sex, data = math_data)
Here is the output.
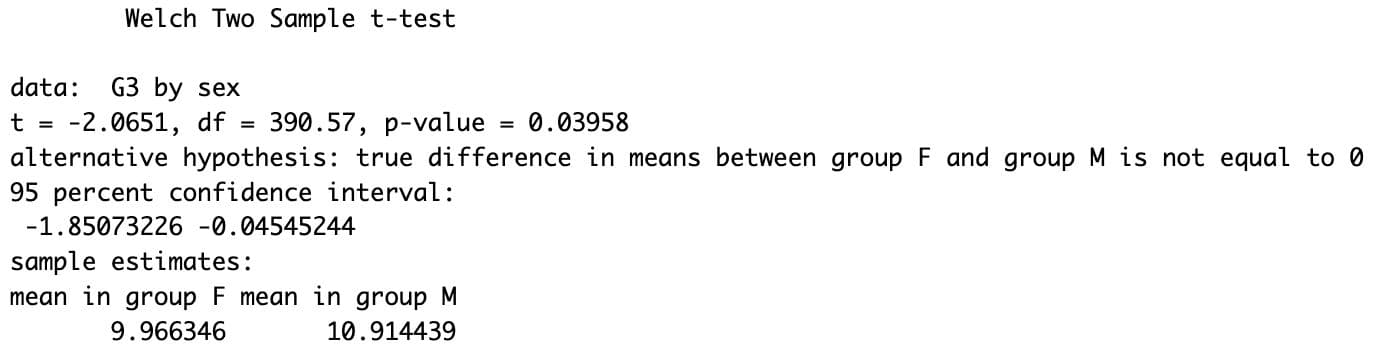
Note: By default, R uses Welch’s t-test, which does not assume equal variances between groups, but the students' t-test does.
TL;DR: Yes, male students scored slightly higher than female students, but the difference is minimal.
The p-value of 0.03958 is just below 0.05. It shows a statistically significant difference. Females averaged 9.97 while males averaged 10.91, about a 1-point difference.
The confidence interval (-1.85 to -0.05) barely excludes zero. This means that, while the difference is technically significant, the effect is small. Gender shows a modest but real association with grades in this dataset.
Paired T-Test in R
In a paired t-test, we’ll compare two related (dependent) measurements within the same group to determine whether a significant change occurs.
Question: Do students' grades improve significantly from the first period (G1) to the final period (G3)?
For instance, in this question, we test whether the same students achieved higher final grades compared to their first-period grades.
Here is the required code.
t.test(math_data$G1, math_data$G3, paired = TRUE)
Here is the output.
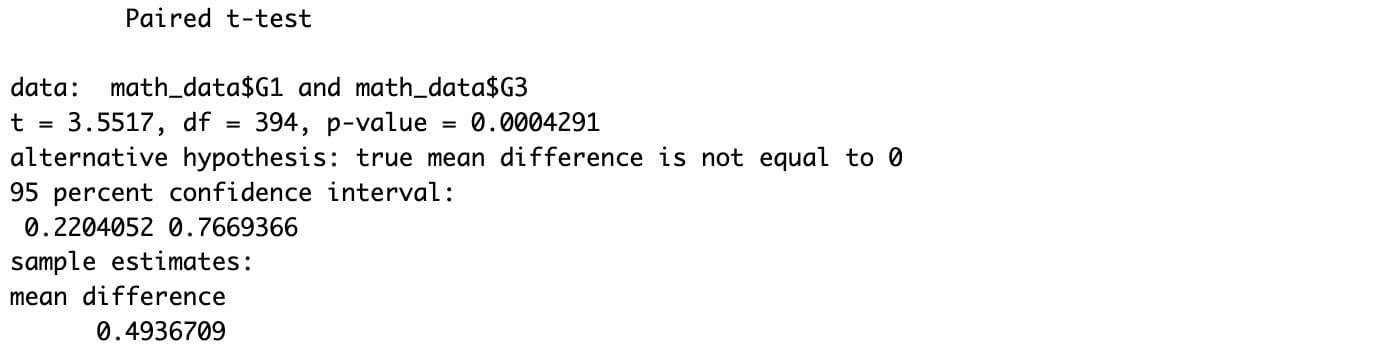
TL;DR: Yes, students’ grades improved from G1 to G3, showing a small but statistically significant increase over time.
The p-value of 0.0004291 shows strong evidence of improvement.
Students gained an average of 0.49 points from G1 to G3. The confidence interval (0.22 to 0.77) confirms this gain is real, not random. The positive t-statistic (3.55) indicates consistent upward progress.
Students do improve over the academic year, though the gain is modest.
How to Interpret T-Test Results in R With Confidence
Let’s look at these values to interpret the results clearly.
Also, let’s see how to interpret the t-value.
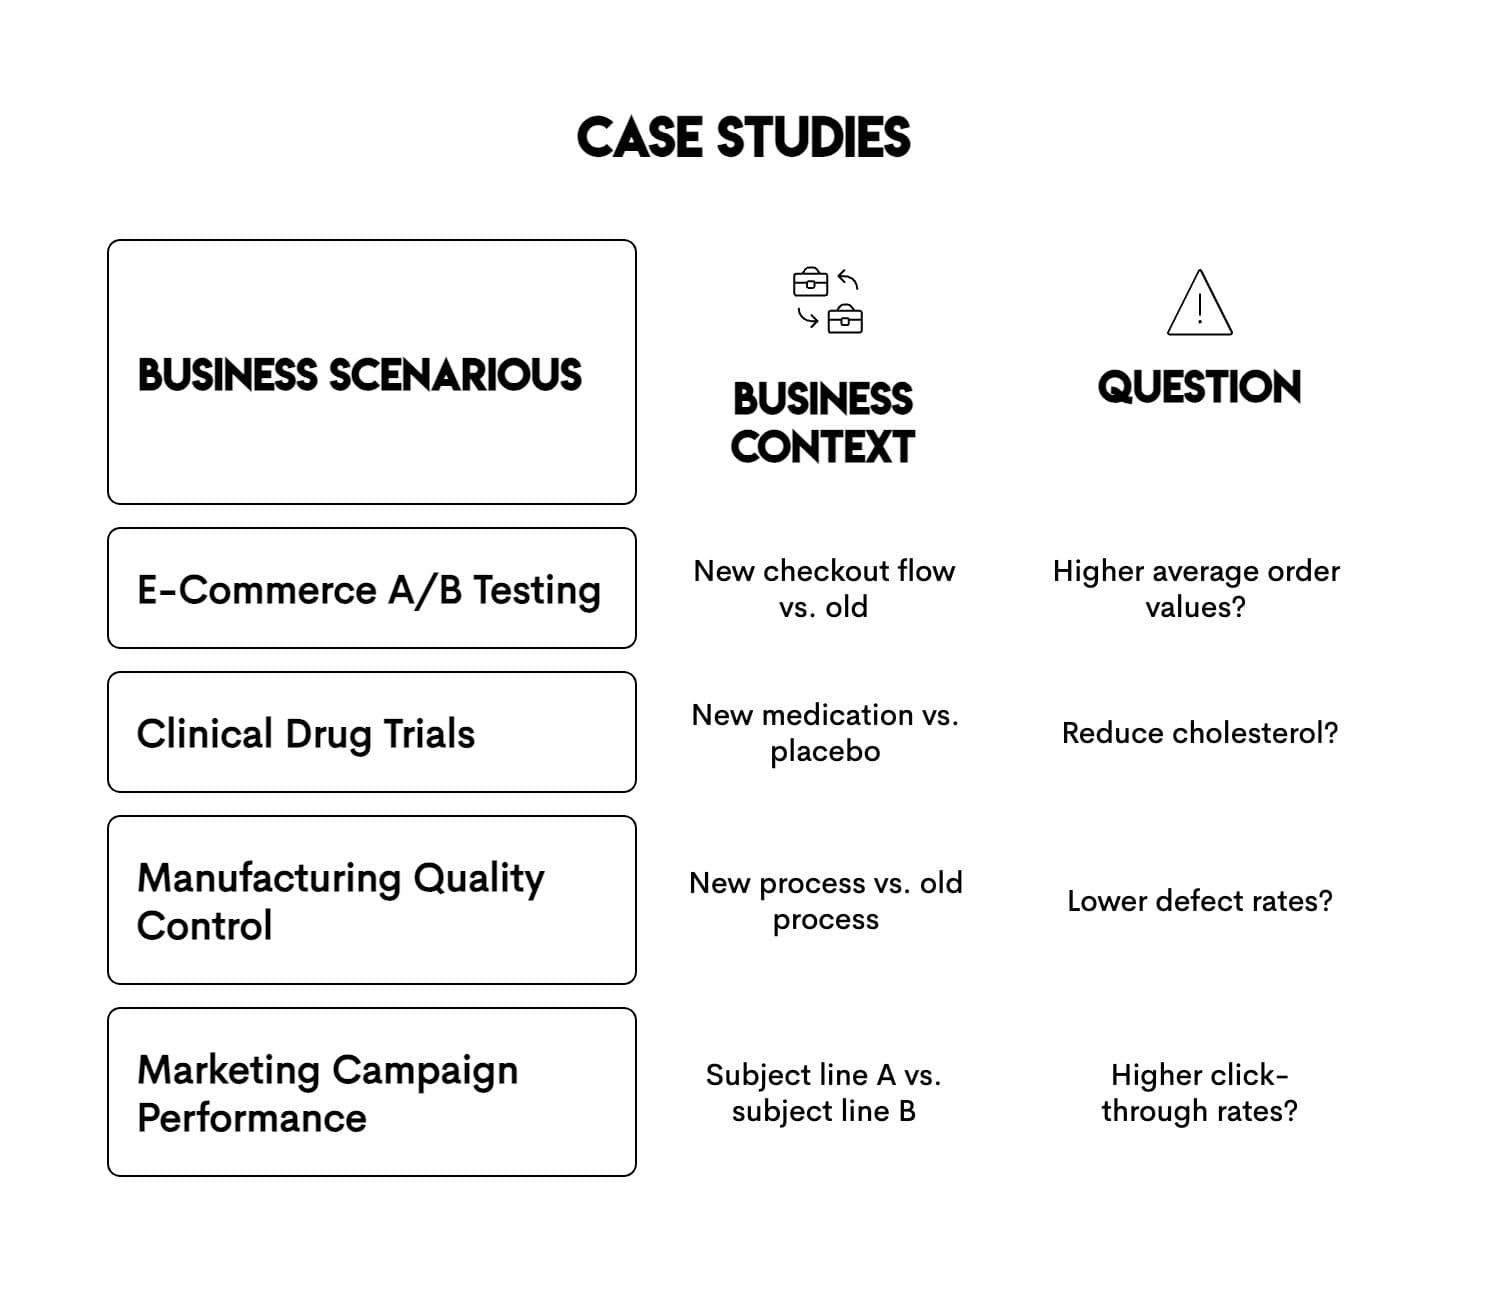
Case Studies: How Businesses Apply the T-Test in R
Here's how t-tests appear in real-world business scenarios across different industries.
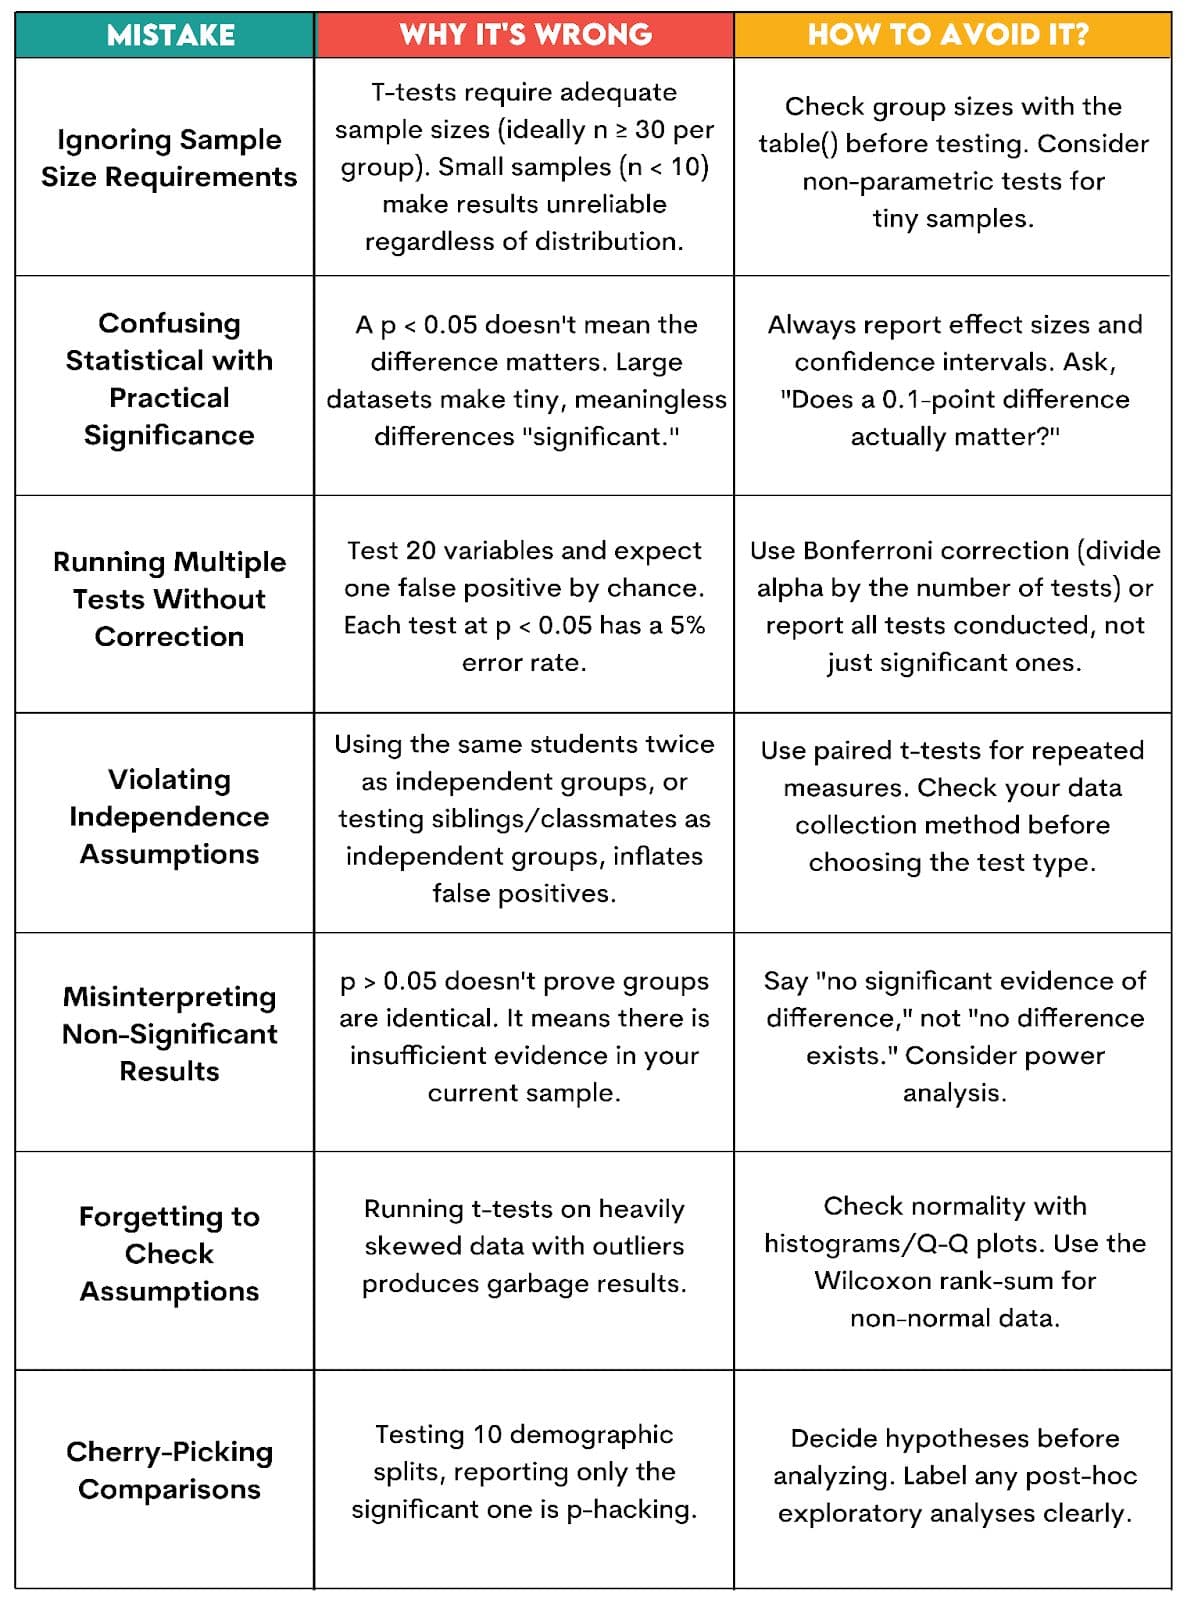
Common Mistakes & Pitfalls
Even experienced analysts make these errors. Here's what to watch for when running t-tests.
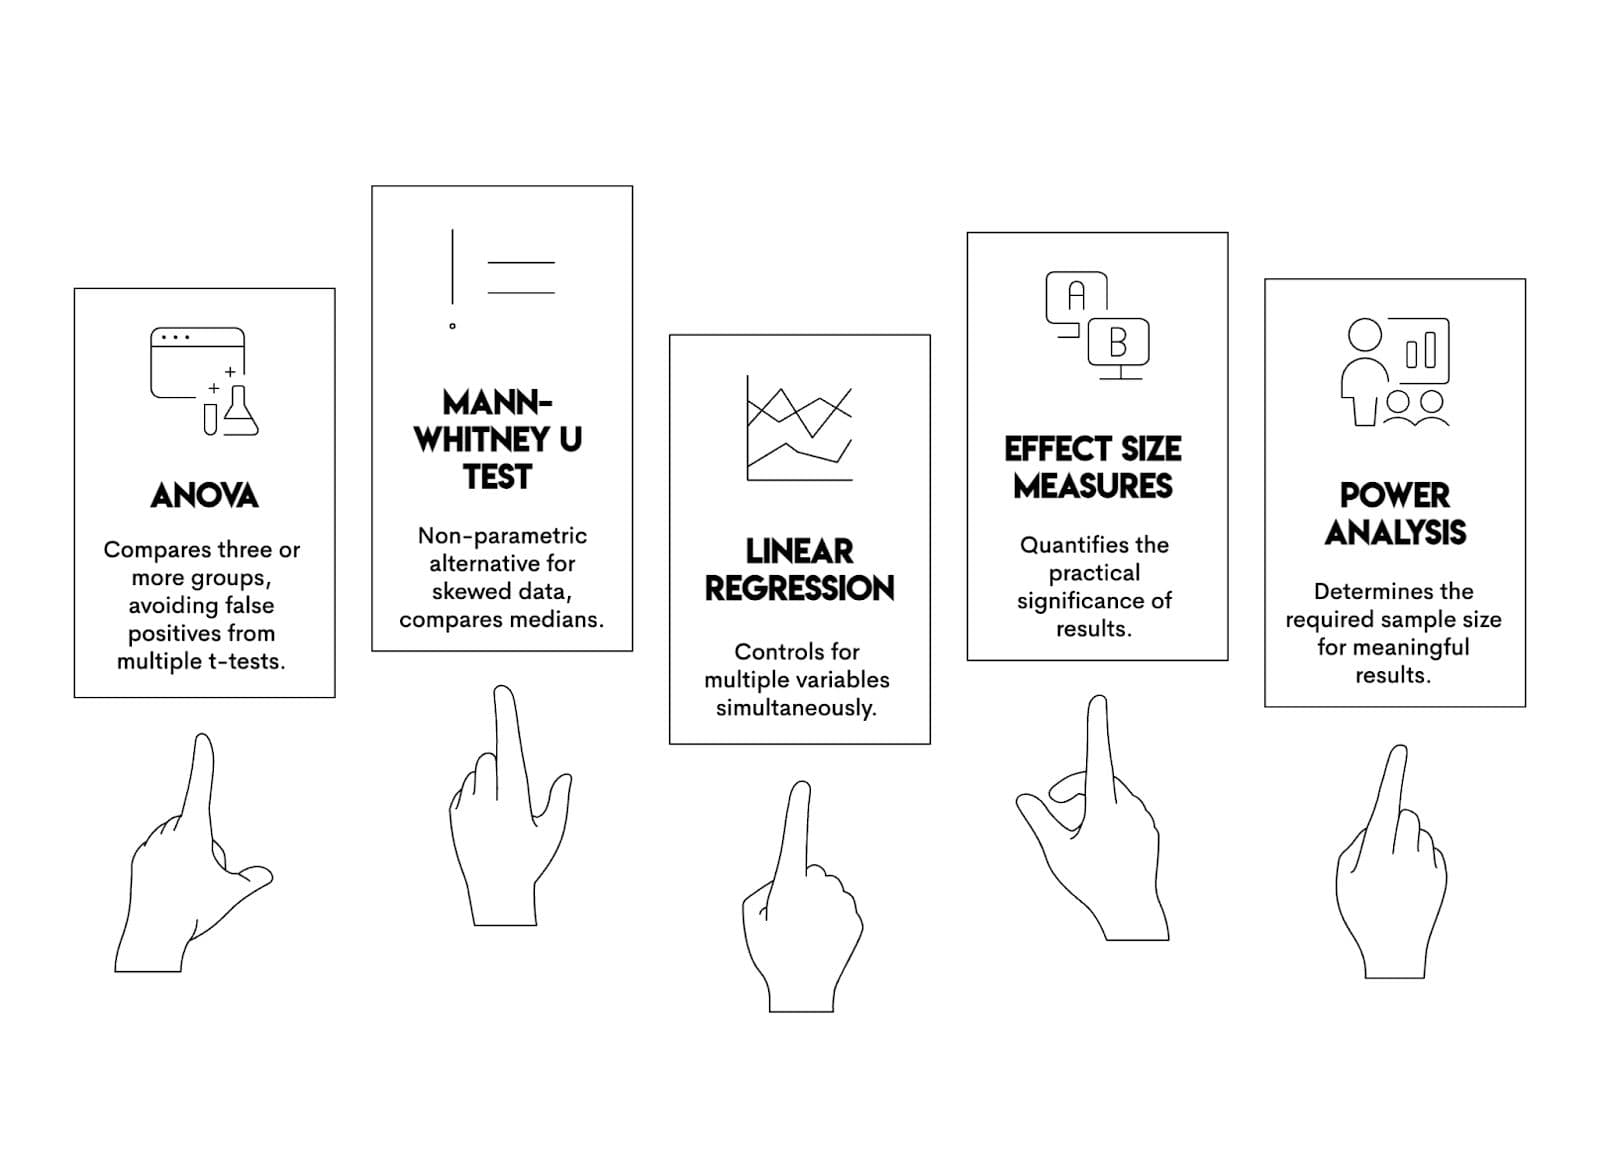
Extensions & Related Techniques
T-tests are just the beginning. Here's what to reach for when t-tests don't fit your situation.
If you’re unsure whether you should use a T-test or a Z-test, this guide gives a clear comparison: T-Test or Z-Test for R.
Conclusion
If you plan to compare the mean of a group against a known value, use a one-sample t-test. If you have two group means, use a two-sample t-test; in both cases, ensure the groups are independent. But if you plan to compare two dependent groups, use a paired t-test.
Before starting the test, don’t skip the assumptions, and make sure to check your sample size. So next time you need to compare two groups, you’ll have a to-do list.
FAQs
When Should I Use a Paired vs. Unpaired T-Test?
If you compare two measurements of the same group, use a paired t-test. But if your groups are independent, use an unpaired t-test.
What's the Difference Between Student's T-Test and Welch's T-Test?
In the Student's t-test, the variances of the two groups must be equal, but in Welch's t-test, this is not required.
Why Am I Getting "Not All Arguments Have the Same Length" Error?
This occurs in a paired t-test when your two vectors have a mismatched number of observations, as paired data must exactly match samples.
How Do I Know If My Data Meets T-Test Assumptions?
First, check if your data is normally distributed and your sample size is greater than 30. Next, make sure both groups are independent and have similar variances.
What Does the P-Value Actually Tell Me in a T-Test Result?
The p-value shows you if the differences between the two groups are coincidental or not. If your p-value is lower than 0.05, your results will be statistically significant, meaning not coincidental.
Share