Facebook Data Scientist Interview Questions

Categories:
 Written by:
Vivek Sankaran
In this article, we have discussed the approach to solving real-life Facebook Data Scientist interview questions in detail using SQL.
Facebook started out in the dorms of Harvard, but quickly gain prominence and is today worth over US$ 1 trillion. Along with Google, Apple, Microsoft, and Amazon, Facebook forms the Big Five FAANG companies in US Information Technology. While it is mostly known for its eponymous app, Facebook also has numerous other products and services including WhatsApp, Instagram, Facebook Messenger, Giphy, and Oculus among others.
Data Scientist Roles at Facebook
Given the large range of business functions, Data scientist roles at Facebook too vary based on the unit and the position that you are applying for. What you can be sure of is that you will be working on data at an enormous scale and using cutting edge machine learning, visualization, and other related tools to help understand how people interact with each other and the world around them.
Concepts Tested in Facebook Data Scientist Interview Questions
The main SQL concepts tested in the Facebook data scientist interview questions include
- Common Table Expressions (CTEs)
- Window Functions
- Difference between rank() and dense_rank() functions
- coalesce function
- Datetime functions
The StrataScratch platform helps you become interview-ready by providing you with practice questions like this and more.
Facebook Data Scientist Interview Questions
Rank Variance Per Country
Last Updated: February 2021
Compare the total number of comments made by users in each country during December 2019 and January 2020.
For each month, rank countries by their total number of comments in descending order. Countries with the same total should share the same rank, and the next rank should increase by one (without skipping numbers).
Return the names of the countries whose rank improved from December to January (that is, their rank number became smaller).
Link to the question: https://platform.stratascratch.com/coding/2007-rank-variance-per-country
Dataset
fb_comments_count
| user_id | int |
| created_at | datetime |
| number_of_comments | int |
Fb_active_users
| user_id | int |
| name | varchar |
| status | varchar |
| country | varchar |
Assumptions
In many cases, you may not have access to the data sets during the data science interview. Therefore, you will have to visualize the table schema using a mixture of business logic and your understanding of data storage to impute the variable assumptions. Communicating with the interviewer at this stage is essential to ensure that all the edge cases in your solution are mapped out and handled in your query.
Let us begin by trying to figure out what the data might look like. As mentioned earlier, please confirm the validity of the assumptions that you make with the interviewer. Most interviewers will help you at this stage with your assumptions
What are the assumptions on the data and the table?
The tables seem reasonably straightforward. The fb_active_users appears to be a user information table, with static demographic data. On the other hand, fb_comments_count appears to be a transaction table, for the comments by each user. Let us begin with the fb_comments_count table:
user_id: appears to be the identifying number for a user. This will be the merging key to get the location of the user (Country) from the other table.
created_at: This appears to be the date Note by looking at the type of variable, we can make some informed guesses regarding the granularity of data. Since this is a DateTime field and not a timestamp, we can reasonably assume that this table contains some form of aggregation – either daily, a weekly or monthly snapshot of the number of comments made by the user. This field will be useful for the final aggregation since we need to get the comments for Dec 2019 and Jan 2020 separately.
number_of_comments: The name of the field in conjunction with the variable type of the date field lends credibility to our assumptions regarding the granularity of data. This field is required in the final analysis since we need to roll up the comments at a country level.
Let us look at the other table fields: fb_active_users
user_id: This appears to be the merging key with the fb_comments_count table.
name: This seems to be the name of the user, either the real name or the profile name. For the purposes of this query, we can safely ignore this field.
status: It seems that this might be an account activity status field based on some criteria. You might want to check with the interviewer if this field is needed in the final query. It seems that we can safely ignore this field.
country: This is the field that we need to get the location of the user. We will eventually aggregate on the basis of this field across the two months and compare the rankings.
Before we proceed with building our query, it is advisable that you verify your assumptions with the interviewer and verify if you are on the right track.
This is the table that we will be working with –
Logic
Let us break down the final query into individual steps. That will help us build the query in a modular manner.
- We need to get the country from the fb_active_users table.
- Extract the month and aggregate, based on the number of comments by country and month.
- Rank the countries for each month.
- Compare the rankings and output only the countries that showed an improvement.
Note: We also need to work on edge cases. The edge cases that come to mind immediately are:
- Missing values – Since we are dealing with demographic data, what happens if we do not have the country field populated for a user?
- Missing Ranks – What happens in the case a country has a missing rank either in Dec 2019 or Jan 2020? This might be possible if, in the given subset of data, we have all the users from a country are inactive in one of the two months.
Solution:
While the datasets seem straightforward, the query isn’t. There are many layers to this Facebook data scientist interview question and the edge cases make this one hard. So let us begin our coding. To ensure readability of code, and ease of debugging, we will be using CTEs instead of subqueries.
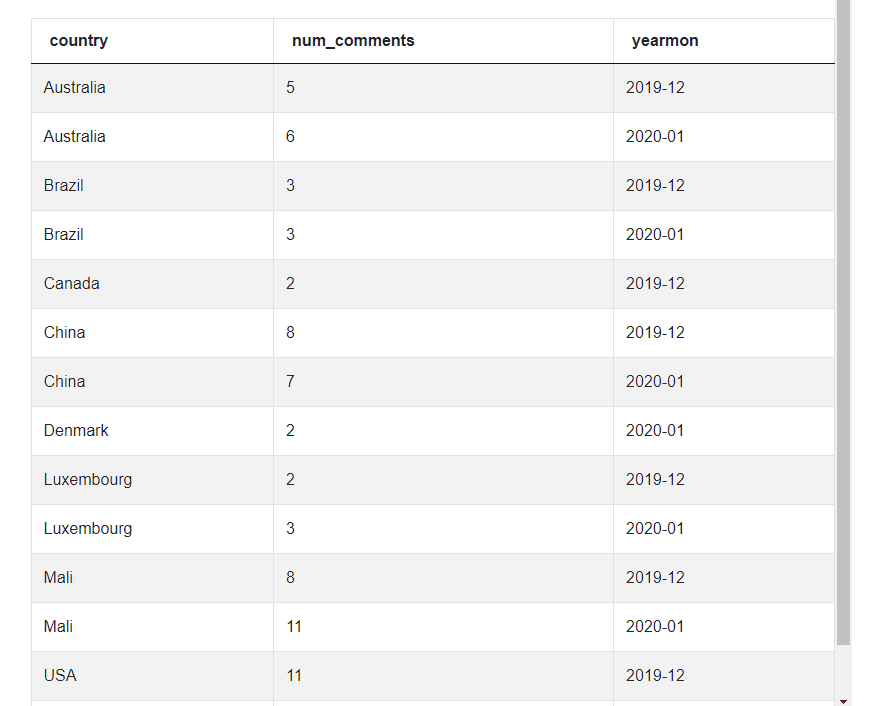
1. We start off by merging the two datasets. We also create a month field using the to_char function and then aggregate the number of comments by country and month. Finally, to finish off this CTE, we keep only the months of Dec 2019 and Jan 2020.
with merged_data as
(
      select b.country, sum(number_of_comments) as num_comments, to_char
(created_at, 'YYYY-MM') as yearmon from
      fb_comments_count a inner join fb_active_users b
      on a.user_id = b.user_id
      where to_char(created_at, 'YYYY-MM') in ('2019-12', '2020-01')
      group by country, yearmon
Note: We used an inner join to ensure that only those users with demographic data present are selected.
Our data now looks like this
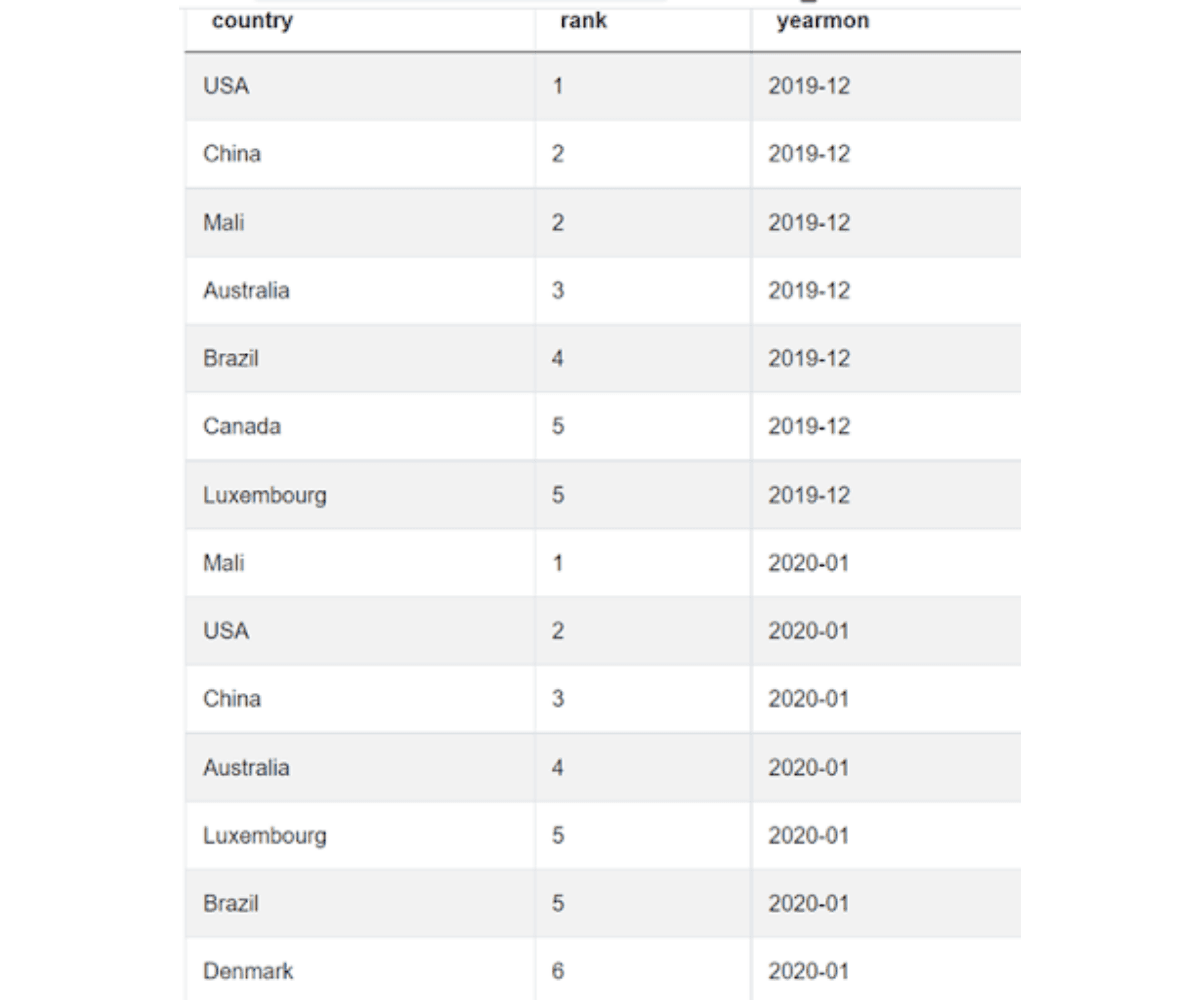
2. Rank the countries based on the number of comments for each month. To do this we will use a window function. Remember to use the dense_rank() function instead of the rank() function since the problem explicitly states that we should not have any gaps in the ranks. We store this in another CTE.
with merged_data as
(
      select b.country, sum(number_of_comments) as num_comments, to_char
(created_at, 'YYYY-MM') as yearmon from
      fb_comments_count a inner join fb_active_users b
      on a.user_id = b.user_id
      where to_char(created_at, 'YYYY-MM') in ('2019-12', '2020-01')
      group by country, yearmon
),
ranked_data as
(
      select country, dense_rank() over (partition by yearmon order by
num_comments desc) as rank, yearmon from merged_data
)
Our data now looks like this.
3. Now we need to separate out the ranks for the two months. We could use two subqueries – one for each month. Or to do it faster, we can simply use the CASE statement, setting the other month value as NULL. We then aggregate it by country taking advantage of the fact that NULL values will be ignored automatically.
with merged_data as
(
      select b.country, sum(number_of_comments) as num_comments,
to_char(created_at, 'YYYY-MM') as yearmon from
      fb_comments_count a inner join fb_active_users b
      on a.user_id = b.user_id
      where to_char(created_at, 'YYYY-MM') in ('2019-12', '2020-01')
      group by country, yearmon
),
ranked_data as
(
      select country, dense_rank() over (partition by yearmon order by
num_comments desc) as rank, yearmon from merged_data
),
monthly_ranks as (
      select country,
         min(CASE yearmon
             WHEN '2019-12' THEN rank ELSE NULL END) as dec_rank,
         min(CASE yearmon
             WHEN '2020-01' THEN rank ELSE NULL END) as jan_rank
      from ranked_data
      group by country
)
Our data now looks like this.
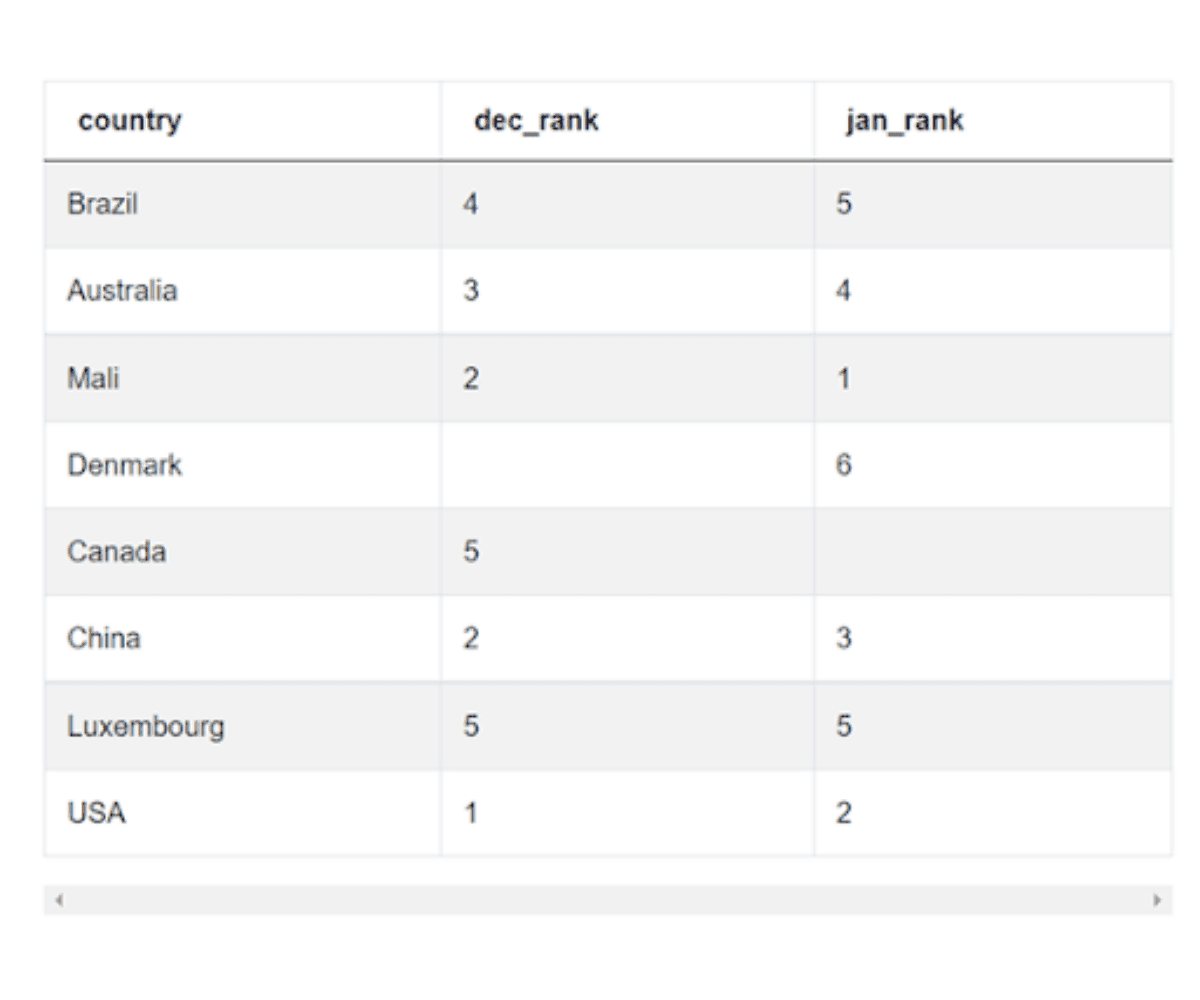
Now comes the hard part. The problem will become doubly difficult if you do not have access to the underlying data. Most will not be able to find the second edge case that is visible here. As you can see, Denmark and Canada, are missing ranks in December and January respectively. While NULL values helped us in aggregating, they become a problem since any value will be greater than NULL (and smaller too!!).
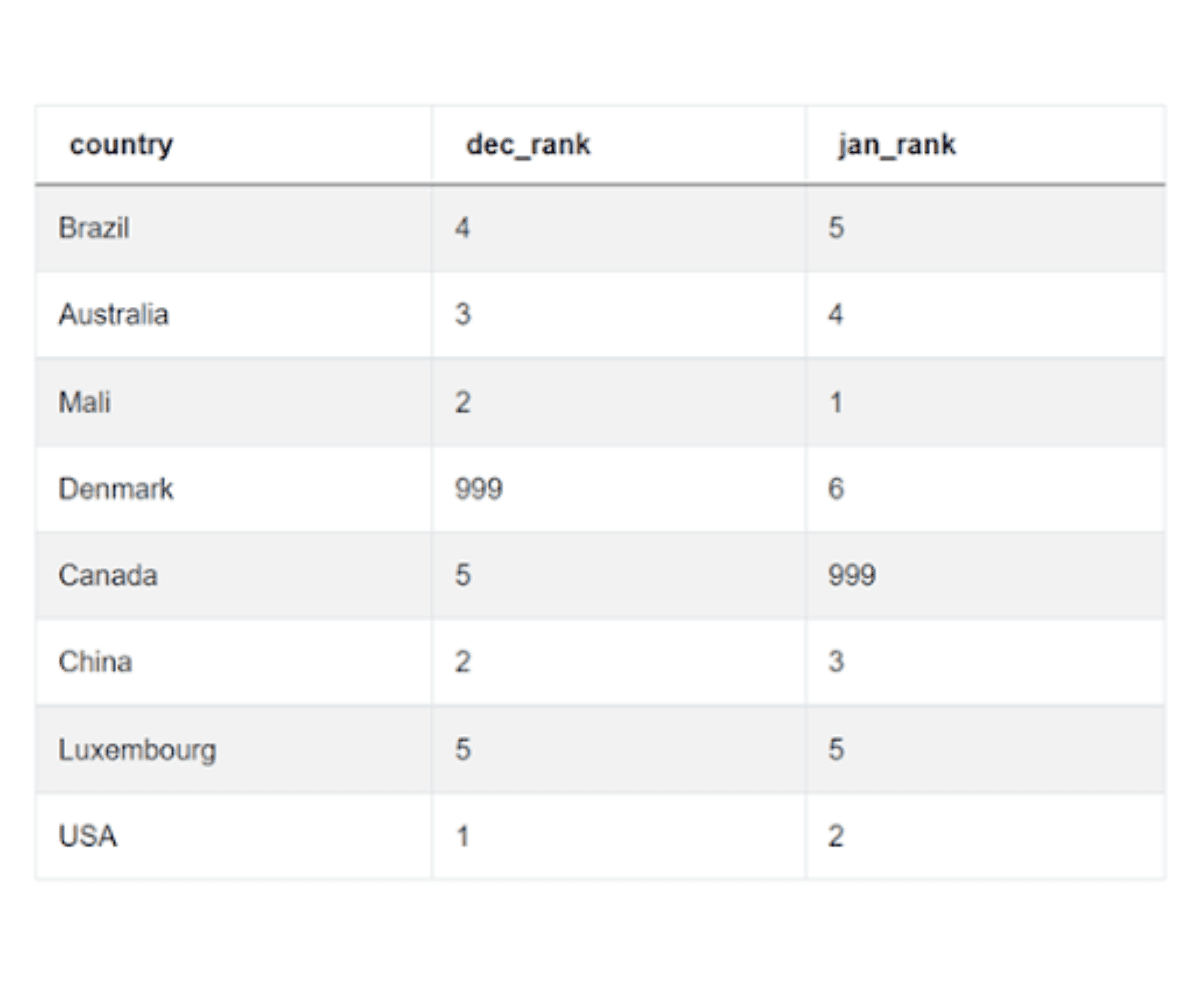
4. Missing (or NULL) values are a field in themselves when dealing with real-life data, especially in the Data Science field. To work with NULL values, we need to understand what the NULL value field signifies. In this case, it means that there were no comments from users originating from that country for the month. Therefore, they should be ranked below. We can give this missing value a special rank that will help us identify (if needed) that this was a missing value. Since we are dealing with countries, we can give this a rank of 999, as there are only about 200 countries in the world. These special values in computer programming parlance are called sentinel values or flag values. We could have also given it a rank like 0 or -1 or -999. However, we chose a large value because we are going to compare it with the rank in the other month. Since numerically smaller values are better ranks, this would require us to write an additional checking conditional. So let us modify our query a bit. There are two ways out –
a. Since we are using the MIN function, we can give the other month rank as 999 by default
with merged_data as
(
      select b.country, sum(number_of_comments) as num_comments, to_char
(created_at, 'YYYY-MM') as yearmon from
      fb_comments_count a inner join fb_active_users b
      on a.user_id = b.user_id
      where to_char(created_at, 'YYYY-MM') in ('2019-12', '2020-01')
      group by country, yearmon
),
ranked_data as
(
      select country, dense_rank() over (partition by yearmon order by
num_comments desc) as rank, yearmon from merged_data
),
monthly_ranks as (
      select country,
          min(CASE yearmon
              WHEN '2019-12' THEN rank ELSE 999 END) as dec_rank,
          min(CASE yearmon
              WHEN '2020-01' THEN rank ELSE 999 END) as jan_rank
          from ranked_data
          group by country
)
b. Or, we can use the COALESCE statement after calculating the ranks like we already did.
with merged_data as
(
      select b.country, sum(number_of_comments) as num_comments, to_char
(created_at, 'YYYY-MM') as yearmon from
      fb_comments_count a inner join fb_active_users b
      on a.user_id = b.user_id
      where to_char(created_at, 'YYYY-MM') in ('2019-12', '2020-01')
      group by country, yearmon
),
ranked_data as
(
      select country, dense_rank() over (partition by yearmon order by
num_comments desc) as rank, yearmon from merged_data
),
monthly_ranks as (
      select country,
          COALESCE(min(CASE yearmon
            WHEN '2019-12' THEN rank ELSE NULL END), 999) as dec_rank,
      COALESCE(min(CASE yearmon
            WHEN '2020-01' THEN rank ELSE NULL END), 999) as jan_rank
      from ranked_data
      group by country
)
Either way, we get the following table.
5. Now we can easily query the final table and get our required output.
with merged_data as
(
      select b.country, sum(number_of_comments) as num_comments, to_char
(created_at, 'YYYY-MM') as yearmon from
      fb_comments_count a inner join fb_active_users b
      on a.user_id = b.user_id
      where to_char(created_at, 'YYYY-MM') in ('2019-12', '2020-01')
      group by country, yearmon
),
ranked_data as
(
      select country, dense_rank() over (partition by yearmon order by
num_comments desc) as rank, yearmon from merged_data
),
monthly_ranks as (
      select country,
          COALESCE(min(CASE yearmon
              WHEN '2019-12' THEN rank ELSE NULL END), 999) as dec_rank,
          COALESCE(min(CASE yearmon
              WHEN '2020-01' THEN rank ELSE NULL END), 999) as jan_rank
          from ranked_data
          group by country
)
select country from monthly_ranks
where jan_rank < dec_rank;
Optimization
Besides taking care of the edge-cases, interviewers at top companies like Facebook, Microsoft, Amazon, Google, Apple, etc also look for optimized queries. The query you write should not only be easily understood, but it should also execute quickly as well. Optimization in SQL usually involves combining multiple conditions into one and removing unnecessary joins and sub-queries.
For our solution:
- We used CTEs to eliminate sub-queries.
- We used the CASE WHEN statement to eliminate the need for separate subquery for each month.
- And lastly, we removed the unnecessary fields right at the beginning by using an inner join and doing away with data from other months.
Additional Facebook Data Scientist Interview Questions
Facebook Data Scientist Interview Question #1: Find whether the number of seniors works at Facebook is higher than its number of USA based employees
Find whether the number of seniors works at Meta/Facebook is higher than its number of USA based employees
Last Updated: April 2020
Find whether the number of senior workers (i.e., more experienced) at Meta/Facebook is higher than number of USA-based employees at Facebook/Meta. If the number of senior workers is higher then output as 'More seniors'. Otherwise, output as 'More USA-based'.
Link to the question: https://platform.stratascratch.com/coding/10065-find-whether-the-number-of-seniors-works-at-facebook-is-higher-than-its-number-of-usa-based-employees
Dataset
We can solve this in multiple ways. It is a relatively easy Facebook data scientist interview question. One way to solve this is to use CASE WHEN statements and filter the two groups.
Approach
- Find the count of the number of seniors using the CASE WHEN conditional statement.
- Similarly, find the count of the number of employees based in the USA
- Compare the counts and output the result as a query.
Facebook Data Scientist Interview Question #2: Clicked Vs Non-Clicked Search Results
Clicked Vs Non-Clicked Search Results
The 'position' column represents the position of the search results, and 'has_clicked' column represents whether the user has clicked on this result. Calculate the percentage of clicked search results, compared to those not clicked, that were in the top 3 positions (with respect to total number of records)
You can solve this problem here -https://platform.stratascratch.com/coding-question?id=10288&python=
Dataset
| search_id | int |
| query | varchar |
| has_clicked | varchar |
| position | int |
| notes | varchar |
Data View
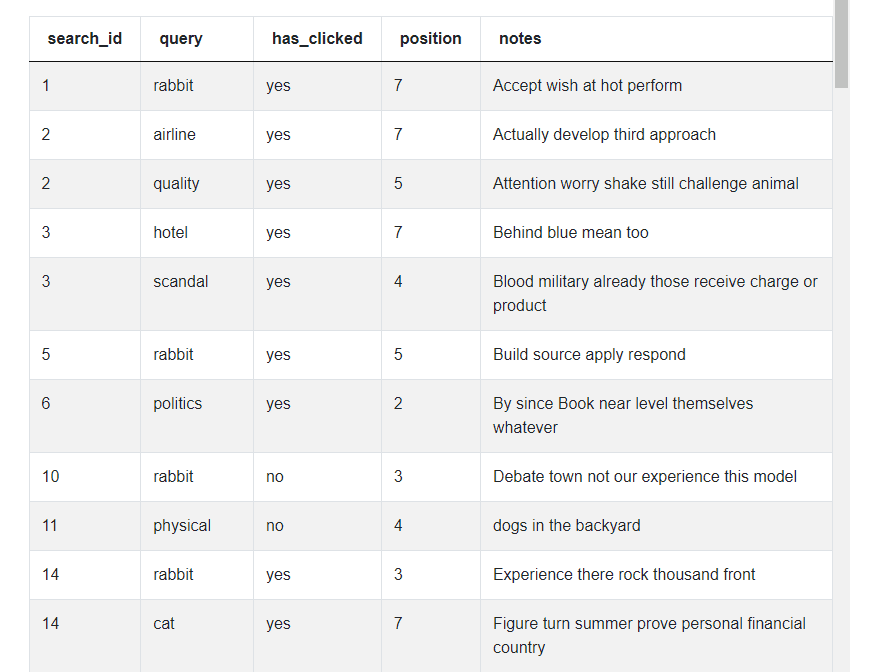
This is one of the moderate level Facebook data scientist interview questions. We can solve this problem using the CASE WHEN conditional filtering statement. One approach to solving the is presented below.
Approach
- Filter has_clicked = yes and calculate the number of clicked results in the top three (filtering on the ‘position’ field). Calculate this as a percentage of the total number of query results. This will be the clicked percentage.
- Repeat a similar calculation but setting the filter on has_clicked = no.
- Output the clicked and not_clicked values as an SQL query result.
Facebook Data Scientist Interview Question #3: Popularity of Hack
Popularity of Hack
Last Updated: March 2020
Meta/Facebook has developed a new programing language called Hack.To measure the popularity of Hack they ran a survey with their employees. The survey included data on previous programing familiarity as well as the number of years of experience, age, gender and most importantly satisfaction with Hack. Due to an error location data was not collected, but your supervisor demands a report showing average popularity of Hack by office location. Luckily the user IDs of employees completing the surveys were stored. Based on the above, find the average popularity of the Hack per office location. Output the location along with the average popularity.
Link to the question: https://platform.stratascratch.com/coding/10061-popularity-of-hack
Dataset
Besides the facebook_employees data set that we have already seen in the previous problem, this Facebook data scientist interview question also uses an additional data set - facebook_hack_survey
This is a relatively straightforward Facebook Data Science Interview question. We can solve this by first merging the two tables and then using group by aggregation. One such approach is presented here.
Approach
- Merge the two tables. The join keys are – employee_id column in the facebook_hack_survey table and the id column in the facebook_employees table.
- Aggregate by the location column calculating the average popularity. You can use the built-in AVG function.
- Order the results from highest to lowest popularity ratings.
Check out our article Data Science Interview Questions to find more questions from Facebook and other top companies.
Conclusion
What started out as a simple-looking query quickly escalated into an extremely tricky problem that involved missing values, multiple layers of problem-solving, and handling edge cases. We also discussed one method of the imputation of missing values – a very frequent test area in Data Science interviews.
To completely solve this Facebook data scientist interview question, one needed an in-depth understanding of SQL functions as well as a feel for how real-world data behaves. This expertise can only be gained with exposure to a variety of data sets and problems. Join our community of over 20,000 aspiring data scientists for a rich discussion on problems like these and get interview-ready for your dream job at top companies like Netflix, Uber, Amazon, Google, Microsoft, and many more.
Share